 2020, Vol. 40
文章信息
- 龚旭, 付强, 王磊, 杨彪, 张全建, 张远彬
- GONG Xu, FU Qiang, WANG Lei, YANG Biao, ZHAGN Quanjian, ZHANG Yuanbin
- 四川鞍子河保护地水鹿和羚牛栖息地适宜性评价与重叠性分析
- Habitat suitability assessment and overlap analysis of Rusa unicolor and Budorcas taxicolor in Anzihe Reserve, Sichuan Province
- 生态学报. 2020, 40(14): 4842-4851
- Acta Ecologica Sinica. 2020, 40(14): 4842-4851
- http://dx.doi.org/10.5846/stxb201909111896
-
文章历史
- 收稿日期: 2019-09-11
- 修订日期: 2020-04-28


2. 中国科学院大学, 北京 100049;
3. 四川鞍子河自然保护区管理处, 崇州 611239;
4. 西南野生动植物资源保护教育部重点实验室, 南充 637002;
5. 西华师范大学, 南充 637002
2. University of Chinese Academy of Sciences, Beijing 100049, China;
3. Management Office of Sichuan Anzihe Nature Reserve, Chongzhou 611239, China;
4. Key Laboratory of Southwest China Wildlife Resource Conservation(China West Normal University), Ministry of Education, Nanchong 637002, China;
5. China West Normal University, Nanchong 637002, China
濒危物种保护不仅需要维持种群数量, 还要保护其生存环境——栖息地, 而了解和掌握物种的空间分布格局和对栖息地的利用特征是制定相关保护和管理策略的前提和基础[1-3]。栖息地适宜性评价是以动物栖息地环境为基础, 通过研究动物分布区域内各种环境因子的状态, 评价与筛选出影响动物个体生存和种群繁衍的关键环境因子, 明确研究范围内适宜动物生存、分布空间的方法[4]。近年来, 利用3S (GIS, RS, GPS)技术结合物种分布模型进行栖息地适宜性评价已越来越多的运用到物种栖息地研究[5-6]。目前, 应用较为广泛的模型有基于遗传算法的规则组合模型(GARP)、生态位因子分析模型(ENFA)、CLIMEX、箱盒环境包络(Bioclim)、Gower距离(Domain)、最大熵模型(MaxEnt)等[7-11]。其中, 最大熵模型作为最具代表性的几种生态位模型之一[12-13], 相较于其他模型表现出更好的预测能力[14-16], 已在国内外物种栖息地适宜性评价研究中得到广泛应用[17-18]。
偶蹄目牛科的羚牛(Budorcas taxicolor)和鹿科的水鹿(Rusa unicolor)分别是国家Ⅰ、Ⅱ级重点保护野生动物[19], 也是我国西南山地森林生态系统中有蹄类动物的重要组成部分[20-21]。近年来, 由于栖息地质量退化、破碎化以及偷猎等人类活动影响致使水鹿和羚牛数量锐减, 种群现状及与保护相关的研究已是当务之急[22-23]。而关于二者的研究多集中于某单一物种的研究[24-31], 随着生态学和保护生物学理论的发展, 学者们开始关注研究同域有蹄类的栖息地生境选择问题。研究同域有蹄类物种的栖息地选择, 不仅对认识物种共存、竞争及生态位分化具有重要理论意义, 也有助于有蹄类群落动物资源分配探讨和区域生物多样性保护[32-34]。
本文在利用红外相机和样线法获取水鹿和羚牛实体、痕迹、粪便等有效点位信息后, 结合气象、地形、植被等变量信息, 拟用最大熵模型对四川鞍子河保护地水鹿和羚牛栖息地的适宜性进行评价, 分析水鹿和羚牛对栖息地的利用特征和适宜、较适宜栖息地空间分布格局, 探讨同域分布的水鹿和羚牛栖息地重叠性。研究结果可为水鹿和羚牛及其栖息地保护提供科学参考。
1 材料与方法 1.1 研究区域概述本文研究区域位于四川鞍子河保护地, 保护地位于四川省崇州市, 地处邛崃山系支脉龙门山, 与汶川县的卧龙自然保护区和大邑县的黑水河自然保护区接壤。保护地地理坐标位于东经103°07′ — 103°17′, 北纬30°43′ — 30°51′之间, 总面积为15082.7 hm2(图 1)。地势西北高东南低, 地貌深切, 坡度较大, 最高海拔3824 m, 最低1238 m。保护地属于中亚热带湿润季风气候, 山地气候类型, 云雾多, 日照少, 湿度大。年平均气温12.5℃, 七月最高温28.3℃。年平均降水量1000—1220 mm, 多夜雨, 无显著干旱季节。年平均日照641.06 h, 无霜期200—230 d, 年平均相对湿度86%。保护地内植被垂直带谱十分明显, 随海拔的升高, 植被依次成带状更替:常绿阔叶林带、针阔叶混交林带、亚高山针叶林带、常绿与落叶阔叶交林带、亚高山灌丛和高山草甸带。

|
| 图 1 研究区域位置图 Fig. 1 The location of Study area |
本文采用最大熵模型分别对四川鞍子河保护地内水鹿和羚牛进行栖息地适宜性评价。最大熵模型是基于生态位原理, 依据物种分布点的环境特征得到约束条件, 探寻该约束条件下最大熵的分布可能性, 从而预测物种的适宜栖息地分布, 是目前物种分布预测中使用最广泛的生态位模型[12]。SDMtoolbox工具通过剔除空间自相关性高的环境变量和分布点数据, 提高MaxEnt的应用效率[35]。基于MaxEnt模拟结果, 用ENMTool工具计算水鹿和羚牛的空间生态位重叠度[36], 然后利用ArcGIS 10.3确定两个物种的适宜栖息地重叠区域。
1.3 数据来源及预处理最大熵模型要求两组数据, 一是研究物种的实际分布点数据, 以经纬度的形式表示;二是研究区域的环境变量数据, 主要包括气候因子、地形因子、植被因子、水系因子和人类干扰因子等。
1.3.1 物种分布点数据水鹿、羚牛分布点数据源于野外样线调查以及红外相机监测数据(图 2), 调查范围覆盖鞍子河保护地内水鹿和羚牛栖息地全部植被类型, 保证了分布点的代表性和准确性, 共得到水鹿点位229个、羚牛点位193个。利用SDMtoolbox工具剔除数据中的重复位点、高度自相关点[4], 共筛选得到水鹿有效点位124个、羚牛有效点位79个(图 2)。

|
| 图 2 研究区域水鹿和羚牛位点图 Fig. 2 The distribution of Rusa unicolor of and Budorcas taxicolor in the study area |
相关研究表明, 有蹄类动物栖息地选择利用主要受气候、地形、水源、植被等生态因子影响[37], 同时人类活动也会影响其分布[38]。因此, 本文选取气候、地形、水源植被、干扰等变量来评价四川鞍子河保护地内水鹿和羚牛栖息地的适宜性。(1)气候数据包括19个环境因子, 来源于世界气候数据库(http://www.worldclim.org), 分辨率为1 km×1 km;(2)地形数据包括高程、坡度、坡向, 来源于美国国家航空航天局(NASA), 分辨率为2.08 m×2.08 m;(3)植被数据通过解译2015年4月15日遥感影像监督分类得到, 来源于谷歌地球(Google Earth), 分辨率为0.51 m×0.51 m, 包括常绿针叶林、落叶阔叶混交林、常绿阔叶林、落叶阔叶林、竹林、针阔混交林、落叶针叶林、亚高山灌丛、高寒草甸、人工林10类植被类型, 分类后将每一种类型选取50个参考点用于精度评价, 评价结果达到了90%以上的总体精度, 证明解译结果和真实情况一致性高[39];(4)水源数据以高程为基础, 利用ArcGIS 10.3的水文模块得到;(5)干扰数据包括距道路距离、距建设用地距离, 利用ArcGIS 10.3得到相关图层。利用SDMtoolbox剔除相关性过高(|r|≥0.75)的环境变量[40], 最终得到15个环境变量(表 1)。筛选后的环境变量均以ArcGIS 10.3为平台, 将所有环境变量的图层统一边界, 坐标系统一为WGS_1984_UTM_Zone_49N坐标, 转化为MaxEnt识别的ASCⅡ文件格式。
| 环境变量 Environment variables |
描述 Description |
| 气候变量Climate variables | 年均温/℃ |
| 平均日较差/℃ | |
| 最暖月的最高温/℃ | |
| 最暖季均温/℃ | |
| 最冷季均温/℃ | |
| 年降水/mm | |
| 最湿月降水量/mm | |
| 降雨量季节性变异系数 | |
| 地形变量Topographic variables | 高程Elevation/m |
| 坡度/(°) | |
| 坡向 | |
| 水源植被变量 | 距水源距离/m |
| River and vegetation variables | 植被类型 |
| 干扰变量Disturbance variables | 距建设用地距离/m |
| 距道路距离/m |
将整理后的水鹿和羚牛有效点位和15个环境因子依次代入MaxEnt3.4.1 (Maxent3.4.1, http://biodiversityinformatics.amnh.org/Open_source/maxent/), 验证模型时随机选择25%的分布位点, 构建模型时使用其余的75%分布位点, 创建每个环境因子的响应曲线, 以此评价每个环境因子对模型的贡献率, 其他参数的选定均设为模型自动默认值, 计算结果以Logistic格式显示输出[12]。利用ROC曲线(受试者工作特征曲线)下的面积(AUC值)检验模型分析预测效果, 其值在0—1;其中, 0.5—0.6为不合格、0.6—0.7为差、0.7—0.8为普通、0.8—0.9为良好、0.9—1为优秀[41]。
在ArcGIS 10.3中对模型预测分布图进行重分类, 分为不适宜栖息地、较适宜栖息地、适宜栖息地三类:阈值0—0.2为不适宜栖息地、0.2—0.5为较适宜栖息地、0.5—1为适宜栖息地[42]。
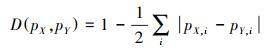
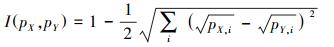
1.4.2 空间生态位重叠分析采用ENM Tools 1.4.4计算水鹿和羚牛的空间生态位重叠度, 该软件通过计算Schoener′D (D)和Hellinger′s-based I (I)值用来表示空间生态位重叠度, D值和I值介于0—1之间, 值越大, 空间生态位重叠度越高。
|
(1) |
|
(2) |
式中, pX, i和pY, i表示MaxEnt模型结果中第i个栅格单元物种X和Y的归一化栖息地适宜性评分。
2 结果与分析 2.1 最大熵模型预测结果的可信度根据MaxEnt中ROC曲线评价结果可知, 水鹿的训练数据与测试数据的AUC值分别为0.888和0.916, 羚牛的训练数据与测试数据的AUC值分别为0.813和0.742(图 3), 表明最大熵模型对四川鞍子河保护地水鹿和羚牛栖息地适宜性评价的预测结果达到良好水平, 模型结果具有一定可信度。

|
| 图 3 MaxEnt预测结果的ROC曲线 Fig. 3 ROC curve of MaxEnt model prediction results |
水鹿栖息地适宜性模型结果显示, 环境因子贡献率较大的有距道路距离(23.0%)、坡度(21.5%)、最冷季均温(15.8%)、高程(11.8%)、年降水(8.8%)、最暖季均温(8.1%)、距水源距离(3.0%)、最暖月的最高温(2.9%)、植被类型(2.8%)和坡向(1.2%)。其中, 气候变量累计贡献率36.4%, 地形变量累计贡献率34.5%, 水源植被变量累计贡献率5.8%, 干扰变量累计贡献率23.3%(表 2)。
| 环境因子 Environmental factors |
贡献率 Contribution rate/% |
| 距道路距离 Distance to roads |
23.0 |
| 坡度 Slope |
21.5 |
| 最冷季均温 Mean temperature of coldest month |
15.8 |
| 高程 Elevation |
11.8 |
| 年降水 Annual precipitation |
8.8 |
| 最暖季均温 Mean temperature of warmest month |
8.1 |
| 距水源距离 Distance to river |
3.0 |
| 最暖月的最高温 Max temperature of warmest month |
2.9 |
| 植被类型 Vegetation types |
2.8 |
| 坡向 Aspect |
1.2 |
羚牛栖息地适宜性评价结果显示, 环境因子贡献率较大的是距水源距离(31.1%)、年降水(25.8%)、植被类型(13.8%)、坡度(12.9%)、距道路距离(5.7%)、坡向(4.4%)、最暖月的最高温(3.9%)和最冷季均温(1.0%)。其中, 气候变量累计贡献率31.4%, 地形变量累计贡献率17.5%, 水源植被变量累计贡献率44.9%, 干扰变量累计贡献率6.2%(表 3)。
| 环境因子 Environmental factors |
贡献率 Contribution rate/% |
| 距水源距离 Distance to river |
31.1 |
| 年降水 Annual precipitation |
25.8 |
| 植被类型 Vegetation types |
13.8 |
| 坡度 Slope |
12.9 |
| 距道路距离 Distance to roads |
5.7 |
| 坡向 Aspect |
4.4 |
| 最暖月的最高温 Max temperature of warmest month |
3.9 |
| 最冷季均温 Mean temperature of coldest month |
1.0 |
利用ENM Tools 1.4.4计算得到生态位重叠指数D和I值分别为0.6739和0.9098, 表明保护地内水鹿和羚牛空间生态位重叠度较高。栖息地适宜性评价结果显示, 水鹿适宜、较适宜和不适宜栖息地面积分别为943.23 hm2、3390.15 hm2和10749.32 hm2, 分别占总面积的6.25%、22.48%和71.27%(表 4和图 4)。羚牛适宜、较适宜和不适宜栖息地面积分别为1808.37 hm2、8384.35 hm2和4889.98 hm2, 分别占总面积的11.99%、55.59%和32.42%(表 4和图 4)。利用ArcGIS叠加分析得出二者的适宜栖息地重叠区域面积为261.10 hm2, 较适宜栖息地重叠区域面积为2048.41 hm2(图 5)。
| 栖息地质量等级 Habitat quality grade |
水鹿Rusa unicolor | 羚牛Budorcas taxicolor | |||
| 面积 Area/hm2 |
百分比 Percentage/% |
面积 Area/hm2 |
百分比 Percentage/% |
||
| 适宜栖息地Suitable habitats | 943.23 | 6.25 | 1808.37 | 11.99 | |
| 较适宜栖息地Relatively suitable habitats | 3390.15 | 22.48 | 8384.35 | 55.59 | |
| 不适宜栖息地Unsuitable habitats | 10749.32 | 71.27 | 4889.98 | 32.42 | |
| 总计Sum | 15082.70 | 100.00 | 15082.70 | 100.00 | |

|
| 图 4 保护地内水鹿和羚牛栖息地评价结果及其分布图 Fig. 4 Suitable habitat distribution map of Rusa unicolor and Budorcas taxicolor in protected areas |

|
| 图 5 保护地内水鹿和羚牛的适宜和较适宜栖息地重叠关系图 Fig. 5 Suitable and moderately suitable habitats overlap map of Rusa unicolor and Budorcas taxicolor in protected areas |
最冷季均温、年降水、最暖季均温等气候因子对水鹿分布起重要作用, 水鹿喜欢潮湿、温度适中的区域[43-44], 这种偏好可能反映了水鹿的生理需求[26]。地形变量中坡度最为重要, 水鹿偏好开阔平坦的栖息地[45], 常回避陡峭地形, 缓坡区域食物资源丰富且易取食, 同时遇见危险时方便逃生[46]。水源和植被也对水鹿分布产生一定的影响, 在山涧溪流附近, 水鹿的活动频率会增加[47], 而水鹿适宜栖息地内植被类型以低山人工林、落叶阔叶林、低山沟谷灌丛等为主, 上述生境不仅为水鹿提供了良好的生长隐蔽场所, 也提供了主要食物来源[48]。道路是决定水鹿栖息地适宜性的最重要因素, 与Yen等[49]研究结果一致, 表明水鹿易受到人类活动影响。
年降水、最暖月的最高温等气候因子对羚牛栖息地分布有明显影响, 可能与羚牛夏季怕炎热, 冬季常晒阳光取暖的生物习性有关[50]。地形变量中坡度贡献率最高, 有研究表明羚牛也喜好地势平缓但海拔相对较高的区域内活动[29, 51], 这些区域能够为羚牛提供多样的食物资源, 也降低了羚牛移动过程中的能量消耗[52-53]。水源和植被对羚牛分布影响最大, 与吴鹏举等[54]研究西藏慈巴沟自然保护区四川羚牛栖息地选择研究结果不同。研究发现保护地内羚牛偏好距水源较近的区域内活动, 野外调查发现这些区域附近盐井分布较多, 而羚牛需要舔盐来补充自身所需的微量元素[55], 羚牛适宜栖息地区域内植被类型以高山灌丛、亚高山暗针叶林、针阔混交林、沟谷次生灌丛等为主, 与张利祥等[56]研究独龙江流域羚牛分布结果类似, 有利于羚牛的觅食、穿行[57]。羚牛的适宜栖息地也避开了保护地内人类活动的高频区域[58]。
同域偶蹄类动物栖息地选择利用可能受到资源获取、捕食风险、种间竞争、人类干扰等因素的影响[34, 59-60], 而生境分离是同域偶蹄目物种共存的主要原因, 模型结果表明保护地内水鹿和羚牛分布在栖息地选择利用上具有相似性与差异性, 而这些差异性可能是导致它们相互适应、长期共存的原因之一[61]。
3.2 水鹿和羚牛栖息地的空间分布格局与重叠性生态位理论认为, 同域分布的相似物种面临食物、水分、空间和营养元素的竞争, 会在资源利用的时间、空间和方式等多个维度分化, 形成特定的分布格局[62]。本研究表明水鹿和羚牛对于生境的选择利用并非由单一环境因子所决定的, 水鹿主要分布在保护地中、南部区域, 活动范围在1474—3336 m之间(图 4);而羚牛主要分布在保护地中、西部区域, 活动范围在1467—3823 m之间。水鹿和羚牛的适宜栖息地在保护地东部区域分布较少, 野外调查发现这些区域地势陡峭, 水源少, 离公路近, 不利于水鹿和羚牛的生存。本研究表明保护地内水鹿和羚牛在空间分布格局上具有较高的重叠现象, 重叠区域主要集中在保护地中、南部低山河谷区, 面积达3933.82 hm2(图 5), 占保护地面积的26.08%, 说明水鹿和羚牛生态位相似。Bagchi等[63]指出当同域有蹄类动物生态位重叠时, 它们会在其他因子的生态位上产生分离, 以降低多维生态位的重叠, 从而维持种间的共存。事实上, 在诸多环境因子中, 植被类型与栖息地内动物的食源植物分布密切相关[64], 而食物的种类丰富度、营养质量常被认为是影响野生动物栖息地选择利用的最重要因子[65-66]。据调查, 水鹿以各种草本和木本植物为食[67], 而羚牛主要采食灌木嫩叶和草本植物[27]。根据最优取食理论分析, 动物在食物资源量丰富时期, 会出现只取食最优质量食物的食性特化现象, 而当食物资源量匮乏时期, 会出现取食更多种食物的食性泛化现象[68]。因此, 鞍子河保护地内水鹿和羚牛空间生态位重叠的主要原因可能是二者对食物资源的相似需求, 特别是冬春季食物短缺的时候, 水鹿和羚牛都需要采食到足够的食物来补充身体能量的损耗。
本研究也表明人为干扰对水鹿和羚牛栖息地的分布影响较大, 与前人研究结果类似[69-70]。水鹿和羚牛的适宜栖息地重叠区域的海拔低, 离公路较近, 道路沿线的车辆、人类居住点、灯光、噪音、狗和游客的存在都会对野生动物造成干扰。因此, 建议相关部门加强保护管理和附近居民的宣传教育工作, 避免人兽冲突及减少栖息地干扰。
虽然红外相机由于安放位置、角度长期固定, 不同物种探测率有一定的差异, 数据容易有偏向性, 但最大熵模型模拟结果与野外调查大致相符。故本研究结果具有一定的参考价值, 能解释水鹿和羚牛在保护地的实际分布状况, 对制定相关保护和管理策略具有一定的指导作用。未来需加强四川鞍子河保护地水鹿、羚牛、斑羚等同域有蹄类动物的食性研究以及食性特征与栖息地选择利用之间相关性的研究。
| [1] |
Wilson J W, Sexton J O, Jobe R T, Haddad N M. The relative contribution of terrain, land cover, and vegetation structure indices to species distribution models. Biological Conservation, 2013, 164: 170-176. |
| [2] |
李佳, 李言阔, 缪泸君, 谢光勇, 袁芳凯. 江西桃红岭国家级自然保护区梅花鹿生境适宜性评价. 生态学报, 2014, 34(5): 1274-1283. |
| [3] |
Khadka K K, James D A. Habitat selection by endangered Himalayan musk deer (Moschus chrysogaster) and impacts of livestock grazing in Nepal Himalaya:implications for conservation. Journal for Nature Conservation, 2016, 31: 38-42. |
| [4] |
唐书培, 穆丽光, 王晓玲, 张静, 刘波, 孟和达来, 鲍伟东. 基于MaxEnt模型的赛罕乌拉国家级自然保护区斑羚生境适宜性评价. 北京林业大学学报, 2019, 41(1): 102-108. |
| [5] |
Martin J, Revilla E, Quenette P Y, Naves J, Allainé D, Swenson J E. Brown bear habitat suitability in the Pyrenees:transferability across sites and linking scales to make the most of scarce data. Journal of Applied Ecology, 2012, 49(3): 621-631. |
| [6] |
高惠, 滕丽微, 汪洋, 王继飞, 刘振生. 阿拉善马鹿(Cervus alashanicus)生境适宜性评价. 生态学报, 2017, 37(11): 3926-3931. |
| [7] |
许仲林, 彭焕华, 彭守璋. 物种分布模型的发展及评价方法. 生态学报, 2015, 35(2): 557-567. |
| [8] |
Darabi H, Choubin B, Rahmati O, Haghighi A T, Pradhan B, Klove B. Urban flood risk mapping using the GARP and QUEST models:a comparative study of machine learning techniques. Journal of Hydrology, 2019, 569: 142-154. |
| [9] |
Srivastava V, Griess V C, Padalia H. Mapping invasion potential using ensemble modelling.A case study on Yushania maling in the Darjeeling Himalayas. Ecological Modelling, 2018, 385: 35-44. |
| [10] |
Kalboussi M, Achour H. Modelling the spatial distribution of snake species in northwestern Tunisia using maximum entropy (Maxent) and Geographic Information System (GIS). Journal of Forestry Research, 2018, 29(1): 233-245. |
| [11] |
Ge X Z, He S Y, Zhu C Y, Wang T, Xu Z C, Zong S X. Projecting the current and future potential global distribution of Hyphantria cunea (Lepidoptera:Arctiidae) using CLIMEX. Pest Management Science, 2019, 75(1): 160-169. |
| [12] |
Phillips S J, Anderson R P, Schapire R E. Maximum entropy modeling of species geographic distributions. Ecological Modelling, 2006, 190(3/4): 231-259. |
| [13] |
蔡静芸, 张明明, 粟海军, 张海波. 生态位模型在物种生境选择中的应用研究. 经济动物学报, 2014, 18(1): 47-52, 58. |
| [14] |
Elith J, Graham C H, Anderson R P, Dudík M, Ferrier S, Guisan A, Hijmans R J, Huettmann F, Leathwick J R, Lehmann A, Li J, Lohmann L G, Loiselle B A, Manion G, Moritz C, Nakamura M, Nakazawa Y, Overton J M M, Peterson A T, Phillips S J, Richardson K, Scachetti-Pereira R, Schapire R E, Soberón J, Williams S, Wisz M S, Zimmermann N E. Novel methods improve prediction of species' distributions from occurrence data. Ecography, 2006, 29(2): 129-151. |
| [15] |
王运生, 谢丙炎, 万方浩, 肖启明, 戴良英. ROC曲线分析在评价入侵物种分布模型中的应用. 生物多样性, 2007, 15(4): 365-372. |
| [16] |
赵泽芳.气候变化下物种分布模型建构与模型比较[D].西安: 陕西师范大学, 2018. http://cdmd.cnki.com.cn/Article/CDMD-10718-1018233270.htm
|
| [17] |
Elith J, Leathwick J R. Species distribution models:ecological explanation and prediction across space and time. Annual Review of Ecology, Evolution, and Systematics, 2009, 40: 677-697. |
| [18] |
Yamada Y, Itagawa S, Yoshida T, Fukushima M, Ishii J, Nishigaki M, Ichinose T. Predicting the distribution of released oriental white stork (Ciconia boyciana) in central Japan. Ecological Research, 2019, 34(2): 277-285. |
| [19] |
刘艳, 蒲志勇. 羚牛. 经济动物学报, 2016, 20(2): 125. |
| [20] |
岳建兵. 4种有蹄类动物栖息地选择比较研究. 林业资源管理, 2014(3): 109-112, 125-125. |
| [21] |
蒋志刚. 中国哺乳动物多样性及地理分布. 北京: 科学出版社, 2015.
|
| [22] |
Ménard N, Rantier Y, Foulquier A, Qarro M, Chillasse L, Vallet D, Pierre J S, Butet A. Impact of human pressure and forest fragmentation on the endangered barbary macaque Macaca sylvanus in the middle atlas of morocco. Oryx, 2014, 48(2): 276-284. |
| [23] |
Shahnaseri G, Hemami M R, Khosravi R, Malakoutikhah S, Omidi M, Cushman S A. Contrasting use of habitat, landscape elements, and corridors by grey wolf and golden jackal in central Iran. Landscape Ecology, 2019, 34(6): 1263-1277. |
| [24] |
Cheyne S M, Sastramidjaja W J, Muhalir, Rayadin Y, Macdonald D W. Mammalian communities as indicators of disturbance across Indonesian Borneo. Global Ecology and Conservation, 2016, 7: 157-173. |
| [25] |
张晋东, 李玉杰, 黄金燕, 白文科, 周世强, 李应洪, 周材权. 利用红外相机建立野生水鹿行为谱及PAE编码系统. 兽类学报, 2018, 38(1): 1-11. |
| [26] |
Yen S C, Wang Y, Yu P H, Kuan Y P, Liao Y C, Chen K H, Weng G J. Seasonal space use and habitat selection of sambar in Taiwan. Journal of Wildlife Managemen, 2019, 83(1): 22-31. DOI:10.1002/jwmg.21578 |
| [27] |
胡杰, 姚刚, 黎大勇, 杨志松, 李艳红. 卧龙国家级自然保护区水鹿夏季生境选择. 兽类学报, 2018, 38(3): 277-285. |
| [28] |
Liu X H, Wu P F, Shao X M, Songer M, Cai Q, He X B, Zhu Y. Diversity and activity patterns of sympatric animals among four types of forest habitat in Guanyinshan Nature Reserve in the Qinling Mountains, China. Environmental Science and Pollution Research, 2017, 24(19): 16465-16477. |
| [29] |
胡大明, 邓玥, 温平, 梁磊, 夏奎, 官天培. 白水河国家级自然保护区羚牛适宜栖息地评价. 四川林业科技, 2018, 39(6): 67-70, 85. |
| [30] |
Wei W, Han H, Zhou H, Hong M S, Cao S S, Zhang Z J. Microhabitat use and separation between giant panda (Ailuropoda melanoleuca), takin (Budorcas taxicolor), and goral (Naemorhedus griseus) in Tangjiahe Nature Reserve, China. Folia Zoologica, 2018, 67(3/4): 198-206. |
| [31] |
Kang D W, Li S, Wang X R, Huang J, Li J Q. Comparative habitat use by takin in the Wanglang and Xiaohegou Nature Reserves. Environmental Science and Pollution Research, 2018, 25(8): 7860-7865. |
| [32] |
Wu W, Li Y H, Hu Y M. Simulation of potential habitat overlap between red deer (Cervus elaphus) and roe deer (Capreolus capreolus) in northeastern China. PeerJ, 2016, 4: e1756. |
| [33] |
Bista M, Panthi S, Weiskopf S R. Habitat overlap between asiatic black bear Ursus thibetanus and red panda Ailurus fulgens in himalaya. PLoS One, 2018, 13(9): e0203697. |
| [34] |
Liu Z S, Zhu Z L, Gao H, Zhao C, Sun Y J, Teng L W. Comparative analysis of winter diets and habitat use by the sympatric blue sheep (Pseudois nayaur) and Alashan red deer (Cervus alashanicus) in the Helan Mountains, China. Folia Zoologica, 2018, 67(1): 43-53. |
| [35] |
Brown J L. SDMtoolbox:a python-based GIS toolkit for landscape genetic, biogeographic and species distribution model analyses. Methods in Ecology and Evolution, 2014, 5(7): 694-700. |
| [36] |
Warren D L, Glor R E, Turelli M. ENMTools:a toolbox for comparative studies of environmental niche models. Ecography, 2010, 33(3): 607-611. |
| [37] |
吴鹏举, 张宏, 张恩迪. 西藏慈巴沟自然保护区主要偶蹄类动物春季垂直分布和栖息地分化. 生态学杂志, 2007, 26(10): 1569-1573. |
| [38] |
萨如拉, 张荣, 高润宏. 内蒙古高原有蹄类动物资源的分布与历史变迁. 林业资源管理, 2019(1): 12-18. |
| [39] |
Manandhar R, Odeh I O A, Ancev T. Improving the accuracy of land use and land cover classification of Landsat data using post-classification enhancement. Remote Sensing, 2009, 1(3): 330-344. |
| [40] |
Wen L, Saintilan N, Yang X H, Hunter S, Mawer D. MODIS NDVI based metrics improve habitat suitability modelling in fragmented patchy floodplains. Remote Sensing Applications:Society and Environment, 2015, 1: 85-97. |
| [41] |
Erasmus B F N, van Jaarsveld A S, Chown S L, Kshatriya M, Wessels K J. Vulnerability of South African animal taxa to climate change. Global Change Biology, 2002, 8(7): 679-693. |
| [42] |
王袁.基于MaxEnt模型的神农架川金丝猴不同季节生境识别[D].武汉: 华中农业大学, 2014. http://cdmd.cnki.com.cn/article/cdmd-10504-1014231449.htm
|
| [43] |
何兴成, 付强, 吴永杰, 王彬, 陈雪, 冉江洪. 水鹿的群体结构和活动节律分析. 兽类学报, 2019, 39(2): 134-141. |
| [44] |
Gormley A M, Forsyth D M, Griffioen P, Lindeman M, Ramsey D S L, Scroggie M P, Woodford L. Using presence-only and presence-absence data to estimate the current and potential distributions of established invasive species. Journal of Applied Ecology, 2011, 48(1): 25-34. |
| [45] |
Trisurat Y, Pattanavibool A, Gale G A, Reed D H. Improving the viability of large-mammal populations by using habitat and landscape models to focus conservation planning. Wildlife Research, 2010, 37(5): 401-412. |
| [46] |
Simcharoen A, Savini T, Gale G A, Roche E, Chimchome V, Smith J L D. Ecological factors that influence sambar (Rusa unicolor) distribution and abundance in western Thailand:implications for tiger conservation. Raffles Bulletin of Zoology, 2014, 62: 100-106. |
| [47] |
胡锦矗, 王酉之. 四川资源动物志第二卷兽类. 成都: 四川科学技术出版社, 1984.
|
| [48] |
王盼, 白文科, 黄金燕, 张晋东, 刘巅, 夏珊珊, 饶佳, 周材权. 同域分布大熊猫和水鹿生境利用分异特征. 生态学报, 2018, 38(15): 5577-5583. |
| [49] |
Yen S C, Wang Y, Ou H Y. Habitat of the Vulnerable Formosan sambar deer Rusa unicolor swinhoii in Taiwan. Oryx, 2014, 48(2): 232-240. |
| [50] |
吴家炎, 吕宗宝, 郑永烈, 邵孟明. 秦岭太白山区羚牛生态的初步观察. 动物学杂志, 1966(3): 107-108. |
| [51] |
Guan T P, Wang F, Li S, McShea W J. Nature reserve requirements for landscape-dependent ungulates:the case of endangered takin (Budorcas taxicolor) in Southwestern China. Biological Conservation, 2015, 182: 63-71. |
| [52] |
黄华梨, 张涛, 杨文赟. 白水江自然保护区羚牛的分布与栖息地特征. 兽类学报, 1996, 16(3): 230-230. |
| [53] |
官天培, 谌利民, 郑维超, 陈万里, 宋延龄. 四川羚牛春季地形选择特征的初步研究. 动物学杂志, 2015, 50(3): 329-336. |
| [54] |
吴鹏举, 张恩迪. 西藏慈巴沟自然保护区羚牛栖息地选择. 兽类学报, 2006, 26(2): 152-158. |
| [55] |
邓其祥. 天全县蜂子河羚牛生态调查. 动物学杂志, 1984(6): 30-33. |
| [56] |
张利祥, 白洪斌, 丰志全, 马驰, 孙文莫, 崔亮伟, 肖文. 独龙江流域羚牛的种群、分布和保护. 四川动物, 2014, 33(04): 493-497. |
| [57] |
李爽, 康东伟, 李俊清, 黄舰, 宋政. 大熊猫、羚牛和川金丝猴的生境利用比较. 东北林业大学学报, 2017, 45(9): 81-83. |
| [58] |
Yan W B, Zeng Z G, Gong H S, He X B, Liu X Y, Si K C, Song Y L. Habitat use and selection by takin in the Qinling Mountains, China. Wildlife Research, 2016, 43(8): 671-680. |
| [59] |
Courbin N, Dussault C, Veillette A, Giroux M A, Côté S D. Coping with strong variations in winter severity:plastic habitat selection of deer at high density. Behavioral Ecology, 2017, 28(4): 1037-1046. DOI:10.1093/beheco/arx062 |
| [60] |
Steinmetz R, Garshelis D L, Chutipong W, Seuaturien N. The shared preference niche of sympatric Asiatic black bears and sun bears in a tropical forest mosaic. PLoS One, 2011, 6(1): e14509. |
| [61] |
和梅香, 陈俪心, 罗概, 古晓东, 王戈, 冉江洪. 凉山山系大熊猫和黑熊适宜生境预测及重叠分析. 生物多样性, 2018, 26(11): 1180-1189. |
| [62] |
Darmon G, Calenge C, Loison A, Jullien J M, Maillard D, Lopez J F. Spatial distribution and habitat selection in coexisting species of mountain ungulates. Ecography, 2012, 35(1): 44-53. |
| [63] |
Bagchi S, Goyal S P, Sankar K. Niche relationships of an ungulate assemblage in a dry tropical forest. Journal of Mammalogy, 2003, 84(3): 981-988. |
| [64] |
Wu W, Li Y H, Hu Y M, Chang Y, Xiong Z P. Anthropogenic effect on forest landscape pattern and Cervidae habitats in northeastern China. Journal of Geographical Sciences, 2019, 29(7): 1098-1112. |
| [65] |
Cransac N, Hewison A J M. Seasonal use and selection of habitat by mouflon (Ovis gmelini):comparison of the sexes. Behavioural Processes, 1997, 41(1): 57-67. |
| [66] |
Tuboi C, Hussain S A. Factors affecting forage selection by the endangered Eld's deer and hog deer in the floating meadows of Barak-Chindwin Basin of North-east India. Mammalian Biology, 2016, 81(1): 53-60. |
| [67] |
袁喜才, 王宝琳. 海南岛水鹿. 野生动物, 1983(6): 37-39. |
| [68] |
吕忠海, 冯源, 于沿泽, 张明海, 张玮琪. 高食性重叠度对同域物种生境分离的影响——以马鹿和狍为例. 东北林业大学学报, 2020(2): 72-75. |
| [69] |
Rahman D A, Gonzalez G, Haryono M, Muhtarom A, Firdaus A Y, Aulagnier S. Factors affecting seasonal habitat use, and predicted range of two tropical deer in Indonesian rainforest. Acta Oecologica, 2017, 82: 41-51. |
| [70] |
Leclerc M, Tarroux A, Fauchald P, Stien A, Tveraa T, St-Laurent M H. Effects of human-induced disturbances and weather on herbivore movement. Journal of Mammalogy, 2019, 100(5): 1490-1500. |