 2019, Vol. 39
文章信息
- 牛忠恩, 胡克梅, 何洪林, 任小丽, 张黎, 葛蓉, 李攀, 郑涵, 朱晓波, 曾纳
- NIU Zhongen, HU Kemei, HE Honglin, REN Xiaoli, ZHANG Li, GE Rong, LI Pan, ZHENG Han, ZHU Xiaobo, ZENG Na
- 2000-2015年中国陆地生态系统蒸散时空变化及其影响因素
- The spatial-temporal patterns of evapotranspiration and its influencing factors in Chinese terrestrial ecosystem from 2000 to 2015
- 生态学报. 2019, 39(13): 4697-4709
- Acta Ecologica Sinica. 2019, 39(13): 4697-4709
- http://dx.doi.org/10.5846/stxb201803090467
-
文章历史
- 收稿日期: 2018-03-09
- 网络出版日期: 2019-04-17


2. 中国科学院大学, 北京 100049;
3. 大连海事大学, 大连 116026;
4. 中国科学院地球化学研究所, 贵阳 550002;
5. 中国科学院地球环境研究所, 黄土与第四纪地质国家重点实验室, 西安 710061;
6. 西南大学地理科学学院, 遥感大数据应用重庆市工程研究中心, 重庆 400715
2. University of Chinese Academy of Sciences, Beijing 100049, China;
3. Dalian Maritime University, Dalian 116026, China;
4. Institute of Geochemistry, Chinese Academy of Sciences, Guiyang 550002, China;
5. State Key Laboratory of Loess and Quaternary Geology, Institute of Earth Environment, Chinese Academy of Sciences, Xi'an 710061, China;
6. Chongqing Engineering Research Center for Remote Sensing Big Data Application, School of Geographical Sciences, Southwest University, Chongqing 400715, China
蒸散是陆地生态系统碳水循环及能量流动的重要组成部分, 与生态系统生产力紧密相关[1-6], 其吸收了约一半的陆地生态系统太阳辐射, 并将60%以上的降水返回到大气层中[5, 7-9]。由于气候变化和人类活动的影响, 过去十几年内全球蒸散呈上升趋势, 但不同地区蒸散仍存在很大不确定性[5, 10-12]。准确模拟和量化区域尺度蒸散及其影响因素对全球碳水循环具有十分重要的意义[1]。
区域蒸散模型是准确获取全球及区域尺度长时间序列、高空间分辨率蒸散数据的重要手段。基于生物物理过程的机理模型具有坚实的理论基础且在站点尺度具有较好的表现, 但冠层导度等关键参数的估算问题限制了其应用范围[13-15]。近年来, 遥感技术的快速发展极大改善了大尺度土壤和植被的动态监测, 并在区域蒸散估算中发挥越来越重要的作用[16-19]。基于此, 已有学者构建了蒸散模拟的经验半经验模型[5, 20-23], 但表征空气动力学和表面阻力的一些重要变量很难通过遥感获取, 限制了其在大尺度上的应用[7, 24]。为克服经验模型的缺点, Cleugh等基于Penman-Monteith公式[25]发展了遥感驱动的蒸散模型[26], 并成功应用于全球MODIS产品的估算[8], 但许多计算冠层和气动阻力的参数仍依赖于地面气象观测和再分析产品[7]。Priestley-Taylor方程[27]可以认为是Penman-Monteith方程[25]的简化版本, 其避免了空气动力学和表面阻力的计算[23, 27-29], 可根据生理生态限制将潜在蒸散降低到实际蒸散[28], 因而得到广泛应用和发展[30-33]。WACMOS-ET项目基于通量观测数据、流域水量平衡数据等在站点及区域尺度比较了四种常用的区域蒸散估算模型(PM-MOD、GLEAM、PT-JPL、SEBE), 发现PT-JPL模型在绝大部分生态系统和气候区表现最优[34-35]。
中国陆地生态系统蒸散约占全球蒸散总量的5.6%—8.3%[2], 对全球碳水循环具有重要影响[1]。尽管当前针对区域尺度蒸散已经了大量研究, 但高精度蒸散模拟仍具有很大挑战[12, 36], 如基于8个蒸散模型模拟中国地区多年平均蒸散介于535—852 mm之间[36], 区域蒸散模拟需进一步改善。同时, 研究发现中国陆地生态系统蒸散与辐射、温度及水分均显著相关[18, 37], 但不同地区蒸散年际变化主导因素存在很大差异, 如在湿润地区, 辐射主导了蒸散年际变化, 而在干旱地区, 水分因子控制了蒸散的长时间变化趋势[2, 12]。近年来, 中国地区日益严重的空气污染问题导致大气气溶胶浓度上升[38-39], 同时东亚季风增强导致中国降雨带北移[40-41], 上述因素显著改变了中国地区的辐射及降水的空间格局, 并进一步影响蒸散的时空变化。当前已有很多研究报道了中国地区蒸散时间变化趋势[2, 7], 但气候变化对中国陆地生态系统不同地区蒸散的影响尚不明确。
本文基于PT-JPL模型, 集成遥感数据和栅格化气象数据模拟了中国陆地生态系统2000—2015年蒸散, 并进一步分析了全国及不同地区蒸散年际变化及其影响因素, 为研究更长时间尺度的蒸散时空变异及其环境控制机制和对未来气候变化的响应提供基础。
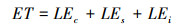
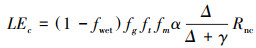
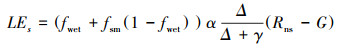
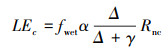
1 数据和方法 1.1 PT-JPL模型PT-JPL模型在避免空气动力学和表面阻力计算的情况下, 综合考虑多种生物物理因素的胁迫作用, 将Priestley-Taylor[27]方程估算的潜在蒸散降低到实际蒸散[28]。该模型通过能量分配将实际蒸散拆分为冠层蒸腾(LEc)、土壤蒸发(LEs)及林冠截留蒸发(LEi)三部分。冠层蒸腾指植物通过叶片将体内水分以水蒸气形式散失到体外的过程, 主要受植被形态、植被生长状况、温度和水分供应的影响; 土壤蒸发指土壤中水分通过上升和汽化从土壤表面进入大气的过程, 受到土壤表面和土壤内部含水量的双重影响; 林冠截留蒸发指林冠截留的降水直接蒸发, 主要受叶片表面湿润状况的影响[32]。模型主要结构见公式1—4, 详见参考文献[28]。
|
(1) |
|
(2) |
|
(3) |
|
(4) |
式中, α为Priestley-Taylor方程对潜在蒸散的原始描述(0.26)[42], Δ为温度-饱和水汽压斜率(kPa/℃), γ为干湿常数(0.066), Rnc为冠层截获净辐射(W/m2), Rns为土壤吸收净辐射(W/m2), G为土壤热通量(W/m2), fwet为相对地表湿度(无量纲), fg为绿叶覆盖比例(无量纲), ft为温度限制因子(无量纲), fm为植被水分限制因子(无量纲), fsm为土壤水分限制因子(无量纲)。
不同生态系统类型的气候条件、生态系统结构、植被特征存在很大差异, 因此本文将PT-JPL模型应用于中国陆地生态系统蒸散模拟时, 采用分植被类型设置模型关键参数(Topt、fm、fsm、kpar)的方法。依据CASA模型, 植被最优温Topt设定为温度、叶面积指数及植被冠层光合有效辐射吸收量乘积最大时的温度[32, 43]; 参考VPM模型中水分胁迫因子的计算方法[44-45], fm采用fapar+1)/(faparmax+1)形式计算, 其中fapar、faparmax分别为冠层吸收光合有效辐射的实际比例和最大比例[46]; fsm(fsm=RHVPD/β)计算中空气湿度变化响应曲线参数β以及消光系数kpar在不同植被类型的取值参见表 1, β取值主要来源于中国东部典型森林生态系统的观测结果, kpar取值主要来源于陆地生态系统的mate分析。
| 植被类型 Vegetation type |
参数β Parameter β |
参考文献 References |
消光系数 Extinction coefficient |
参考文献 References |
| 常绿针叶林Evergreen needleleaf forest | 1.5 | [46] | 0.45 | [47] |
| 常绿阔叶林Evergreen broadleaf forest | 1.5 | [46] | 0.59 | [47] |
| 落叶针叶林Deciduous needleleaf forest | 1.8 | [46] | 0.45 | [47] |
| 落叶阔叶林Deciduous broadleaf forest | 1.8 | [46] | 0.59 | [47] |
| 混交林Mixed forest | 1.8 | [46] | 0.50 | [28] |
| 灌丛Shrubland | 1.0 | [28] | 0.56 | [47] |
| 草地Grassland | 1.0 | [28] | 0.50 | [47] |
| 农田Cropland | 1.0 | [28] | 0.62 | [47] |
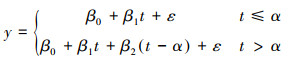
2000—2015年蒸散时间变化趋势采用线性回归模型获取。应用分段线性回归[48-49]获取不同年代际蒸散的变化强度:
|
(5) |
式中, t为年份, y为不同年份的蒸散; α为蒸散变化拐点, β0、β1、β2回归系数, ε为残差。
1.2.2 气候因子对蒸散的贡献气候因子对蒸散变化趋势(YET)的贡献率采用下列多元线性回归方程获取[50]:

|
(6) |

|
(7) |
式中, ε为残差, b0为常数项; bPRCP、bTAVG、bRa分别表示降水XPRCP、温度XTAVG、辐射XRa的拟合斜率; fi为各气候因子对蒸散变化趋势的贡献。
1.3 数据 1.3.1 观测数据本研究所用蒸散观测数据来源于已发表文献的搜集数据及中国通量观测网(http://www.chinaflux.org/)长期地面观测数据(图 1)。文献搜集蒸散数据来源于Zheng等[52], 共涵盖47个站点的146个站点-年数据, 用于验证年尺度模型模拟结果的精度及其空间异质性。中国通量网观测数据包括长白山、千烟洲、鼎湖山、西双版纳、禹城、内蒙古、当雄及海北灌丛等8个涡度通量观测站点, 对观测数据进行三次坐标轴旋转、WPL校正、无效数据剔除、夜间数据筛选等一系列处理后[53-54], 进一步将潜热(W/m2)换算到蒸散(mm/m2), 为验证模型模拟结果的年际波动, 将观测蒸散数据汇总到年尺度。

|
| 图 1 通量观测站点及文献搜集数据站点空间分布[51] Fig. 1 Spatial distribution of flux sites and literature collection data sites[51] Ⅰ东北地区Northeast region; Ⅱ内蒙地区Inner Mongolia region; Ⅲ甘新地区Gan-xin region; Ⅳ黄淮海地区Huang-huang-hai region; Ⅴ黄土高原地区Loess Plateau region; Ⅵ青藏地区Tibetan region; Ⅶ长江中下游地区Mid-downstream of Yangtze region; Ⅷ西南地区Southwest China; Ⅸ华南地区South China; ENF常绿针叶林Evergreen needleleaf forest; EBF常绿阔叶林Evergreen broadleaf forest; DNF落叶针叶林Deciduous needleleaf forest; DBF落叶阔叶林Deciduous broadleaf forest; MF混交林Mixed forest; SHR灌丛Shrubland; GRA草地Grassland; CRO农田Cropland; NV无植被No vegetation |
模型运行所需植被植被指数EVI和NDVI[55-56]源于MODIS陆地产品第5版数据集地表反射率产品MOD09A1(https://modis.gsfc.nasa.gov/, 空间分辨率500 m×500 m, 时间分辨率8 d), 为消除云雨干扰, 利用TIMESAT的非对称高斯函数对EVI及NDVI进行平滑处理[57], 相比于其他函数, 非对称高斯函数平滑后植被指数与原始变化曲线更加吻合[58]。为与气象数据相匹配, 将遥感数据重采样至1 km×1 km。
1.3.3 气象数据空间气象数据(温度、降水等)源于利用ANUSPLIN气象插值软件进行空间化得到的时间分辨率为8 d、空间分辨率为1 km的气象栅格数据集, 基础数据来自2000—2015年国家气象科学数据共享服务平台(http://data.cma.cn/)获取的“中国地面气候资料日值数据集”及全球日气候历史数据网络数据。采用7个亚洲通量观测台站(http://asiaflux.net)的气象要素对空间插值结果进行了验证, 发现插值结果和通量观测数据显著线性相关, 分别可以解释降水、温度的67%、94%[59]。总辐射数据首先利用122个辐射观测站的总辐射和日照时数数据估计Angstrom模型[60]参数, 然后利用756个气象站的日照时数数据和参数化后的Angstrom模型计算756个站的总辐射, 进而利用ANUSPLIN气象插值方法进行插值, 基于站点观测数据对插值结果进行验证, 几乎所有地区相关系数均高于0.8, RMSE低于3 MJ/d[61-63]。净辐射数据首先利用全国53个气象辐射站点逐日地表净辐射数据拟合FAO Penman修正式的经验参数, 并将模型运用到全国站点, 利用各站点的日照时数、平均气温、平均水汽压等实测数据模拟得到各站点净辐射, 地表净辐射观测值与模拟值的相关系数为0.85, 平均相对误差为0.13, 总体精度较高[64]。
2 结果 2.1 模型验证基于站点观测蒸散数据对模型模拟结果进行验证, 采用站点周边3×3范围内所有像元的平均值作为站点模拟结果。发现参数优化后PT-JPL模型可解释所有站点、非森林站点和森林站点蒸散年际变化的68%、59%、65%, RMSE分别为130.82 mm/a(22%)、116.32 mm/a(16%)、147.5 mm/a(30%)(图 2); 采用原始参数的PT-JPL模型模拟结果对年际变化的解释率略低于参数优化后PT-JPL模型, 但RMSE显著高于参数优化后PT-JPL模型, 分别为209.54 mm/a(36%)、211.68 mm/a(30%)、207.06 mm/a(42%)(图 2); MOD16产品在森林站点对年际变化的解释率略低于参数优化后PT-JPL模型(58%), 在非森林站点解释率较差(32%), RMSE分别为206.13 mm/a(28%)、225.39 mm/a(62%)(图 2)。说明参数优化后PT-JPL模型较原始模型模拟效果有了较大提升, 且优于广泛使用的MOD16产品, 可以很好的模拟出中国陆地生态系统蒸散的年际变化及空间分布。

|
| 图 2 基于文献搜集数据验证对参数优化后PT-JPL模拟结果、原始PT-JPL模型及MOD16蒸散产品的验证 Fig. 2 Validation of PT-JPL model with optimized parameters, PT-JPL model with original parameters and MOD16 evapotranspiration product based on literature collection data 图中黑色表示全部站点; 蓝色为森林站点; 红色为非森林站点 |
多年平均蒸散具有明显的空间异质性, 即由东南沿海到西北内陆逐渐递减(图 3), 全国平均蒸散为440.16 mm/a。进一步在九大区分析陆地生态系统蒸散的空间分布格局(图 3), 发现华南地区蒸散最高(833.80 mm/a), 其次为长江中下游地区(699.14 mm/a)和西南地区(586.9 mm/a), 这些地区水热条件良好且植被覆盖度较高; 甘新区(263.81 mm/a)蒸散最低, 该地区降水稀少且植被稀疏。

|
| 图 3 2000—2015年中国陆地生态系统蒸散多年均值及年际变化率的空间分布格局 Fig. 3 Spatial distribution of averaged evapotranspiration and annual evapotranspiration trends of Chinese terrestrial ecosystem from 2000 to 2015 |
2000—2015年中国陆地生态系统蒸散总量多年平均值为4.12 Tt/a, 年均轻微下降6.48 Gt/a(P=0.17), 且具有年代际差异, 即2000—2010年中国地区蒸散呈显著下降趋势(P < 0.01), 而2010—2015年轻微上升(P=0.71)(图 4)。2004及2013年蒸散高值与总辐射(下文中辐射均指代总辐射)高值同时发生(图 4)。2010年蒸散变化趋势转折可能与气候因子相关, 2010年前后降水及温度由上升改为下降趋势, 辐射由下降变为上升趋势(图 4)。

|
| 图 4 2000—2015年中国陆地生态系统蒸散及降水、温度及辐射距平的时间变化趋势 Fig. 4 Interannual changes of Chinese terrestrial ecosystems in evapotranspiration, and anomaly of precipitation, temperature, and radiation |
2000—2010年各生态区蒸散均呈下降趋势(表 2), 其中显著下降(P < 0.1)的内蒙古地区、甘新地区、黄土高原地区及青藏地区蒸散总量占全国的45.05%, 解释了61.88%的年际变化。2010—2015年各生态区均无显著变化(表 2), 其中东北地区及长江中下游地区呈下降趋势, 抵消了全国上升速率的57.59%;其余地区呈轻微上升趋势, 甘新地区占全国上升趋势的70.52%。图 3在像元尺度展示了蒸散年际变化率的空间分布格局, 2000—2010年73.95%的像元呈下降趋势, 其中14.5%的像元显著下降, 主要分布在黄淮海地区、甘新地区、黄土高原地区及青藏地区, 与区域统计结果一致(图 3, 表 2); 2010—2015年上升像元比下降像元多10.83%, 显著变化像元仅为7.01%(图 3)。
| 地区 Regions |
2000—2010 | 2010—2015 | |||||
| 斜率 Slope/(Gt/a) |
R2 | P | 斜率 Slope/(Gt/a) |
R2 | P | ||
| 东北地区Northeast region | -1.99 | 0.15 | 0.245 | -0.68 | 0.02 | 0.765 | |
| 内蒙古地区Inner Mongolia region | -2.09 | 0.51 | 0.014 | 0.79 | 0.21 | 0.362 | |
| 甘新地区Gan-xin region | -3.75 | 0.29 | 0.087 | 7.39 | 0.50 | 0.114 | |
| 黄淮海地区Huang-huai-hai region | -1.49 | 0.13 | 0.280 | 1.87 | 0.12 | 0.500 | |
| 黄土高原区Loess Plateau region | -2.19 | 0.38 | 0.044 | 3.61 | 0.49 | 0.120 | |
| 青藏地区Tibetan region | -4.99 | 0.40 | 0.036 | 1.20 | 0.02 | 0.792 | |
| 长江中下游区Mid-downstream of Yangtze | -1.17 | 0.03 | 0.585 | -5.35 | 0.05 | 0.668 | |
| 西南地区Southwest China | -1.88 | 0.12 | 0.305 | 0.04 | 0.00 | 0.997 | |
| 华南地区South China | -1.49 | 0.10 | 0.338 | 1.60 | 0.06 | 0.632 | |
由2000—2015年蒸散和气候因子之间的相关性分析可知, 在全国尺度, 蒸散与辐射显著正相关(P < 0.05), 与温度及降水相关性很弱(图 5)。在生态区尺度, 辐射主导了几乎所有地区蒸散的年际变异, 但温度、降水与蒸散的相关性存在显著差异:在内蒙古地区及甘新地区等干旱地区降水与蒸散显著正相关(P < 0.05), 在其他地区(除青藏地区)均呈负相关; 在长江中下游地区、西南地区及华南地区温度与蒸散呈正相关, 而内蒙古地区及甘新地区蒸散与温度呈负相关(图 5)。在空间尺度, 超过78%的像元辐射与蒸散显著正相关(P < 0.05), 仅在内蒙古地区、甘新地区部分像元两者相关性较弱(图 6); 约8%的像元降水与蒸散显著正相关(P < 0.05), 主要分布在降水较少的内蒙古地区及甘新地区, 同时超过25%的像元降水与蒸散呈显著负相关(P < 0.05), 在水热条件良好的东部季风区及青藏地区东北部广泛分布(图 6); 约10%的像元温度与蒸散呈负相关(P < 0.05), 主要分布在内蒙古地区及甘新地区, 约16%的像元蒸散与温度显著正相关(P < 0.05), 主要分布在水分充足的长江中下游地区、西南地区及华南地区(图 6)。

|
| 图 5 全国及不同生态区蒸散与降水、温度及辐射的相关关系 Fig. 5 Correlation coefficient between evapotranspiration and precipitation, temperature and radiation for each region 实线和虚线分别表示P=0.05和P=0.01 |

|
| 图 6 2000—2015年中国陆地生态系统蒸散与气象因子(降水、温度、辐射)相关性及不同年代际气象因子变化趋势的空间分布格局 Fig. 6 Spatial distribution of the coefficients between evapotranspiration and climate factors (i.e., precipitation, temperature and radiation) and the annual climate factors trends of Chinese terrestrial ecosystem from 2000 to 2015 |
本文进一步基于多元线性回归方程量化不同气候因子对蒸散年际变化趋势的贡献率。结果表明2000—2010年辐射降低可解释蒸散下降的51.45%;2010年以后辐射增高可解释蒸散上升的85.26%, 说明辐射主导了全国尺度蒸散的年际变化。但不同地区的主要影响因素存在很大差异, 2000—2010年内蒙古地区及黄土高原地区辐射下降(表 3, 图 6)是蒸散下降的主要原因, 贡献率分别为50.20%、72.29%;甘新地区降水减少且温度增加(表 3, 图 6), 共同解释蒸散降低的60.8%;青藏地区东北部蒸散下降(图 3), 该地区降水增多(图 6)导致辐射降低(图 6), 进而影响蒸散变化; 其他各区辐射是蒸散年际变化的主要影响因子, 解释率介于77.62%—90.50%之间。2010—2015年, 各生态区蒸散变化均不显著, 其中内蒙古地区及黄土高原地区辐射由下降转为轻微上升(表 3, 图 6)导致蒸散转为轻微上升趋势(表 2); 甘新地区温度由上升转为下降(表 3, 图 6), 同时降水开始增多(表 3, 图 6), 导致蒸散上升; 青藏地区降水减少导致辐射增多, 进而影响蒸散(表 3, 图 6); 东北地区及长江中下游地区蒸散下降(表 2)主要由辐射下降导致(表 3, 图 6)。
| 地区 Regions |
2000—2010 | 2010—2015 | |||||
| 温度 Temperature |
降水 Precipitation |
辐射 Radiation |
温度 Temperature |
降水 Precipitation |
辐射 Radiation |
||
| 东北地区Northeast region | -0.03 | 9.44 | -82.68 | 0.31 | -10.58 | -86.83 | |
| 内蒙地区Inner Mongolia region | 0.01 | 0.49 | -74.91 | 0.27 | 0.82 | 11.56 | |
| 甘新地区Gan-xin region | 0.03 | -1.36 | 29.40 | -0.23 | 0.54 | 151.90 | |
| 黄淮海地区Huang-huai-hai region | 0.01 | 1.40 | -95.15 | 0.16 | -17.10 | -41.02 | |
| 黄土高原区Loess Plateau region | 0.02 | -3.91 | -96.50* | 0.12 | -7.08 | 70.93 | |
| 青藏地区Tibetan region | 0.11* | 2.87 | 12.30 | -0.13* | -18.66 | 129.08 | |
| 长江中下游区Mid-downstream of Yangtze | 0.03 | -0.12 | 18.79 | 0.08 | 29.43 | -307.21 | |
| 西南地区Southwest China | 0.05 | -8.13 | -11.82 | 0.06 | 28.05 | -19.13 | |
| 华南地区South China | 0.02 | -3.63 | -59.44 | -0.13 | -2.91 | 191.91 | |
| *P < 0.05 | |||||||
本研究基于通量观测及文献搜集的实测蒸散数据对模型模拟结果进行验证, 发现PT-JPL模型可解释蒸散季节变化和年际变化的65%、68%。Chen等利用23个通量观测站实测数据对8个蒸散模型进行了验证, 发现决定系数介于0.5—0.8[36]; 其他相关研究所得蒸散的决定系数介于0.55—0.80之间[2, 7, 30, 65-67], 说明本研究模拟结果已达到当前主流蒸散模型的模拟精度。
本研究模拟多年平均蒸散为440.16 mm/a, 介于相关研究的364—852 mm/a之间(表 4), Chen等基于8个蒸散模型模拟了中国地区蒸散(535—852 mm/a)[36], 显著高于本研究及其他相关研究结果, 可能是由不同模型结构导致[36], 另外, 不同模型中输入数据来源及分辨率不一致也会导致模型模拟结果的差异[69]。本研究模拟蒸散的空间分布格局与相关研究基本一致[1-2, 7, 70], 表现出与中国气候格局相对应的区域异质性和纬度梯度[7, 71]。
近15年中国陆地生态系统蒸散年均轻微下降0.15%, 2001—2013 MODIS蒸散产品年均轻微下降0.11%(基于变化速率及多年均值计算所得)[71], 在相同时段内本研究估算的蒸散年均下降速率为0.12%, 两者基本一致。本研究模拟蒸散具有年代际差异, 即2000—2010年年均显著下降0.51%, 显著下降的内蒙古地区、甘新地区、黄土高原地区及青藏地区蒸散总量占全国的45.05%, 解释了61.88%的年际变化, 而2010—2015年轻微上升0.26%(P=0.71)。基于PT-DTsR模型模拟发现2001—2010中国地区潜热通量呈下降趋势[7], 其中华中地区、西北地区及内蒙古地区显著下降[7]; 基于修正的Penman-Monteith公式模拟2000—2010年青藏地区蒸散亦呈显著下降趋势(P<0.01)[72], 与本研究的显著下降区域基本吻合。
3.2 蒸散影响因素陆地生态系统蒸散年际变化主要受辐射控制[73-75], 同时也受到水分、温度等因素的影响[2, 7, 18, 76]。2000年以来, 在北半球持续变亮背景下, 中国地区开始变暗(即到达地表辐射减少)[77], 2000—2010年辐射减少解释了蒸散下降的51.45%, 2010—2015年辐射上升解释了蒸散上升的85.26%。已有研究表明南亚季风减弱导致2009—2010年中国西南及北部地区发生严重干旱, 降水量较正常年份减少约25%[78-79], 水分供给不足导致2009—2010年蒸散降低(图 4); 2013年蒸散高值主要由辐射增高引起(图 4)。2009—2013年蒸散快速上升可归因于干旱缓解及辐射增加。我国幅员辽阔, 不同地区蒸散年际变化的主要影响因素存在显著差异[7]。黄土高原地区及内蒙古地区蒸散主要受辐射控制, 到达地表的太阳辐射主要受大气气溶胶含量和云量的影响[80], 高浓度PM2.5会抑制蒸散[81]。2000年以来, 我国空气污染问题日趋严重[38-39], 工业活动释放的气溶胶吸收大量太阳辐射和地表反射辐射[66, 77], 使得到达地表的辐射减少, 进而导致蒸散减少; 而2010年后, 黄土高原地区及内蒙古地区辐射轻微上升(表 3), 可能是由于环境改善所至。甘新地区蒸散主要受水分限制[2, 7], 且本地区整体呈暖湿化趋势[82-83], 朝有利于蒸散的方向发展, 但2000—2010年蒸散显著下降, 可能是由于2009—2010年的大面积干旱导致[7, 78-79], 气候变化可解释新疆地区蒸散下降趋势的99%[84]。2000—2010年青藏地区东北部降水增加相关, 并进一步导致辐射降低[77, 80, 85], 从而引起蒸散下降。
4 结论本文基于PT-JPL模型, 利用遥感数据及气象观测数据, 模拟了中国陆地生态系统2000—2015年蒸散, 并进一步分析了蒸散的时空变化及其影响因素。主要结论如下:
(1) 参数优化后PT-JPL模型可解释蒸散年际变化的68%, 优于原始模型及MOD16蒸散产品;
(2) 2000—2015平均蒸散具有明显的空间异质性, 即由东南沿海到西北内陆逐渐递减, 华南地区蒸散最高, 甘新地区蒸散最低;
(3) 2000—2015年蒸散整体呈轻微下降趋势(slope=6.48 Gt/a, P=0.17), 但具有年代际差异, 即2000—2010年中国地区蒸散呈显著下降趋势(slope=21.05, P < 0.01), 占全国蒸散总量45.05%的内蒙古地区、黄土高原地区、甘新地区及青藏地区解释了61.88%的年际变化; 2010—2015年轻微上升(slope=10.48, P=0.71), 各区均无显著变化趋势;
(4) 辐射是2010年前后蒸散不同变化趋势的主要影响因素, 分别解释下降和上升趋势的51.45%、85.26%。蒸散呈显著变化趋势的内蒙古地区、黄土高原地区及青藏地区主要受辐射影响, 甘新地区主要受降水和温度的影响。
| [1] |
Hu Z M, Wu G A, Zhang L X, Li S G, Zhu X J, Zheng H, Zhang L M, Sun X M, Yu G R. Modeling and partitioning of regional evapotranspiration using a satellite-driven water-carbon coupling model. Remote Sensing, 2017, 9(1): 54. |
| [2] |
Li X L, Liang S L, Yuan W P, Yu G R, Cheng X, Chen Y, Zhao T B, Feng J M, Ma Z G, Ma M G, Liu S M, Chen J Q, Shao C L, Li S G, Zhang X D, Zhang Z Q, Sun G, Chen S P, Ohta T, Varlagin A, Miyata A, Takagi K, Saiqusa N, Kato T. Estimation of evapotranspiration over the terrestrial ecosystems in China. Ecohydrology, 2014, 7(1): 139-149. DOI:10.1002/eco.v7.1 |
| [3] |
Dirmeyer P A. Vegetation stress as a feedback mechanism in midlatitude drought. Journal of Climate, 1994, 7(10): 1463-1483. DOI:10.1175/1520-0442(1994)007<1463:VSAAFM>2.0.CO;2 |
| [4] |
Sun G, Caldwell P, Noormets A, McNulty S G, Cohen E, Moore Myers J, Domec J C, Treasure E, Mu Q Z, Xiao J F, John R, Chen J Q. Upscaling key ecosystem functions across the conterminous United States by a water-centric ecosystem model. Journal of Geophysical Research:Biogeosciences, 2011, 116(G3): G00G05. |
| [5] |
Jung M, Reichstein M, Ciais P, Seneviratne S I, Sheffield J, Goulden M L, Bonan G, Cescatti A, Chen J Q, De Jeu R, Dolman A J, Eugster W, Gerten D, Gianelle D, Gobron N, Heinke J, Kimball J, Law B E, Montagnani L, Mu Q Z, Mueller B, Oleson K, Papale D, Richardson A D, Roupsard O, Running S, Tomelleri E, Viovy N, Weber U, Williams C, Wood E, Zaehle S, Zhang K. Recent decline in the global land evapotranspiration trend due to limited moisture supply. Nature, 2010, 467(7318): 951-954. DOI:10.1038/nature09396 |
| [6] |
Mu Q Z, Heinsch F A, Zhao M S, Running S W. Development of a global evapotranspiration algorithm based on MODIS and global meteorology data. Remote sensing of Environment, 2007, 111(4): 519-536. |
| [7] |
Yao Y J, Liang S L, Cheng J, Liu S M, Fisher J B, Zhang X D, Jia K, Zhao X, Qin Q M, Zhao B, Han S J, Zhou G S, Zhou G Y, Li Y L, Zhao S H. MODIS-driven estimation of terrestrial latent heat flux in China based on a modified Priestley-Taylor algorithm. Agricultural and Forest Meteorology, 2013, 171-172: 187-202. DOI:10.1016/j.agrformet.2012.11.016 |
| [8] |
Mu Q Z, Zhao M S, Running S W. Improvements to a MODIS global terrestrial evapotranspiration algorithm. Remote Sensing of Environment, 2011, 115(8): 1781-1800. DOI:10.1016/j.rse.2011.02.019 |
| [9] |
L'vovich M I, White G F. Use and transformation of terrestrial water systems//Turner B L, Clark W C, Kates R W, Richards J F, Mathews J T, Meyer W B, eds. The Earth as Transformed by Human Action. Cambridge: Cambridge University Press, 1990: 235-252.
|
| [10] |
Zeng Z Z, Piao S L, Lin X, Yin G D, Peng S S, Ciais P, Myneni R B. Global evapotranspiration over the past three decades:estimation based on the water balance equation combined with empirical models. Environmental Research Letters, 2012, 7(1): 014026. DOI:10.1088/1748-9326/7/1/014026 |
| [11] |
Zeng Z Z, Wang T, Zhou F, Ciais P, Mao J F, Shi X Y, Piao S L. A worldwide analysis of spatiotemporal changes in water balance-based evapotranspiration from 1982 to 2009. Journal of Geophysical Research:Atmospheres, 2014, 119(3): 1186-1202. DOI:10.1002/2013JD020941 |
| [12] |
Li X Y, He Y, Zeng Z Z, Lian X, Wang X H, Du M Y, Jia G S, Li Y N, Ma Y M, Tang Y H, Wang W Z, Wu Z X, Yan J H, Yao Y T, Ciais P, Zhang X Z, Zhang Y P, Zhang Y, Zhou G S, Piao S L. Spatiotemporal pattern of terrestrial evapotranspiration in China during the past thirty years. Agricultural and Forest Meteorology, 2018, 259: 131-140. DOI:10.1016/j.agrformet.2018.04.020 |
| [13] |
Vinukollu R K, Meynadier R, Sheffield J, Wood E F. Multi-model, multi-sensor estimates of global evapotranspiration:climatology, uncertainties and trends. Hydrological Processes, 2011, 25(26): 3993-4010. DOI:10.1002/hyp.8393 |
| [14] |
Shuttleworth W J, Wallace J S. Evaporation from sparse crops-an energy combination theory. Quarterly Journal of the Royal Meteorological Society, 1985, 111(469): 839-855. DOI:10.1002/qj.49711146910 |
| [15] |
Kustas W, Anderson M. Advances in thermal infrared remote sensing for land surface modeling. Agricultural and Forest Meteorology, 2009, 149(12): 2071-2081. DOI:10.1016/j.agrformet.2009.05.016 |
| [16] |
Wang H S, Jia G S, Fu C B, Feng J M, Zhao T B, Ma Z G. Deriving maximal light use efficiency from coordinated flux measurements and satellite data for regional gross primary production modeling. Remote Sensing of Environment, 2010, 114(10): 2248-2258. DOI:10.1016/j.rse.2010.05.001 |
| [17] |
Wang K C, Dickinson R E. A review of global terrestrial evapotranspiration:Observation, modeling, climatology, and climatic variability. Reviews of Geophysics, 2012, 50(2): GR2005. |
| [18] |
Wang K C, Dickinson R E, Wild M, Liang S L. Evidence for decadal variation in global terrestrial evapotranspiration between 1982 and 2002:1. Model development. Journal of Geophysical Research:Atmospheres, 2010, 115(D20): D20112. DOI:10.1029/2009JD013671 |
| [19] |
Zhang Y Q, Chiew F H S, Zhang L, Leuning R, Cleugh H A. Estimating catchment evaporation and runoff using MODIS leaf area index and the Penman-Monteith equation. Water Resources Research, 2008, 44(10): W10420. |
| [20] |
Wang K C, Wang P C, Li Z Q, Cribb M, Sparrow M. A simple method to estimate actual evapotranspiration from a combination of net radiation, vegetation index, and temperature. Journal of Geophysical Research:Atmospheres, 2007, 112(D15): D15107. DOI:10.1029/2006JD008351 |
| [21] |
Mueller B, Seneviratne S I, Jimenez C, Corti T, Hirschi M, Balsamo G, Ciais P, Dirmeyer P, Fisher J B, Guo Z, Jung M, Maignan F, McCabe M F, Reichle R, Reichstein M, Rodell M, Sheffield J, Teuling A J, Wang K, Wood E F, Zhang Y. Evaluation of global observations-based evapotranspiration datasets and IPCC AR4 simulations. Geophysical Research Letters, 2011, 38(6): L06402. |
| [22] |
Jackson R D, Reginato R J, Idso S B. Wheat canopy temperature:a practical tool for evaluating water requirements. Water Resources Research, 1977, 13(3): 651-656. |
| [23] |
Jin Y F, Randerson J T, Goulden M L. Continental-scale net radiation and evapotranspiration estimated using MODIS satellite observations. Remote Sensing of Environment, 2011, 115(9): 2302-2319. DOI:10.1016/j.rse.2011.04.031 |
| [24] |
Yao Y J, Liang S L, Qin Q M, Wang K C, Zhao S H. Monitoring global land surface drought based on a hybrid evapotranspiration model. International Journal of Applied Earth Observation and Geoinformation, 2011, 13(3): 447-457. DOI:10.1016/j.jag.2010.09.009 |
| [25] |
Monteith J L. Evaporation and environment. Symposia of the Society for Experimental Biology, 1965, 19: 205-234. |
| [26] |
Cleugh H A, Leuning R, Mu Q Z, Running S W. Regional evaporation estimates from flux tower and MODIS satellite data. Remote Sensing of Environment, 2007, 106(3): 285-304. |
| [27] |
Priestley C H B, Taylor R J. On the assessment of surface heat flux and evaporation using large-scale parameters. Monthly Weather Review, 1972, 100(2): 81-92. DOI:10.1175/1520-0493(1972)100<0081:OTAOSH>2.3.CO;2 |
| [28] |
Fisher J B, Tu K P, Baldocchi D D. Global estimates of the land-atmosphere water flux based on monthly AVHRR and ISLSCP-Ⅱ data, validated at 16 FLUXNET sites. Remote Sensing of Environment, 2008, 112(3): 901-919. DOI:10.1016/j.rse.2007.06.025 |
| [29] |
López-Urrea R, De Santa Olalla F M, Fabeiro C, Moratalla A. Testing evapotranspiration equations using lysimeter observations in a semiarid climate. Agricultural Water Management, 2006, 85(1/2): 15-26. |
| [30] |
Zhang K, Ma J Z, Zhu G F, Ma T, Han T, Feng L L. Parameter sensitivity analysis and optimization for a satellite-based evapotranspiration model across multiple sites using Moderate Resolution Imaging Spectroradiometer and flux data. Journal of Geophysical Research:Atmospheres, 2017, 122(1): 230-245. DOI:10.1002/2016JD025768 |
| [31] |
García M, Sandholt I, Ceccato P, Ridler M, Mougin E, Kergoat L, Morillas L, Timouk F, Fensholt R, Domingo F. Actual evapotranspiration in drylands derived from in-situ and satellite data:Assessing biophysical constraints. Remote Sensing of Environment, 2013, 131: 103-118. DOI:10.1016/j.rse.2012.12.016 |
| [32] |
魏焕奇, 何洪林, 刘敏, 张黎, 于贵瑞, 闵程程, 王辉民, 刘影. 基于遥感的千烟洲人工林蒸散及其组分模拟研究. 自然资源学报, 2012, 27(5): 778-789. |
| [33] |
Zhu G F, Li X, Zhang K, Ding Z Y, Han T, Ma J Z, Huang C L, He J H, Ma T. Multi-model ensemble prediction of terrestrial evapotranspiration across north China using Bayesian model averaging. Hydrological Processes, 2016, 30(16): 2861-2879. DOI:10.1002/hyp.v30.16 |
| [34] |
Miralles D G, Jiménez C, Jung M, Michel D, Ershadi A, McCabe M F, Hirschi M, Martens B, Dolman A J, Fisher J B, Mu Q, Seneviratne S I, Wood E F, Fernández-Prieto D. The WACMOS-ET project-Part 2:Evaluation of global terrestrial evaporation data sets. Hydrology and Earth System Sciences, 2016, 20(2): 823-842. DOI:10.5194/hess-20-823-2016 |
| [35] |
Michel D, Jiménez C, Miralles D G, Jung M, Hirschi M, Ershadi A, Martens B, McCabe M F, Fisher J B, Mu Q, Seneviratne S I, Wood E F, Fernández-Prieto D. The WACMOS-ET project-Part 1:Tower-scale evaluation of four remote-sensing-based evapotranspiration algorithms. Hydrology and Earth System Sciences, 2016, 20(2): 803-822. DOI:10.5194/hess-20-803-2016 |
| [36] |
Chen Y, Xia J Z, Liang S L, Feng J M, Fisher J B, Li X, Li X L, Liu S G, Ma Z G, Miyata A, Mu Q Z, Sun L, Tang J W, Wang K C, Wen J, Xue Y J, Yu G R, Zha T G, Zhang L, Zhang Q, Zhao T B, Zhao L, Yuan W P. Comparison of satellite-based evapotranspiration models over terrestrial ecosystems in China. Remote sensing of Environment, 2014, 140: 279-293. DOI:10.1016/j.rse.2013.08.045 |
| [37] |
Shi X Y, Mao J F, Thornton P E, Huang M Y. Spatiotemporal patterns of evapotranspiration in response to multiple environmental factors simulated by the Community Land Model. Environmental Research Letters, 2013, 8(2): 024012. DOI:10.1088/1748-9326/8/2/024012 |
| [38] |
Zhou L M, Dickinson R E, Tian Y H, Fang J Y, Li Q X, Kaufmann R K, Tucker C J, Myneni R B. Evidence for a significant urbanization effect on climate in China. Proceedings of the National Academy of Sciences of the United States of America, 2004, 101(26): 9540-9544. DOI:10.1073/pnas.0400357101 |
| [39] |
郑小波, 周成霞, 罗宇翔, 陈娟, Zhao T L. 中国各省区近10年遥感气溶胶光学厚度和变化. 生态环境学报, 2011, 20(4): 595-599. DOI:10.3969/j.issn.1674-5906.2011.04.001 |
| [40] |
Kwon M, Jhun J G, Ha K J. Decadal change in east Asian summer monsoon circulation in the mid-1990s. Geophysical Research Letters, 2007, 34(21): L21706. DOI:10.1029/2007GL031977 |
| [41] |
李悦悦, 黄玫, 季劲钧, 巩贺. 中国季风区植被净初级生产力对东亚夏季风的响应机理研究. 气候与环境研究, 2015, 20(5): 544-554. |
| [42] |
Yao Y J, Qin Q M, Ghulam A, Liu S M, Zhao S H, Xu Z W, Dong H. Simple method to determine the Priestley-Taylor parameter for evapotranspiration estimation using Albedo-Ⅵ triangular space from MODIS data. Journal of Applied Remote Sensing, 2011, 5(1): 053505. DOI:10.1117/1.3557817 |
| [43] |
Gao X, Huete A R, Ni W G, Miura T. Optical-biophysical relationships of vegetation spectra without background contamination. Remote Sensing of Environment, 2000, 74(3): 609-620. |
| [44] |
Xiao X M, Hollinger D, Aber J, Goltz M, Davidson E A, Zhang Q Y, Moore B. Satellite-based modeling of gross primary production in an evergreen needleleaf forest. Remote Sensing of Environment, 2004, 89(4): 519-534. DOI:10.1016/j.rse.2003.11.008 |
| [45] |
Xiao X M, Zhang Q Y, Braswell B, Urbanski S, Boles S, Wofsy S, Moore Ⅲ B, Ojima D. Modeling gross primary production of temperate deciduous broadleaf forest using satellite images and climate data. Remote Sensing of Environment, 2004, 91(2): 256-270. |
| [46] |
路倩倩, 何洪林, 朱先进, 于贵瑞, 王辉民, 张军辉, 闫俊华. 中国东部典型森林生态系统蒸散及其组分变异规律研究. 自然资源学报, 2015, 30(9): 1436-1448. |
| [47] |
Zhang L X, Hu Z M, Fan J W, Zhou D C, Tang F P. A meta-analysis of the canopy light extinction coefficient in terrestrial ecosystems. Frontiers of Earth Science, 2014, 8(4): 599-609. |
| [48] |
Toms J D, Lesperance M L. Piecewise regression:a tool for identifying ecological thresholds. Ecology, 2003, 84(8): 2034-2041. DOI:10.1890/02-0472 |
| [49] |
Liang W, Yang Y T, Fan D M, Guan H D, Zhang T, Long D, Zhou Y, Bai D. Analysis of spatial and temporal patterns of net primary production and their climate controls in China from 1982 to 2010. Agricultural and Forest Meteorology, 2015, 204: 22-36. DOI:10.1016/j.agrformet.2015.01.015 |
| [50] |
Zhang L, Ren X L, Wang J B, He H L, Wang S Q, Wang M M, Piao S L, Yan H, Ju W M, Gu F X, Zhou L, Niu Z E, Ge R, Li Y Y, Lv Y, Yan H M, Huang M, Yu G R. Interannual variability of terrestrial net ecosystem productivity over China: regional contributions and climate attribution. Environmental Research Letters, 2018.
|
| [51] |
中国科学院南京地理与湖泊研究所, 中国科学院地理研究所, 国家地图集编纂委员会. 中华人民共和国国家农业地图集. 北京: 中国地图出版社, 1989: 18-21.
|
| [52] |
Zheng H, Yu G R, Wang Q F, Zhu X J, He H L, Wang Y F, Zhang J H, Li Y N, Zhao L, Zhao F H, Shi P L, Wang H M, Yan J H, Zhang Y P. Spatial variation in annual actual evapotranspiration of terrestrial ecosystems in China:Results from eddy covariance measurements. Journal of Geographical Sciences, 2016, 26(10): 1391-1411. DOI:10.1007/s11442-016-1334-8 |
| [53] |
李春, 何洪林, 刘敏, 苏文, 伏玉玲, 张雷明, 温学发, 于贵瑞. ChinaFLUX CO2通量数据处理系统与应用. 地球信息科学, 2008, 10(5): 557-565. DOI:10.3969/j.issn.1560-8999.2008.05.002 |
| [54] |
刘敏, 何洪林, 于贵瑞, 骆亦其, 孙晓敏, 王辉民. 中亚热带人工针叶林CO2通量组分统计不确定性分析. 中国科学D辑:地球科学, 2008, 38(8): 1016-1027. |
| [55] |
Tucker C J. Red and photographic infrared linear combinations for monitoring vegetation. Remote sensing of Environment, 1979, 8(2): 127-150. |
| [56] |
Huete A, Didan K, Miura T, Rodriguez E P, Gao X, Ferreira L G. Overview of the radiometric and biophysical performance of the MODIS vegetation indices. Remote Sensing of Environment, 2002, 83(1/2): 195-213. |
| [57] |
Jönsson P, Eklundh L. TIMESAT-a program for analyzing time-series of satellite sensor data. Computers & Geosciences, 2004, 30(8): 833-845. |
| [58] |
宋春桥, 柯灵红, 游松财, 刘高焕, 钟新科. 基于TIMESAT的3种时序NDVI拟合方法比较研究——以藏北草地为例. 遥感技术与应用, 2011, 26(2): 147-155. |
| [59] |
Wang J B, Wang J W, Ye H, Liu Y, He H L. An interpolated temperature and precipitation dataset at 1-km grid resolution in China (2000-2012). China Scientific Data, 2017, 2(1): 73-80. |
| [60] |
Angstrom A. Solar and terrestrial radiation. Report to the international commission for solar research on actinometric investigations of solar and atmospheric radiation. Quarterly Journal of the Royal Meteorological Society, 1924, 50(210): 121-126. |
| [61] |
Ren X L, He H L, Zhang L, Zhou L, Yu G R, Fan J W. Spatiotemporal variability analysis of diffuse radiation in China during 1981-2010. Annales Geophysicae, 2013, 31(2): 277-289. DOI:10.5194/angeo-31-277-2013 |
| [62] |
任小丽, 何洪林, 张黎, 于贵瑞. 1981-2010年中国散射光合有效辐射的估算及时空特征分析. 地理学报, 2014, 69(3): 323-333. |
| [63] |
Ren X L, He H L, Zhang L, Yu G R. Global radiation, photosynthetically active radiation, and the diffuse component dataset of China, 1981-2010. Earth System Science Data, 2018, 10(3): 1217-1226. DOI:10.5194/essd-10-1217-2018 |
| [64] |
高扬子, 何洪林, 张黎, 路倩倩, 于贵瑞, 张祖陆. 近50年中国地表净辐射的时空变化特征分析. 地球信息科学学报, 2013, 15(1): 1-10. |
| [65] |
Yuan W P, Liu S G, Zhou G S, Zhou G Y, Tieszen L L, Baldocchi D, Bernhofer C, Gholz H, Goldstein A H, Goulden M L, Hollinger D Y, Hu Y M, Law B E, Stoy P C, Vesala T, Wofsy S C. Deriving a light use efficiency model from eddy covariance flux data for predicting daily gross primary production across biomes. Agricultural and Forest Meteorology, 2007, 143(3/4): 189-207. |
| [66] |
Ryu Y, Baldocchi D D, Kobayashi H, Van Ingen C, Li J, Black T A, Beringer J, Van Gorsel E, Knohl A, Law B E, Roupsard O. Integration of MODIS land and atmosphere products with a coupled-process model to estimate gross primary productivity and evapotranspiration from 1 km to global scales. Global Biogeochemical Cycles, 2011, 25(4): GB4017. |
| [67] |
Zhang L L, Yao Y J, Wang Z Q, Jia K, Zhang X T, Zhang Y H, Wang X Y, Xu J, Chen X W. Satellite-derived spatiotemporal variations in evapotranspiration over northeast China during 1982-2010. Remote Sensing, 2017, 9(11): 1140. DOI:10.3390/rs9111140 |
| [68] |
Li G, Zhang F M, Jing Y S, Liu Y B, Sun G. Response of evapotranspiration to changes in land use and land cover and climate in China during 2001-2013. Science of the Total Environment, 2017, 596-597: 256-265. DOI:10.1016/j.scitotenv.2017.04.080 |
| [69] |
Cai W W, Yuan W P, Liang S L, Zhang X T, Dong W J, Xia J Z, Fu Y, Chen Y, Liu D, Zhang Q. Improved estimations of gross primary production using satellite-derived photosynthetically active radiation. Journal of Geophysical Research:Biogeosciences, 2014, 119(1): 110-123. DOI:10.1002/2013JG002456 |
| [70] |
周蕾, 王绍强, 陈镜明, 冯险峰, 居为民, 伍卫星. 1991年至2000年中国陆地生态系统蒸散时空分布特征. 资源科学, 2009, 31(6): 962-972. DOI:10.3321/j.issn:1007-7588.2009.06.010 |
| [71] |
Zhang K, Kimball J S, Nemani R R, Running S W. A continuous satellite-derived global record of land surface evapotranspiration from 1983 to 2006. Water Resources Research, 2010, 46(9): W09522. |
| [72] |
Song L L, Zhuang Q L, Yin Y H, Zhu X D, Wu S H. Spatio-temporal dynamics of evapotranspiration on the Tibetan Plateau from 2000 to 2010. Environmental Research Letters, 2017, 12(1): 014011. DOI:10.1088/1748-9326/aa527d |
| [73] |
Hutyra L R, Munger J W, Saleska S R, Gottlieb E, Daube B C, Dunn A L, Amaral D F, De Camargo P B, Wofsy S C. Seasonal controls on the exchange of carbon and water in an Amazonian rain forest. Journal of Geophysical Research:Biogeosciences, 2007, 112(G3): G03008. |
| [74] |
Fisher J B, Malhi Y, Bonal D, Da Rocha H R, De Araújo A C, Gamo M, Goulden M L, Hirano T, Huete A R, Kondo H, Kumagai T, Loescher H W, Miller S, Nobre A D, Nouvellon Y, Oberbauer S F, Panuthai S, Roupsard O, Saleska S, Tanaka K, Tanaka N, Tu K P, Von Randow C. The land-atmosphere water flux in the tropics. Global Change Biology, 2009, 15(11): 2694-2714. DOI:10.1111/(ISSN)1365-2486 |
| [75] |
Costa M H, Biajoli M C, Sanches L, Malhado A C M, Hutyra L R, Da Rocha H R, Aguiar R G, de Araújo A C. Atmospheric versus vegetation controls of Amazonian tropical rain forest evapotranspiration:are the wet and seasonally dry rain forests any different?. Journal of Geophysical Research:Biogeosciences, 2010, 115(G4): G04021. |
| [76] |
Sheffield J, Wood E F, Roderick M L. Little change in global drought over the past 60 years. Nature, 2012, 491(7424): 435-438. DOI:10.1038/nature11575 |
| [77] |
Wild M, Trüssel B, Ohmura A, Long C N, König-Langlo G, Dutton E G, Tsvetkov A. Global dimming and brightening:An update beyond 2000. Journal of Geophysical Research:Atmospheres, 2009, 114(D10): D00D13. |
| [78] |
Barriopedro D, Gouveia C M, Trigo R M, Wang L. The 2009/10 Drought in China:possible causes and impacts on vegetation. Journal of Hydrometeorology, 2011, 13(4): 1251-1267. |
| [79] |
Lu E, Luo Y L, Zhang R H, Wu Q X, Liu L P. Regional atmospheric anomalies responsible for the 2009-2010 severe drought in China. Journal of Geophysical Research:Atmospheres, 2011, 116(D21): D21114. |
| [80] |
Wild M. Global dimming and brightening:A review. Journal of Geophysical Research:Atmospheres, 2009, 114(D10): D00D16. |
| [81] |
Yao L. Causative impact of air pollution on evapotranspiration in the North China Plain. Environmental Research, 2017, 158: 436-442. DOI:10.1016/j.envres.2017.07.007 |
| [82] |
毕超, 单楠, 毕华兴. 西北极端干旱区近54年降水量和温度变化趋势. 中国水土保持科学, 2015, 13(3): 90-96. DOI:10.3969/j.issn.1672-3007.2015.03.014 |
| [83] |
王玮, 冯琦胜, 郭铌, 沙莎, 胡蝶, 王丽娟, 李耀辉. 基于长时间序列NDVI资料的我国西北干旱区植被覆盖动态监测. 草业科学, 2015, 32(12): 1969-1979. DOI:10.11829/j.issn.1001-0629.2015-0459 |
| [84] |
Yuan X L, Bai J, Li L H, Kurban A, De Maeyer P. The dominant role of climate change in determining changes in evapotranspiration in Xinjiang, China from 2001 to 2012. PLoS One, 2017, 12(8): e0183071. DOI:10.1371/journal.pone.0183071 |
| [85] |
Piao S L, Fang J Y, Zhou L M, Ciais P, Zhu B. Variations in satellite-derived phenology in China's temperate vegetation. Global Change Biology, 2006, 12(4): 672-685. DOI:10.1111/gcb.2006.12.issue-4 |