 2015, Vol. 35
文章信息
- 邓培雁, 张婉, 王旭涛, 曾宝强, 刘翔, 刘威
- DENG Peiyan, ZHANG Wan, WANG Xutao, Po Keung Eric Tsang, LIU Xiang, LIU Wei
- 水质对东江流域附生硅藻群落的影响
- The effects of water quality on epilithic diatoms communities of Dongjiang river basin
- 生态学报, 2015, 35(6): 1852-1861
- Acta Ecologica Sinica, 2015, 35(6): 1852-1861
- http://dx.doi.org/10.5846/stxb201305201124
-
文章历史
- 收稿日期:2013-05-20
- 修订日期:2014-04-25


2. 珠江流域水环境监测中心, 广州 510611;
3. 香港教育学院科学与环境研究系, 香港 999077;
4. 四川师范大学生命科学学院, 成都 610068
2. Water Environment Monitoring Center of Pearl River Basin, Guangzhou 510611, China;
3. Department of Science and Environmental Studies, The Hong Kong Institute of Education, Hongkong 999077, China;
4. School of Life Science, Sichuan Normal University, Chengdu 610068, China
附生硅藻是河流生态系统食物链的重要组成部分,其结构和功能的稳定,对于河流健康具有重要支撑作用[1, 2]。因此,阐明影响河流附生硅藻的重要环境因素具有重要的理论和现实意义[3]。
人类干扰、水质、海拔、地质、土壤等均被认为是导致硅藻群落时空变异的环境因素[4, 5, 6],而水质多被认为是起决定作用的因素,这是因为不论地理因子或者人类干扰均以水质为介质对河流附生硅藻群落起作用[6]。不同的研究区域,影响硅藻群落的水质因子也会产生变化。Winter等发现在一定浓度范围内,硅藻种群数量与TN、TP呈正相关[7]。Potapova等认为电导率、Ca2+和(HCO-3+CO-3)对硅藻群落结构影响深刻[8]。Van dam指出pH决定了硅藻群落的分布[9]。加权平均回归分析 (WA)是研究水质对硅藻群落影响的最常用手段,该方法可以计算出硅藻对水质因子的最适值和耐受值,并且建立起硅藻与主要水质因子的参考模型[10]。水质因素众多,澄清影响河流硅藻群落的主要水质因素,才能更好的利用硅藻进行河流健康管理。
东江是珠江流域三大水系之一,为深圳、香港提供生活、生产用水,对于该区域社会和经济稳定起着举足轻重的作用。然而,经济发展的同时也对东江的环境质量和生态平衡造成了重大威胁。
本文以东江流域为研究区域,利用相关性分析,典型对应分析,加权平均回归分析,研究了13项水质因子对河流附生硅藻群落的影响,目的是阐明影响东江河流附生硅藻群落的主要水质因子和相应的最适生态范围,以期为东江河流健康管理提供科学依据。
1 材料和方法 1.1 研究区域概况及采样点东江发源于江西省寻乌县,在广东省龙川县合河坝与安远水汇合后称东江,经龙川、河源、紫金、惠阳、博罗、东莞等县市注入狮子洋。干流全长562 km,流域面积达35340km2。全流域共设置24个采样点,覆盖所有一级支流,2012年3月进行采样,分布如图 1。为保障结果的可比性,采样分多组,于3日内全部完成。

|
| 图 1 采样点分布图 Fig. 1 Location of the sampling sites |
采样方法根据欧盟标准方法EN 13946[11]和EN 14407[12]:附生硅藻采样基质选取能抵抗水流、地势开阔处无树荫遮挡的石头,每个采样点至少采集5块石头,干净牙刷刷洗石头向阳面,取混合样甲醛(3%—4%)固定。
样品经35%过氧化氢和98%浓盐酸消解,Naphrax (RI=1.74)封片胶封片,光学显微镜(LM)1000倍油镜镜头下检出,视野内所有完整及破损面积不超过1/4的硅藻细胞都要鉴定和计数,每个样片计数需超过400个细胞,根据Krammer and Lange-Bertalot 鉴定体系(1986—1991)[13]鉴定到种。
1.3 水质因子的测定与分析现场测定pH值、电导率(Cond.)、溶解氧(DO)3项因子。实验室测得五日生化需要量(BOD5),高锰酸盐指数(CODKMnO4)、总氮(TN)、氨氮(NH4-N)、硝氮(NO3-N)、亚硝氮(NO2-N)、总磷(TP)、磷酸盐(PO4-P)、硅酸盐(SiO2)和氯化物(Cl)等13项水质因子。测定方法参照《水与废水监测分析方法(第4版)》[14]。
1.4 数据分析相关性分析(CA)和典型对应分析(CCA)可将多个环境因子筛选到几个有显著解释性的主要环境因子。CCA是一种多变量直接梯度分析方法[15],每次计算将硅藻数据与环境因子进行回归,其结果可同时显示采样点、硅藻种类和环境因子三者间的关系。
硅藻的最适值加权平均回归分析(WA)得到。其分析方法是假定硅藻在某一环境因子上呈高斯分布,其最大含量所对应的环境指标值即是该种的最适生态值[16],计算公式见式(1):
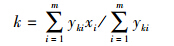
式中,xi是采样点i中的环境变量值;yki是属种k在采样点i中的百分含量;n是数据资料中的总采样点数。
为了研究水质与河流附生硅藻群落分布,进行以下分析:
(1)对13项水质因子使用相关性分析,删除显著相关的环境因子。将剩下的环境因子进行CCA分析;
(2)使用典范对应分析(CCA)筛选出影响附生硅藻群落分布的主要环境因子;
(3)使用加权平均回归分析(WA),计算附生硅藻对主要环境因子的最适值。
为减少分析误差,选择那些至少在两个或两个以上样品中出现,相对丰度超过1%以上的种。使用CANOCO for Windows 4.5 进行典范对应分析(CCA),使用SPSS18.0进行相关性分析,使用C2统计软件进行加权平均回归分析(WA)[17]。所有环境变量数据(除pH外)对其进行log(x+1)转换。为稳定物种变量,物种相对丰度进行平方根转换,以减少优势种的影响。通过1000次循环的bootstrapping进行函数误差估计[18]。
2 结果 2.1 附生硅藻种类组成2 4个采样点共鉴定出附生硅藻27属83种(含变种),相对丰度大于1%有62种。常见属为异极藻属(Gomphonema)、菱形藻属(Nitzschia)、曲壳藻属(Achnanthes、Achnanthidium)、舟形藻属(Navicula)。种类数最多的属是菱形藻属,种类数共有14种。异极藻是优势种,占附生硅藻种类总数的25.9%。
2.2 13项水质因子间的相关性分析表 1显示,13项指标中DO、NH4-N、NO2-N、Cl、BOD5、PO4-P 与其它指标间的相关性较强,pH、SiO2与其它水质参数指标相关性较低。NO3-N与pH、TN存在显著相关,TN、TP均与CODKMnO4存在显著相关,TP还与PO4-P、NO2-N显著相关,CODKMnO4与DO、pH、SiO2、Cl、NO3-N不具有显著相关性 (P<0.05)。
|
参数 Parameters | 溶解氧 DO | 五日生化量 BOD5 | 高锰酸盐指数 CODKMnO4 | 电导率 Cond. | 氨氮 NH4-N | pH值 | 亚硝氮 NO2-N | 硅酸盐 SiO2 | 氯化物 Cl | 硝氮 NO3-N | 磷酸盐 PO4-P | 总氮TN | 总磷 TP |
| 溶解氧DO Dissolved Oxygen | 1 | ||||||||||||
|
五日生化量BOD5 Biochemistry Oxygen Demand | -0.86** | 1 | |||||||||||
|
高锰酸盐指数CODKMnO4 Chemistry Oxygen Demand | -0.41 | 0.54** | 1 | ||||||||||
| 电导率Cond. Conductivity | -0.72** | 0.69** | 0.47* | 1 | |||||||||
| 氨氮NH4-N | -0.89** | 0.80** | 0.43* | 0.83** | 1 | ||||||||
| pH值 | 0.14 | -0.14 | -0.32 | 0.08 | 0.10 | 1 | |||||||
| 亚硝氮NO2-N | -0.86** | 0.76** | 0.43* | 0.79** | 0.98** | 0.05 | 1 | ||||||
| 硅酸盐SiO2 | 0.12 | -0.14 | 0.10 | -0.02 | -0.06 | 0.14 | 0.04 | 1 | |||||
| 氯化物Cl | -0.77** | 0.69** | 0.37 | 0.88** | 0.80** | 0.06 | 0.73** | -0.36 | 1 | ||||
| 硝氮NO3-N | 0.23 | -0.14 | -0.01 | -0.11 | -0.17 | -0.43* | -0.12 | -0.17 | -0.16 | 1 | |||
| 磷酸盐PO4-P | -0.55** | 0.58** | 0.49* | 0.52* | 0.61** | -0.28 | 0.69** | 0.12 | 0.43* | 0.14 | 1 | ||
| 总氮TN Total Nitrogen | -0.29 | 0.39 | 0.61** | 0.33 | 0.29 | -0.43* | 0.29 | 0.01 | 0.19 | 0.65** | 0.38 | 1 | |
| 总磷TP Total phosphorus | -0.29 | 0.32 | 0.53* | 0.19 | 0.33 | -0.39 | 0.48* | 0.37 | -0.01 | 0.25 | 0.80** | 0.42 | 1 |
| **表示P< 0.01 *表示P<0.05 | |||||||||||||
对应分析(DCA)发现,第一轴和第二轴的梯度均大于2,表明东江流域附生硅藻对水质的响应是非线性的,利用单峰模型的CCA分析硅藻群落和水质因子的关系是适合的[10]。
为确保水质参数的独立代表性,剔除6个显著相关的水质因子(DO、NH4-N、NO2-N、Cl、BOD5、PO4-P),以其余的7个水质因子进行CCA分析。CCA显示前两轴的特征值分别是0.331和0.204,前两个轴的物种与环境因子的相关系数是0.932和0.847,前两轴共解释了附生硅藻群落数据累积方差值的47.3%(表 2)。且第一轴与第二轴的相关性较小,仅为0.0375,说明其排序图能很好地反映物种与环境因子之间的相关关系。
| 轴Axes | 1 | 2 |
| 特征值Eigenvalues | 0.331 | 0.204 |
| 种类-环境相关性 Species-environment correlations | 0.932 | 0.847 |
| 物种数据累积变化百分率 Cumulative percentage variance of species data | 10.3 | 16.7 |
| 物种数据累积变化百分率 Cumulative percentage variance species-environment relation | 29.3 | 47.3 |
图 2反映的是附生硅藻群落与7个环境因子的排序图,从图上箭头与第一排序轴的夹角可以看出,环境因子与第一轴的相关性大小为:Cond.>TP>CODKMnO4>TN>pH,这些环境因子与第一轴呈正相关;与第二轴相关性为SiO2> NO3-N>pH>TN>TP。由表 3显示的7个环境因子与第一轴的相关性系数大小比较,它们之间的相关性大小为:Cond.>CODKMnO4> TP> TN >pH。因此,结合表 3,从第一、第二排序轴的相关性分析可以得出,水质因子对附生硅藻群落分布的影响程度为Cond. > NO3-N> CODKMnO4 >TP>TN。

|
| 图 2 东江流域附生硅藻群落分布与环境因子的CCA分析图 Fig. 2 Canonical correspondence analysis (CCA) of environmental factors and epilithic diatom species of Dongjiang river basin in the first two axes AAMB: Aulacoseira ambigua; ACON: Achnanthes conspicua; ACTT: A. catenata; AEXI: A. exilis; ALAR: A. lanceolata ssp. Rostrata; ALIN: A. linearis; AMSA: A. minutissima var.saprophila; ATRO: A. tropica; ADMI: A. minutissimum; AUDI: Au. distans; ALIR: A. lirata; AMMO: Amphora montana; CAFF: Cymbella affinis; CINV: Cyclostephanos invisitatus; CMEN: C. meneghiniana; CPLE: Cocconeis placentula var. euglypta; DCOF: Diadesmis confervacea; EBIL: Eunotia bilunaris; EMIN: E. minor; ENMI: Encyonema minutum; EOMI: Eolimna minima; ESBM: E. subminuscula; FBID: Fragilaria bidens; FBRE: F. brevistriata; FULN: F. ulna; GCLE: Gomphonema clevei; GMIN: G. minutum; GOLI: G. olivaceum; GPAR: G. parvulum; LGOE: Luticola goeppertiana; LMUT: L.mutica; LSAX: L. saxophila; LVEN: L. ventricosa; MAPE: Mayamaea atomus var. permitis; MVAR: Melosira varians; NCAP: Navicula capitata; NCPR: Na. capitatoradiata; NCRY: Na. cryptotenella; NDEC: Na. decussis; NEID: Na. eidrigiana; NREI: Na. reichardtiana; NSSY: Na. schroeteri var. symmetrica; NTRV: Na. trivialis; NVEN: Na. veneta; NVRO: Na. viridula var. rostellata; NACI: Nitzschia acicularis; NAMP: Ni. amphibia; NCLA: Ni. clausii; NCPL: Ni.capitellata; NDIS: Ni. dissipata; NILA: Ni. lacuum; NINC: Ni. inconspicua; NINT: Ni. intermedia; NLEV: Ni. levidensis; NPAL: Ni. palea; NPML: Ni. pumila; NSIT: Ni. sinuata var. tabellaria; NSUA: Ni.subacicularis; PLFR: Planothidium frequentissimum; PSCA: Pinnularia subcapitata; SBRE: Surirella brebissonii; SPUP: Sellaphora pupula |
| 参数Parameters | 轴Axis | |
| 1 | 2 | |
| 化学需氧量CODKMnO4 | 0.5030* | -0.2443 |
| 电导率Cond. | 0.8455* | -0.0788 |
| pH | 0.1524 | -0.2272 |
| 硅酸盐SiO2 | -0.0084 | -0.1724 |
| 硝氮NO3-N | -0.1362 | 0.5382* |
| 总氮TN | 0.3224 | 0.3574 |
| 总磷TP | 0.3613 | 0.2172 |
| * 表示P< 0.05水平上显著相关 | ||
通过加权平均回归分析方法(WA)得到了附生硅藻在水体中对Cond.、TP、TN、NO3-N、CODKMnO4的最适值(表 4)。结果显示,电导率的最适范围为39.20—642.00μs/cm。Aulacoseira distans,Nitzschia intermedia的电导率最适值最高,一部分附生硅藻(Achnanthes minutissima var.saprophila,Navicula capitatoradiata,Na. reichardtiana,Ni. sinuata var.tabellaria)能在低电导率值的水体环境中生存。
|
物种名称 Species Name | 电导率 Cond./(μs/cm) | 总磷 TP/(mg/L) | 总氮 TN/(mg/L) | 硝氮 NO3-N/(mg/L) | 化学需氧 CODKMnO4/(mg/L) |
| Aulacoseira ambigua | 200.72 | 0.17 | 2.34 | 1.16 | 2.88 |
| Achnanthes conspicua | 119.09 | 0.06 | 1.74 | 1.13 | 1.93 |
| A. catenata | 116.75 | 0.09 | 1.87 | 1.24 | 1.74 |
| A. minutissimum | 119.58 | 0.12 | 2.01 | 1.23 | 1.78 |
| A. exilis | 232.16 | 0.05 | 1.52 | 0.92 | 2.18 |
| A. lanceolata ssp. rostrata | 116.70 | 0.10 | 1.14 | 0.72 | 1.83 |
| A. linearis | 95.28 | 0.14 | 1.29 | 0.76 | 1.76 |
| Au. lirata | 195.07 | 0.22 | 2.44 | 0.96 | 3.20 |
| Amphora montana | 132.19 | 0.14 | 2.00 | 1.22 | 2.13 |
| A. minutissima var. saprophila | 80.33 | 0.09 | 2.16 | 1.79 | 1.10 |
| A. tropica | 107.00 | 0.02 | 1.42 | 0.99 | 1.90 |
| Au. distans | 642.00 | 0.04 | 1.76 | 0.50 | 2.40 |
| Cymbella affinis | 96.76 | 0.08 | 0.88 | 0.65 | 1.21 |
| Cyclostephanos invisitatus | 464.14 | 0.31 | 2.56 | 0.77 | 3.85 |
| C. meneghiniana | 279.91 | 0.18 | 2.37 | 0.93 | 3.02 |
| Cocconeis placentula var. euglypta | 121.19 | 0.09 | 1.15 | 0.73 | 1.64 |
| Diadesmis confervacea | 178.11 | 0.16 | 2.25 | 1.10 | 2.82 |
| Eunotia bilunaris | 114.00 | 0.12 | 3.14 | 2.77 | 1.20 |
| E. minor | 170.86 | 0.39 | 2.12 | 1.73 | 2.44 |
| Encyonema minutum | 108.82 | 0.11 | 1.54 | 1.17 | 1.55 |
| Eolimna minima | 172.86 | 0.18 | 1.92 | 1.22 | 2.58 |
| E. subminuscula | 153.18 | 0.13 | 1.61 | 0.83 | 2.37 |
| Fragilaria bidens | 119.59 | 0.09 | 2.11 | 1.64 | 1.48 |
| F. brevistriata | 242.00 | 0.09 | 1.39 | 0.80 | 1.50 |
| F. ulna | 127.30 | 0.08 | 1.17 | 0.71 | 1.71 |
| Gomphonema clevei | 151.52 | 0.11 | 1.91 | 0.86 | 2.56 |
| G. minutum | 123.78 | 0.11 | 2.77 | 1.35 | 2.57 |
| G. olivaceum | 307.00 | 0.04 | 2.38 | 1.25 | 3.50 |
| G. parvulum | 149.99 | 0.09 | 1.73 | 1.10 | 1.80 |
| Luticola goeppertiana | 196.00 | 0.11 | 2.71 | 1.21 | 3.20 |
| L. mutica | 144.11 | 0.16 | 2.09 | 1.14 | 2.59 |
| L. saxophila | 146.62 | 0.07 | 2.02 | 1.10 | 2.52 |
| L. ventricosa | 164.64 | 0.08 | 2.16 | 0.99 | 2.89 |
| Mayamaea atomus var. permitis | 115.01 | 0.15 | 2.22 | 1.73 | 1.50 |
| Melosira varians | 159.79 | 0.08 | 1.42 | 0.84 | 1.68 |
| Nitzschia acicularis | 381.00 | 0.64 | 3.43 | 0.72 | 5.50 |
| Ni. amphibia | 117.90 | 0.12 | 2.09 | 0.99 | 2.63 |
| Navicula capitata | 129.70 | 0.07 | 1.17 | 0.73 | 1.73 |
| Ni. clausii | 180.22 | 0.33 | 2.35 | 1.51 | 2.48 |
| Ni. capitellata | 518.22 | 0.17 | 2.04 | 0.66 | 2.79 |
| Na. capitatoradiata | 67.18 | 0.10 | 1.39 | 1.10 | 1.49 |
| Na. cryptotenella | 129.84 | 0.06 | 1.43 | 0.85 | 1.97 |
| Na. decussis | 141.03 | 0.11 | 1.35 | 0.81 | 2.00 |
| Ni. dissipata | 196.00 | 0.11 | 2.71 | 1.21 | 3.20 |
| Na. eidrigiana | 118.00 | 0.02 | 0.48 | 0.46 | 1.10 |
| Ni. lacuum | 116.00 | 0.09 | 1.78 | 0.97 | 2.10 |
| Nitzschia inconspicua | 177.55 | 0.10 | 1.78 | 0.93 | 3.00 |
| Ni. intermedia | 642.00 | 0.04 | 1.76 | 0.50 | 2.40 |
| Ni. levidensis | 194.55 | 0.09 | 1.56 | 0.82 | 1.90 |
| Ni. palea | 234.81 | 0.16 | 1.91 | 0.95 | 2.28 |
| Ni. pumila | 234.99 | 0.08 | 2.41 | 0.93 | 2.96 |
| Na. reichardtiana | 65.36 | 0.14 | 1.17 | 0.73 | 1.69 |
| Nit. sinuata var.tabellaria | 39.20 | 0.10 | 0.62 | 0.58 | 1.00 |
| Na. schroeteri var. symmetrica | 129.86 | 0.11 | 1.66 | 1.07 | 1.90 |
| Ni. subacicularis | 117.16 | 0.05 | 0.93 | 0.65 | 1.47 |
| Na. trivialis | 125.41 | 0.06 | 2.16 | 1.45 | 1.99 |
| Na. veneta | 132.59 | 0.08 | 1.79 | 0.96 | 2.43 |
| Na. viridula var.rostellata | 128.65 | 0.09 | 1.40 | 0.82 | 2.00 |
| Planothidium frequentissimum | 162.15 | 0.07 | 1.71 | 0.96 | 2.44 |
| Pinnularia subcapitata | 265.82 | 0.20 | 2.12 | 1.19 | 2.45 |
| Surirella brebissonii | 107.99 | 0.02 | 1.75 | 1.39 | 1.34 |
| Sellaphora pupula | 181.13 | 0.15 | 1.86 | 1.03 | 2.35 |
TP的最适值范围为0.02—0.64 mg/L。其中发现Ni. Acicularis对TP的最适值最高。Au. lirata,A. lanceolata ssp. rostrata,Na. schroeteri var. symmetrica,Ni. amphibia,Ni. inconspicua,Ni. sinuata等附生硅藻具有较高的TP最适值。
TN的最适值范围是0.48—3.43mg/L,NO3-N的最适值范围是0.46—2.77mg/L。在本研究中,随着N含量的变化,附生硅藻出现了适合在相对高的TN、NO3-N环境(Eunotia bilunaris) 至适度的TN、NO3-N水体(Achnanthidium minutissimum,Cyclotella meneghiniana,Gomphonema olivaceum,Na. schroeteri,Ni inconspicua)以及较低TN、NO3-N最适值的(Na. eidrigiana,Achnanthes lanceolata ssp. Rostrata,Cymbella affinis,Ni. sinuata)硅藻群落。
CODKMnO4的最适值范围为1.0—5.5mg/L,CODKMnO4最适值相对较高的附生硅藻群落(Cyclotella meneghiniana,Cyclostephanos invisitatus,Gomphonema olivaceum,Nitzschia acicularis)大部分位于电导率最适值较高的范围内。
3 讨论 3.1 影响附生硅藻的水质因子本文显示电导率、高锰酸盐指数、硝氮、总磷和总氮是影响东江流域附生硅藻群落分布的主要水质因子。Philibert[19]的研究中也报道了电导率、总氮和总磷是影响澳大利亚东南部的河流硅藻群落分布的主要环境因素。在欧洲一些河流中,由于酸化问题,导致pH和TP是影响河流硅藻群落分布的主要水质因素[20]。
电导率是影响东江流域附生硅藻群落分布的重要因素之一,这与许多研究结果相一致。电导率能反映水体中各种离子的总浓度和总含量,因此,其大小与水体中溶解盐的含量有关。Rott[21]等认为电导率在特定研究区域是决定硅藻群落组成的重要环境因素。Potapova和Charles[8]从美国众多河流中的大量数据分析,认为硅藻群落组成分布的差异性,可以从水体中电导率和营养盐的变化中反映出来。Belore[22]等认为水体电导率能综合流域特征,如基石类型,温度,海拔和流速,进而造成硅藻群落分布的差异性。本研究中,CCA中的第一排序轴与电导率显著相关,也反映了东江流域的附生硅藻群落分布主要受水体电导率影响。
本研究CCA显示,CODKMnO4对东江流域附生硅藻群落分布影响也很大。江源[23]等人研究东江浮游植物群落结构与水质的关系时,也认为CODKMnO4浓度和电导率是影响东江干流浮游植物密度及属类数的重要因素。Schiller和Marti[24]通过一些试验发现营养盐是影响硅藻生长的重要因子。本研究中,CODKMnO4是影响附生硅藻的主要因素,其原因可能与水体中大量有机物氧化分解有关,东江沿河城市经济发达,人类活动密集,有机物来源充足,进入水体的有机物经氧化分解,最终变成藻类可利用的营养盐。
本研究CCA显示,在一定程度上东江流域附生硅藻群落也受氮、磷的影响,由水质因子对附生硅藻群落分布的影响程度大小可知,硝氮的影响大于总氮、总磷。Kelly和Whitton[25],Ponader和Charles[26],及Lavoie和Campeau[27]认为富营养化和有机污染对硅藻群落结构起重要作用。在美国安大略湖南部的河流[7]、新泽西州北部的河流[26]的研究中也显示总氮和总磷是影响河流硅藻群落的主要环境因素。Pan和Stevenson[28]认为硅藻的生长与水体中的营养物浓度有关,特别是氮、磷的影响,在欧洲河流中总磷的影响更显著。而在东江流域中,硝氮对附生硅藻群落的作用比较大,可能由于水体中的氮主要以水溶性的硝氮大量存在,更容易满足硅藻对氮的需求。Ponader和Charles[29]在对新泽西州河流中硅藻群落研究中也证实,总磷与硝氮能很好地解释硅藻群落的差异。
3.2 附生硅藻最适生态值本文主要附生硅藻对水质因子的最适值与以往的研究具有较高的一致性。东江流域Cyclotella meneghiniana,Cyclostephanos invisitatus,Gomphonema olivaceum,Nitzschia acicularis,Ni. capitellata,Ni. intermedia,Pinnularia subcapitata相对其它附生硅藻种类电导率最适值较高。Van Dam[9],Hustedt[30]以电导率为指标,将以上种划分为喜好盐淡水和盐水水体的生态类群,其对电导率要求相对较高。Achnanthes exilis,Fragilaria brevistriata,Ni. pumila,Ni. palea也具有较高的电导率最适值,这与Potapova[3]在美国河流的研究结论相一致。而东江流域的Achnanthes lanceolata ssp. rostrata,Achnanthidium minutissimum,Gomphonema parvulum,Melosira varians,Ni. amphibia,Ni. dissipata,Ni. inconspicua,Sellaphora pupula的电导率与Potapova[8]的研究相比,最适值偏低,可能美国河流地处典型的喀斯特地形,水体离子的组成和含量增多,水体电导率增大,从而影响这些硅藻对电导率最适值也增大。
东江流域64个主要附生硅藻种中有33个种总磷最适值大于0.09mg/L。东江流域的Cyclotella meneghiniana,Gomphonema parvulum,Ni. acicularis,Ni. amphibia,Ni. clausii,Ni. inconspicua是普遍性种类,Van Dam[9]认为这些种类属于α-中污染性与强污染性种类,能够忍耐较高的有机污染物,是中营养和富营养状况的指示性种。Eolimna subminuscula,Ni. amphibia,Ni. inconspicua和Ni. palea在许多文献中都作为高TP“污染”的指示种[21, 31, 32, 33]。Luticola goeppertiana也具有高TP的最适值,这与Potapova[32] 的报道一致。值得注意的是东江流域的Achnanthidium minutissimum的TP最适值较高,而Potapova[32]认为A. minutissimum是低营养的指示物种,其TP最适值小于0.01mg/L。Van Dam[9]认为A. minutissimum是水体贫营养到富营养的优势物种。Christine[33也报道了A. minutissimum 的TP最适值较低,但Christine同时也认为该种对TP的耐受范围较大。
本研究中,Eunotia bilunaris,Ni. acicularis的TN最适值大于3mg/L,其它TN最适值相对较高的种有Aulacoseira ambigua,Au. lirata,Cyclotella meneghiniana,Cyclostephanos invisitatus,Diadesmis confervacea,Ni. acicularis,Ni. clausii。根据Van Dam[9]对生态类群的划分,这些种喜好在溶解氧低,营养水平较高的环境中生存,是富营养状况的指示种。Cymbella affinis,Na. eidrigiana,Ni. sinuata var.tabellaria,Ni. subacicularis这4种附生硅藻TN的最适值小于1mg/L。通过对东江流域和新泽西州北部河流21种相同附生硅藻的对比,发现东江硅藻的TN最适值比在新泽西州的高[26]。本研究中,Ni. acicularis对TN、TP的最适值均最高,分别为3.43mg/L和0.64mg/L; Na. eidrigiana对TN、TP的最适值均最低,分别为0.48mg/L和0.02mg/L。这暗示Ni. acicularis这类附生硅藻可以作为有机物污染水体严重的指示种,而Na. eidrigiana可作为水质清洁的指示种。但是,使用硅藻对水质的指示仍有不确定因素的影响。Pan[28]认为河流中营养物质浓度,尤其是限制性营养元素,会随着时间和空间的改变,出现暂时性的浓度变化,从而影响硅藻群落结构组成。Winter[7]发现由于硅藻种群与河流中其他非硅藻种群(如绿藻Cladophora sp.)存在营养元素竞争,导致水体中营养物质浓度的改变,进而改变硅藻群落分布。这些不确定因素均对河流附生硅藻水质监测与评价带来一定影响,这需要进一步加强河流附生硅藻生态学的基础研究。
| [1] | Salomoni S E, Rocha O, Callegaro V L, Lobo E A. Epilithic diatoms as indicators of water quality in the Gravataí river, Rio Grande do Sul, Brazil. Hydrobiologia, 2006, 559(1): 233-246. |
| [2] | Duong T T, Feurtet-Mazal A, Coste M, Dang D K, Boudou A. Dynamics of diatom colonization process in some rivers influenced by urban pollution (Hanoi, Vietnam). Ecological Indicators, 2007, 7(4): 839-851. |
| [3] | Bere T, Tundisi J G. Weighted average regression and calibration of conductivity and pH of benthic diatom assemblages in streams influenced by urban pollution - São Carlos/SP, Brazil. Acta Limnology Brasileira, 2009, 21(3): 317-325. |
| [4] | Urrea G, Sabater S. Epilithic diatom assemblages and their relationship to environmental characteristics in an agricultural watershed (Guadiana River, SW Spain). Ecological Indicators, 2009, 9(4): 693-703. |
| [5] | Leira M, Sabater S. Diatom assemblages distribution in catalan rivers, NE Spain, in relation to chemical and physiographical factors. Water Research, 2005, 39(1): 73-82. |
| [6] | Stevenson R J. Scale-dependent determinants and consequences of benthic algal heterogeneity. Journal of the North American Benthological Society, 1997, 16(1): 248-262. |
| [7] | Winter J G, Duthie H C. Epilithic diatoms as indicators of stream total N and total P concentration. Journal of the North American Benthological Society, 2000, 19(1): 32-49. |
| [8] | Potapova M, Charles D F. Distribution of benthic diatoms in U.S. rivers in relation to conductivity and ionic composition. Freshwater Biology, 2003, 48(8): 1311-1328. |
| [9] | Van Dam H, Mertens A, Sinkeldam J. A coded checklist and ecological indicator values of freshwater diatoms from The Netherlands. Netherland Journal of Aquatic Ecology, 1994, 28(1): 117-133. |
| [10] | Ter Braak C J F, Prentice I C. A theory of gradient analysis. Advances in Ecological Research, 1988, 18: 271-317. |
| [11] | EN 13946. Water quality-Guidance standard for the routine sampling and pretreatment of benthic diatoms from rivers. 2003. |
| [12] | EN 14407. Water quality-Guidance standard for the identification, enumeration and interpretation of benthic diatom samples from running waters. 2004. |
| [13] | Krammer K, Lange-Bertalot H. Bacillariophyceae. Berlin: Spektrum Akademischer Verlage GmbH, 2000. |
| [14] | 国家环境保护总局, 《水和废水监测分析方法》编委会. 水和废水监测分析方法 (第四版). 北京: 中国环境科学出版社, 2002. |
| [15] | Ter Braak C J F. Canonical correspondence analysis: a new eigenvector technique for multivariate direct gradient analysis. Ecological Society of America, 1986, 67(5): 1167-1179. |
| [16] | Briks H J B, Line J M, Juggins S, Stevenson A C, Ter Braak C J F. Diatoms and pH reconstruction. Philosophical Transactions of the Royal Society of London. B, Biological Sciences, 1990, 327(1240): 263-278. |
| [17] | Juggins S. C2 Version 1. 5. Software for ecological and palaeoecological data analysis and visualization. University of Newcastle, Newcastle-upon-Tyne, 2007. |
| [18] | Birks H J B. Quantitative palaeoenvironmental reconstructions//Maddy D, Brew J S. Statistical Modelling of Quaternary Science Data. Technical Guide 5, Quaternary Research Association. Cambridge: Cambridge University Press, 1995: 161-254. |
| [19] | Philibert A, Gell P, Newall P, Chessman B, Bate N. Development of diatom-based tools for assessing stream water quality in south-eastern Australia: assessment of environmental transfer functions. Hydrobiologia, 2006, 572(1): 103-114. |
| [20] | Enache M, Prairie Y T. WA-PLS diatom-based pH, TP and DOC inference models from 42 lakes in the Abitibi clay belt area (Québec, Canada). Journal of Paleolimnology, 2002, 27(2): 151-171. |
| [21] | Rott E, Duthie H C, Pipp E. Monitoring organic pollution and eutrophication in the Grand River, Ontario, by means of diatoms. Canadian Journal of Fisheries and Aquatic Sciences, 1998, 55(6): 1443-1453. |
| [22] | Belore M L, Winter J G, Duthie H C. Use of diatoms and macroinvertebrates as bioindicators of water quality in Southern Ontario Rivers. Canadian Water Resources Journal, 2002, 27(4): 457-484. |
| [23] | 江源, 王博, 杨浩春, 刘全儒, 周云龙. 东江干流浮游植物群落结构特征及与水质的关系. 生态环境学报, 2011, 20(11): 1700-1705. |
| [24] | Schiller D V, Marti E, Riera J L, Sabater F. Effects of nutrients and light on periphyton biomass and nitrogen uptake in Mediterranean streams with contrasting land uses. Freshwater Biology, 2007, 52(5): 891-906. |
| [25] | Kelly M G, Whitton B A. The Trophic Diatom Index: a new index for monitoring eutrophication in rivers. Journal of Applied Phycology, 1995, 7(4): 433-444. |
| [26] | Ponader K C, Charles D F, Belton T J. Diatom-based TP and TN inference models and indices for monitoring nutrient enrichment of New Jersey streams. Ecological Indicators, 2007, 7(1): 79-93. |
| [27] | Lavoie I, Campeau S, Darchambeau F, Cabana G, Dillon P J. Are diatoms good integrators of temporal variability in stream water quality? Freshwater Biology, 2008, 53(4): 827-841. |
| [28] | Pan Y D, Stevenson R J, Hill B H, Herlihy A T, Collins G B. Using diatoms as indicators of ecological conditions in lotic systems: a regional assessment. Journal of the North American Benthological Society, 1996, 15(4): 481-495. |
| [29] | Ponader K C, Belton T J. Understanding the relationship between natural conditions and loadings on eutrophication: algal indicators of eutrophication for New Jersey streams: Final Report Year 2. 2004. |
| [30] | Hustedt F. Die Diatomeenflora des fluss-systems der weser im gebiet der hansestadt bremen. Abhandlungen des Naturwissenschaaftlichen Vereins zu Bremen, 1957, 34: 181-440. |
| [31] | Lange-Bertalot H. Pollution tolerance of diatoms as a criterion for water quality estimation. Nova Hedwigia Beih, 1979, 64: 285-304. |
| [32] | Potapova M G, Charles D F, Ponader K C, Winter D M. Quantifying species indicators values for trophic diatom indices: a comparison of approaches. Hydrobiologia, 2004, 517(1): 25-41. |
| [33] | Weihoefer C L, Pan Y D. Using change-point analysis and weighted averaging approaches to explore the relationships between common benthic diatoms and in-stream environmental variables in mid-atlantic highlands stream, USA. Hydrobiologia, 2008, 614(1): 259-274. |