 2023, Vol. 43
文章信息
- 桑亚转, 尤杨, 李多才, 安玉峰, 侯扶江
- SANG Yazhuan, YOU Yang, LI Duocai, AN Yufeng, HOU Fujiang
- 放牧对祁连山高寒典型草原土壤质量的影响
- Effect of grazing on soil quality of typical alpine steppe in Qilian Mountains
- 生态学报. 2023, 43(15): 6364-6377
- Acta Ecologica Sinica. 2023, 43(15): 6364-6377
- http://dx.doi.org/10.5846/stxb202203230714
-
文章历史
- 收稿日期: 2022-03-23
- 采用日期: 2022-12-02


2. 武威市食品药品监督管理局, 武威 733020;
3. 肃南裕固族自治县兽医局, 张掖 734400
2. Wuwei Food and Drug Administration, Wuwei 733020, China;
3. Sunan Yugur Autonomous County Veterinary Bureau, Zhangye 734400, China
土壤质量是陆地生态系统结构与功能的基础[1], 其评估有多种概念框架和模型, 土壤质量指数因具有内容灵活、统计简易且与土地管理密切相关等特性, 是量化土壤质量最常用的方法之一[2]。土壤质量指数建立在将土壤物理、化学、生物等指标整合分析的基础上, 而大量指标的冗余性成为土壤质量指数定量与定性制定过程中的挑战[3]。基于降维与模糊数学理论构建的最小数据集(Minimum data set, MDS)则可挑选出影响土壤质量指数的关键性指标, 进而在精准评估的基础上简化评估过程[4]。
放牧是草地资源最主要的利用方式之一[5], 家畜放牧行为如践踏、卧息等影响土壤物理结构, 采食与排泄则以粪便和尿液的形式返还土壤[6], 并且不同的放牧率也会影响土壤性质。轻度放牧下土壤碳水化合物相对比例较高, 土壤CO2释放的温度敏感性低于重度放牧, 反之重度放牧加速了土壤有机碳向大气中释放CO2的潜力[7]。草地生态系统中土壤理化性质与植物群落结构对不同放牧方式和管理的响应有所差异[8]。中度干扰假说认为, 不同放牧率对草地生态系统的影响存在适宜区间, 时空尺度的差异会导致不同结果[9]。祁连山高寒草原因季节性轮牧划分多种牧场形式, 春秋季牧场放牧期长, 而冬季牧场植物度过了生长旺季, 导致不同种类牧场中植物群落与土壤性质对放牧强度的响应差异较大[10]。放牧对土壤质量的影响建立在土壤理化性质与植物群落结构相互作用的形式之上, 两者的有机结合是探究放牧影响的关键, 而系统耦合则能够描述两个及以上系统或要素之间的响应效果[11]。为此, 通过草地生态系统中植物群落特征与土壤理化性质耦合可以表征两者之间反馈效益与联系, 进而依据耦合指数探究放牧草地土壤与植物之间的相互作用程度[12]。
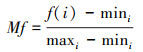
植物—土壤反馈是陆地生态系统维持稳定的基础, 土壤质量与植物物种多样性是草地生态系统结构和功能的主要影响因素, 然而单一指标阐释生态系统作用缺少对因素间的权衡, 导致评价结果片面[13]。生态系统多功能性(Ecosystem Multifunctionality, EMF)统筹了生态系统整体功能性与服务能力[14], 包括为植物群落构建的土壤质量“基质”[15]。建立土壤理化性质与植物多样性为功能特征的生态系统多功能性, 可以更加深刻地反映土壤质量指数构建的生态学意义。为此我们假设, 生态系统多功能性能够间接反映外界条件对土壤质量的影响(图 1)。为了深入探究放牧对土壤质量的影响与机制, 本研究以祁连山高寒典型草原冬季和春秋季牧场为研究对象, 拟解决以下科学问题:(1)放牧对不同季节性牧场土壤质量的影响;(2)放牧对土壤因子与植物群落物种多样性耦合关系的影响;(3)放牧对土壤质量与生态系统多功能性关系的影响。

|
| 图 1 放牧对土壤质量的作用概念图 Fig. 1 Sketch diagram of grazing effect on soil quality |
研究区位于甘肃省肃南裕固族自治县的寒温微干山地典型草原(高寒典型草原, 99°33′ E, 38°56′N), 海拔约2800 m, 年平均气温和降雨量分别为3.6℃和1785 mm。试验地土壤类型为山地栗钙土[16], 主要植物有针茅属(Stipa spp)、早熟禾属(Poa spp)、冰草属(Agropyron spp)、赖草属(Leymus spp)[17]。
1.2 样地设置选择试验区域的冬季牧场和春秋季牧场, 从两个牧场的入口开始向牧场内放射状延申划分小区。以牧场入口为起点(0 m), 依次于0 m、300 m、600 m、900 m、1200 m和1500 m处作为样地划分起点, 各建立1个100 m×100 m样地。冬季牧场于每年11月中下旬—翌年2月放牧马鹿(Cervus canadensis, red deer), 春秋季牧场于每年6月、8月下旬—9月放牧, 各个样地放牧率的判断采用标准是头月-1 hm-2[17]。冬季牧场和春秋季牧场6个样地放牧率分别为6.90、4.85、3.45、2.45、1.45、1.00头月-1 hm-2和3.35、2.80、2.30、1.50、0.80、0.20头月-1 hm-2[17]。
1.3 样品采集在每个样地中, 按S型取样随机设置5个1 m × 1 m样方[18], 分种统计植物物种数量。在样方框内随机采集土壤样品, 使用直径为5 mm的不锈钢土钻采集0—10 cm土壤样品两份, 并将每个小区内的土壤样品混合后用2 mm筛子去除植物组织、凋落物等杂质, 室内风干后, 测定其土壤理化性质。
1.4 样品分析土壤全盐量、含水量、容重、pH和土壤有机碳测定采用国标法;土壤全氮测定采用凯氏定氮法;土壤全磷测定采用酸溶—钼锑抗比色法;土壤速效氮测定采用碱解扩散法;土壤速效磷测定采用氟化铵盐酸比色法[19]。
1.5 数据处理方法 1.5.1 评价指标体系及隶属度函数选择依据高寒典型草原特性, 将土壤理化因子依次定义为S型函数(全氮、全磷、速效氮、速效磷和土壤有机碳), 反S型函数(土壤全盐)和抛物线型函数(土壤容重、土壤含水量、土壤pH、碳氮比、碳磷比和氮磷比)[20], 以实测结果综合确定隶属函数最适值范围(表 1)。
| 指标 Indicators |
隶属函数类型 Affiliate function type |
计算公式 Calculate formula |
参数(冬季牧场/春秋季牧场) Parameter (winter/spring and autumn grazing land) |
|||
| 最小值m1 Minimum m1 |
最适值上限n1 Best value upper limit n1 |
最适值下限n2 Best value lower limit n2 |
最大值m2 Maximum m2 |
|||
| 土壤有机碳 Soil organic carbon/(g/kg) |
S型隶属函数 | y(x)=1, (x≥m2) | 40.96/12.21 | 151.29/24.91 | ||
| 土壤全氮 Soil total nitrogen/(g/kg) |
y(x)=(x-m1)/(m2-m1), (m1<x<m2) | 8.73/12.88 | 12.61/21.17 | |||
| 土壤全磷 Soil total phosphorus/(g/kg) |
y(x)=0, (x≤m1) | 4.45/4.50 | 5.27/5.42 | |||
| 土壤速效氮 Soil available nitrogen/(mg/kg) |
50.90/11.40 | 124.40/25.27 | ||||
| 土壤速效磷 Soil available phosphorus/(g/kg) |
8.87/19.44 | 23.17/26.80 | ||||
| 土壤全盐 Soil salt/(g/kg) |
反S型隶属函数 | y(x)=1, (x≤m1) | ||||
| y(x)=(m2-x)/(m2-m1), (m1<x<m2) | 0.54/0.61 | 0.97/0.85 | ||||
| y(x)=0, (x≥m2) | ||||||
| 土壤容重 Soil bulk density/(g/cm3) |
抛物线型隶属函数 | y(x)=1, (n1≤x≤n2) | 0.88/1.17 | 1.20/1.30 | 1.40/1.81 | 1.83/2.14 |
| 土壤含水量 Soil moisture/% |
11.30/12.55 | 25.00/14.46 | 35.00/20.68 | 37.50/27.09 | ||
| 土壤pH Soil pH |
y(x)=(x-m1)/(n1-m1), (m1<x<n1) | 7.78/7.72 | 7.90/7.76 | 8.20/8.17 | 8.25/8.31 | |
| 土壤碳氮比 Soil organic carbon to total nitrogen ratio |
y(x)=(m2-x)/(m2-n2), (n2<x<m2) | 3.02/0.80 | 4.00/0.86 | 7.00/1.15 | 8.16/1.30 | |
| 土壤碳磷比 Soil organic carbon to total phosphorus ratio |
y(x)=0, (x≥m2或x≤m1) | 8.67/2.33 | 15.00/2.82 | 25.00/3.83 | 28.72/5.30 | |
| 土壤氮磷比 Soil total nitrogen to total phosphorus ratio |
1.72/2.52 | 1.80/2.83 | 2.30/3.74 | 2.48/4.52 | ||
采用主成分分析确定放牧条件下影响两个季节性牧场土壤质量的最小数据集(Minimum data set, MDS)。将样本总方差解释度大于5%的主成分设立为备选对象后, 特征值较大的土壤因子选项预留在MDS中。参照Norm值, 规避数据冗余与关键信息遗漏(式1), 一组具有代表性的土壤指标中, 选择其中Norm值最大的因子[21]。
|
(1) |
式中, Nik:i的综合荷载(特征值≥1的前k个主成分);Uik:i的载荷(第k个主成分);λ:h主成分的特征值。
MDS数据采用[0—1]的无量纲标准化, 根据每一个指标的公因子方差, 计算对应的权重值(式2):
|
(2) |
式中, Wi:i的权重; Ci:i的公因子方差;n:MDS指标数。
1.5.3 土壤质量指数计算将MDS各指标数据[0, 1]标准化得到加权求和土壤质量指数(Soil quality index, SQIw)[21](式3):
|
(3) |
式中, Fi:i的隶属度值;Wi:i的权重。
1.5.4 植物群落物种多样性计算采取物种丰富度指数(Species richness index)、Shannon-Wiener多样性指数(Shannon-Wiener index)和均匀度指数(Pielou-evenness index)[22]。
1.5.5 生态系统耦合度根据灰色关联度模型计算两个季节性牧场植物与土壤的耦合关系和协调程度[22]。δr(p)(i)为两个季节性牧场土壤指标r和植物群落物种多样性指标p之间的关联系数(式4):
|
(4) |
式中, zrL(i)和zpR(i)分别为第i个样点土壤指标r和植物群落物种多样性指标p的标准化值, ρ为分辨系数(取值0.5)。
关联系数依据样本数为背景取其平均值构建关联度矩阵γ(m × n), 其中γ代表土壤因子和植物群落物种多样性指标间的关联程度。m(土壤因子), n(植物群落物种多样性指标)。
关联性评定标准:区间范围在0 < γrp≤0.35、0.35 < γrp≤0.65、0.65 < γrp≤0.85、0.85 < γrp≤1分别代表关联度为弱、中、较强、极强。
在关联度矩阵γ基础上, 依据公式(5和6)计算主要影响因素和反馈情况:
|
(5) |
|
(6) |
式中, dr:土壤因子(L)第r个指标对植物群落物种多样性(I)的影响关联度;dp:植物群落物种多样性(I)第p个指标对土壤因子(L)的影响关联度。(r=1, 2, …, m;p=1, 2, …, n)
依据系统耦合度模型, 两个季节性牧场土壤与植物因子耦合程度(C)的计算公式(7)为:
|
(7) |
系统耦合协调度标准范围:严重不协调(0≤C < 0.4);中度不协调(0.4≤C < 0.5);轻度不协调(0.5≤C < 0.6);弱协调(0.6≤C < 0.7);中度协调(0.7≤C < 0.8);良协调(0.8≤C < 0.9);优协调(0.9≤C < 1.0)。
1.5.6 生态系统多功能性指数(EMFI)的计算将土壤指标和植物群落物种多样性指标标准化(式8、9), 生态系统多功能性指数(Ecosystem Multifunctionality Index, EMFI)的计算采用平均值法(式10)[23]:
|
(8) |
式中, xi:i的生态系统功能参数;maxi:i内生态系统功能参数的最大值。
|
(9) |
式中, maxi:i内f(i)的生态系统功能参数的最大值;mini:i内f(i)的生态系统功能参数的最小值, 使Mf维持在0—1水平上。
|
(10) |
式中, EMFI:i的生态系统多功能性指数。
1.5.7 生态系统多功能性与土壤质量的检验为检验土壤质量与生态系统多功能性的关系, 采用决定系数(R2)和模型效率(E)评价模型的预测能力。同时, 采用总相对误差(RS)和平均相对误差(RMA)的绝对值、均方根误差(RMSE)和皮尔逊积矩相关系数(Pearson′s r)验证样本分析的实测值和估测值的拟合性[24]。R2和E越接近1, RMSE越接近0, r趋于1或-1, 当RS绝对值< 20%, RMA绝对值< 30%时, 模型性能越好, 满足精度要求。
|
(11) |
|
(12) |
|
(13) |
|
(14) |
|
(15) |
式中:Mi:样本实测值;Si:样本估测值;n:验证样本数;M:M的平均值;S:S的平均值。
1.6 数据处理采用SPSS 26.0(IBM, 美国)进行统计分析, 不同处理间土壤理化因子与植物多样性指标采用Turkey HSD单因素方差分析、Pearson相关性分析和主成分分析, 使用Prism 8.0 (GraphPad Software, 美国)、Origin(OriginLab, 美国)软件进行图表绘制。
2 结果与分析 2.1 土壤质量指数的构建两个季节性牧场土壤理化性质主成分分析(特征值≥1)结果表明, 冬季牧场土壤理化指标分为4个主成分, 其特征值分别为5.73, 1.86, 1.52, 1.16, 对应解释度分别为47.77%, 15.47%, 12.64%, 9.65%, 4个主成分总累计解释度为85.53%(表 2);春秋季牧场土壤理化性质主成分分析结果表明, 其土壤理化指标分为3个主成分, 其特征值分别为6.40, 1.86, 1.42, 对应解释度分别为53.33%, 15.53%, 11.85%, 3个主成分累计解释度为80.71%(表 3)。
| 土壤指标 Soil indicators |
主成分1 Principal component analysis 1 |
主成分2 Principal component analysis 2 |
主成分3 Principal component analysis 3 |
主成分4 Principal component analysis 4 |
Norm值 Norm value |
公因子方差 Common variance |
分组 Group |
| 土壤速效磷Soil available phosphorus/(g/kg) | 0.88 | 0.20 | 0.15 | 0.01 | 1.94 | 0.95 | 1 |
| 土壤容重Soil bulk density/(g/cm3) | 0.87 | 0.09 | -0.14 | -0.15 | 1.91 | 0.57 | 1 |
| 土壤含水量Soil moisture/% | 0.80 | 0.20 | 0.09 | 0.08 | 1.76 | 0.69 | 1 |
| 土壤速效氮Soil available nitrogen/(mg/kg) | 0.77 | 0.15 | -0.18 | 0.47 | 1.68 | 0.81 | 1 |
| 土壤全盐Soil salt/(g/kg) | -0.74 | -0.05 | 0.12 | -0.06 | 1.60 | 0.98 | 1 |
| 土壤全氮Soil total nitrogen/(g/kg) | 0.73 | 0.42 | 0.39 | 0.20 | 1.73 | 0.94 | 1 |
| 土壤碳磷比 Soil organic carbon to total phosphorus ratio |
-0.16 | 0.96 | -0.08 | 0.06 | 1.68 | 0.90 | 2 |
| 土壤碳氮比 Soil organic carbon to total nitrogen ratio |
0.44 | 0.88 | 0.05 | 0.05 | 1.79 | 0.84 | 2 |
| 土壤有机碳Soil organic carbon/(g/kg) | 0.45 | 0.88 | -0.04 | 0.06 | 1.79 | 0.86 | 2 |
| 全磷Soil total phosphorus/(g/kg) | 0.37 | 0.30 | -0.85 | 0.04 | 0.94 | 0.96 | 3 |
| 氮磷比Soil total nitrogen to total phosphorus ratio | 0.56 | 0.28 | 0.74 | 0.16 | 1.29 | 0.95 | 3 |
| 土壤pH Soil pH | 0.03 | 0.07 | 0.07 | 0.97 | 0.13 | 0.98 | 4 |
| 特征值Eigenvalue | 5.73 | 1.86 | 1.52 | 1.16 | |||
| 解释度Explain the degree of/% | 47.77 | 15.47 | 12.64 | 9.65 | |||
| 累计解释度Cumulative explanatory degree/% | 47.77 | 63.24 | 75.88 | 85.53 |
| 土壤指标 Soil indicators |
主成分1 Principal component analysis 1 |
主成分2 Principal component analysis 2 |
主成分3 Principal component analysis 3 |
Norm值 Norm value |
公因子方差 Common variance |
分组 Group |
| 土壤速效氮 Soil available nitrogen/(mg/kg) |
0.93 | 0.04 | -0.20 | 2.02 | 0.90 | 1 |
| 土壤速效磷 Soil available phosphorus/(g/kg) |
0.91 | -0.19 | 0.05 | 2.00 | 0.87 | 1 |
| 土壤全氮 Soil total nitrogen/(g/kg) |
0.90 | -0.29 | 0.16 | 2.02 | 0.92 | 1 |
| 土壤有机碳 Soil organic carbon/(g/kg) |
0.88 | 0.44 | -0.10 | 2.05 | 0.97 | 1 |
| 土壤氮磷比 Soil total nitrogen to total phosphorus ratio |
0.86 | -0.19 | 0.39 | 1.95 | 0.92 | 1 |
| 土壤碳磷比 Soil organic carbon to total phosphorus ratio |
0.83 | 0.53 | 0.08 | 2.02 | 0.98 | 1 |
| 土壤含水量Soil moisture/% | 0.79 | 0.09 | -0.11 | 1.71 | 0.64 | 1 |
| 土壤全盐Soil salt/(g/kg) | -0.71 | 0.34 | -0.08 | 1.63 | 0.62 | 1 |
| 土壤碳氮比 Soil organic carbon to total nitrogen ratio |
0.28 | 0.89 | -0.29 | 1.72 | 0.96 | 2 |
| 土壤全磷Soil total phosphorus/(g/kg) | 0.25 | -0.36 | -0.71 | 1.30 | 0.70 | 3 |
| 土壤pH Soil pH | -0.46 | 0.43 | 0.57 | 1.48 | 0.72 | 3 |
| 土壤容重Soil bulk density/(g/cm3) | 0.47 | -0.13 | 0.50 | 1.25 | 0.49 | 3 |
| 特征值The eigenvalue | 6.40 | 1.86 | 1.42 | |||
| 解释度Explain the degree of/% | 53.33 | 15.53 | 11.85 | |||
| 累计解释度 Cumulative explanatory degree/% |
53.33 | 68.85 | 80.71 |
冬季牧场, 在总方差解释度大于5%前提下, 12个土壤理化性质指标被划分为4组, 土壤理化性质指标中仅1个指标可选择为最小数据集(MDS)。在第1组和第3组中, 将Norm值最大的速效磷和氮磷比入选最小数据集。第4组中仅有土壤pH, 故入选MDS。在第2组中, 土壤碳氮比Norm值与土壤有机碳Norm值相等(1.79), 但土壤碳氮比与各理化指标之间的相关性大于土壤有机碳, 故选择土壤有机碳进入MDS。最终确定的冬季牧场土壤质量MDS及其公因子方差和权重分别为土壤速效磷(公因子方差=0.95, 权重=0.08), 土壤有机碳(0.86, 0.09), 土壤氮磷比(0.95, 0.09), 土壤pH(0.98, 0.09)(表 4);春秋季牧场土壤理化指标被划分为3组, 第一组中选择Norm值最大且与其它理化指标相关性最小的土壤有机碳入选MDS, 同理将第2组中的土壤碳氮比和第3组中的土壤pH入选MDS。最终确定的春秋季牧场土壤质量MDS及其公因子方差和权重分别为土壤有机碳(0.97, 0.10), 土壤碳氮比(0.96, 0.10), 土壤pH(0.72, 0.07)(表 4)。
| 放牧地 Grazing land |
最小数据集 Minimum data set |
公因子方差 Common variance |
权重 The weight |
放牧地 Grazing land |
最小数据集 Minimum data set |
公因子方差 Common variance |
权重 The weight |
|
| 冬季牧场 | 速效磷/(g/kg) | 0.95 | 0.08 | 春秋季牧场 | 有机碳(g/kg) | 0.97 | 0.10 | |
| Winter grazing land | 有机碳/(g/kg) | 0.86 | 0.09 | Spring and autumn | 碳氮比 | 0.96 | 0.10 | |
| 氮磷比 | 0.95 | 0.09 | grazing land | pH | 0.72 | 0.07 | ||
| pH | 0.98 | 0.09 |
通过构建土壤质量指数, 冬季牧场和春秋季牧场放牧率分别在2.45头 月-1 hm-2和0.80头 月-1 hm-2时土壤质量指数最高(图 2);且随着放牧率的增加, 冬季牧场和春秋季牧场土壤质量指数呈降低趋势, 春秋季牧场对放牧率的响应较冬季牧场更敏感。

|
| 图 2 放牧对土壤质量的影响 Fig. 2 Effect of grazing on soil quality |
不同小写字母代表不同放牧率下的差异显著性(P < 0.05)
2.3 土壤质量与植物群落物种多样性土壤质量指数与植物群落物种多样性的相关性分析结果表明, 土壤质量指数与物种丰富度指数(P=0.02、P=0.03)和Shannon-Wiener多样性指数(P < 0.0001)显著正相关, 与均匀度指数相关性不显著(P > 0.05)(图 3)。

|
| 图 3 甘肃马鹿季节性牧场植物群落物种多样性与土壤质量回归分析 Fig. 3 Regression analysis of plant community species diversity and soil quality in winter grazing land and spring and autumn grazing land WGL:冬季牧场Winter grazing land;SAGL:春秋季牧场Spring and autumn grazing land; R2:决定系数Coefficient of determination |
冬季牧场中与植物群落物种多样性关联度最高的土壤因子为土壤容重, 其次是土壤速效氮和土壤pH。土壤最小数据集中土壤速效磷与物种丰富度指数关联度最高(0.76);土壤有机碳与物种丰富度指数和均匀度指数关联度最高(0.70;0.70);土壤氮磷比和土壤pH均与植物均匀度指数关联度最高(0.79;0.81)。在春秋季牧场, 与植物群落物种多样性关联度最高的土壤因子为土壤全磷, 其次是土壤氮磷比与土壤pH。土壤最小数据集中土壤有机碳与植物Shannon-Wiener多样性指数关联度最高(0.79);土壤碳氮比和土壤pH均与植物均匀度指数关联度最高(0.86;0.86)(表 5)。
| 放牧地 Grazing land |
指数 Index |
关联度Correlation | |||||||||||
| 土壤pH Soil pH |
土壤全盐 Soil salt/(g/kg) |
土壤含水量 Soil moisture/% |
土壤容重 Soil bulk density/(g/cm3) |
土壤有机碳 Soil organic carbon/(g/kg) |
全磷 Total P/(g/kg) |
全氮 Total N/(g/kg) |
速效磷 Available P/(g/kg) |
速效氮 Available N/(mg/kg) |
碳氮比 C/N |
氮磷比 N/P |
碳磷比 C/P |
||
| 冬季牧场 | 物种丰富度指数 | 0.66 | 0.65 | 0.62 | 0.72 | 0.70 | 0.66 | 0.65 | 0.76 | 0.70 | 0.69 | 0.65 | 0.68 |
| Winter grazing land | Shannon-Wiener多样性指数 | 0.61 | 0.60 | 0.52 | 0.78 | 0.65 | 0.65 | 0.61 | 0.74 | 0.74 | 0.67 | 0.59 | 0.63 |
| 均匀度指数 | 0.81 | 0.80 | 0.76 | 0.65 | 0.70 | 0.79 | 0.78 | 0.58 | 0.68 | 0.72 | 0.79 | 0.72 | |
| 平均值 | 0.69 | 0.68 | 0.64 | 0.72 | 0.68 | 0.70 | 0.68 | 0.69 | 0.71 | 0.69 | 0.67 | 0.68 | |
| 春秋季牧场 | 物种丰富度指数 | 0.64 | 0.57 | 0.68 | 0.73 | 0.65 | 0.71 | 0.73 | 0.66 | 0.67 | 0.62 | 0.68 | 0.61 |
| Spring and autumn grazing land | Shannon-Wiener多样性指数 | 0.75 | 0.66 | 0.68 | 0.72 | 0.79 | 0.84 | 0.81 | 0.56 | 0.74 | 0.72 | 0.81 | 0.73 |
| 均匀度指数 | 0.86 | 0.82 | 0.67 | 0.70 | 0.74 | 0.83 | 0.73 | 0.52 | 0.64 | 0.86 | 0.79 | 0.81 | |
| 平均值 | 0.75 | 0.68 | 0.68 | 0.72 | 0.73 | 0.79 | 0.76 | 0.58 | 0.68 | 0.73 | 0.76 | 0.72 | |
通过整合放牧地土壤因子和植物群落物种多样性耦合协调度(表 6), 冬季牧场不同放牧率下耦合度在0.67—0.81之间, 其中放牧率为2.45头 月-1 hm-2时耦合度(0.67)小于其它处理, 属于弱协调。放牧率在6.90头 月-1 hm-2时耦合度最高(0.81), 属于良好协调。春秋季牧场系统耦合度模型表明, 不同放牧率下耦合度在0.70—0.76之间, 放牧率在1.50头 月-1 hm-2时耦合度最高, 放牧率在2.80头 月-1 hm-2时耦合度最低, 且各个放牧率下均属于中度协调。
| 放牧地 Grazing land |
放牧率 Grazing rate/(头 月-1 hm-2) |
耦合度 Coupling degree |
协调类型 Coordination type |
放牧地 Grazing land |
放牧率 Grazing rate/(头 月-1 hm-2) |
耦合度 Coupling degree |
协调类型 Coordination type |
|
| 冬季牧场 | 6.90 | 0.81 | 良好 | 春秋季牧场 | 3.35 | 0.74 | 中度 | |
| Winter grazing land | 4.85 | 0.72 | 中度 | Spring and autumn | 2.80 | 0.70 | 中度 | |
| 3.45 | 0.71 | 中度 | grazing land | 2.30 | 0.74 | 中度 | ||
| 2.45 | 0.67 | 弱 | 1.50 | 0.76 | 中度 | |||
| 1.45 | 0.79 | 中度 | 0.80 | 0.72 | 中度 | |||
| 1.00 | 0.75 | 中度 | 0.20 | 0.75 | 中度 |
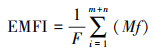
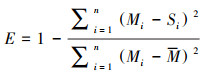
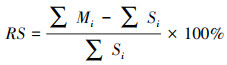
随着放牧率的增加, 生态系统多功能性指数逐渐降低, 两者呈显著负相关(P < 0.0001, 图 4), 且春秋季牧场土壤质量对生态系统多功能性表达更敏感(图 4)。使用春秋季牧场数据做预测模型, 生态系统多功能性指数与土壤质量指数呈显著正相关(图 5);冬季牧场数据进行回归模型评估, E=1.2976, RS=14.79%, RMA=53.97%, RMSE=0.0990, Pearson′s r=0.4633, 达到模型评估要求(图 6)。

|
| 图 4 甘肃马鹿季节性牧场土壤质量和生态系统多功能性回归分析 Fig. 4 Regression analysis of soil quality and ecosystem multifunctionality |

|
| 图 5 土壤质量和生态系统多功能性的一般线性模型 Fig. 5 General linear model of soil quality and ecosystem multifunctionality |

|
| 图 6 土壤质量指数实测值和估测值的比较 Fig. 6 Comparison of the soil quality index between the observed value and the estimated value E:模型效率Model efficiency;RS:总相对误差Total relative error;RMA:平均相对误差Mean relative error;RMSE:均方根误差Root mean square error |
土壤物理、化学和生物特征响应放牧季节与放牧率, 通过土壤质量指数表征放牧对草地土壤特征的影响具有代表性且高效[25]。本研究结果表明, 两个季节性牧场土壤质量分别随放牧率的增加呈下降趋势, 冬季牧场和春秋季牧场放牧率分别在2.45头 月-1 hm-2和0.80头 月-1 hm-2时土壤质量指数最高, 且春秋季牧场植物对放牧率的响应较冬季牧场更敏感(图 2)。放牧显著影响草地土壤生态系统功能, 土壤性质的变化是驱动草地土壤质量的主要因素[26]。草食动物通过践踏和粪便沉积影响土壤的性质与过程, 也可通过采食植被间接影响土壤养分含量与微生物群落结构特征[27]。适宜的放牧率提高草地植物多样性并加速物质循环进程, 从而改善土壤碳、氮循环效率[28]。然而, 重度放牧增加土壤表层紧实度和容重、减少草地初级生产力与凋落物向土壤的输入, 导致土壤有机质和水分的流失, 导致土壤质量下降[29—31]。本研究结果表明, 在冬季牧场中, 影响土壤质量的最小数据集为土壤速效磷, 土壤有机碳, 土壤氮磷比和土壤pH;在春秋季牧场中为土壤有机碳, 土壤碳氮比和土壤pH(表 4)。土壤有机碳是土壤质量的关键评价指标[32], 放牧强度调控土壤碳库的变化方向, 轻度放牧提高了草地生产力与凋落物积累量, 从而使土壤有机质含量增加, 而土壤有机碳的流失是过度放牧草地退化的原因之一[33—34]。家畜通过采食和践踏影响地上植物组织再生及其光合作用, 随着放牧强度超过生态阈值而抑制根系的生长[35—36], 同时植物根系吸收更多的土壤速效磷和速效氮为植物再生提供营养物质[37]。放牧家畜通过粪便和尿液的返还直接影响土壤pH, 而植物群落结构的改变间接反馈于土壤性质[38]。土壤碳氮比反映植物碳生产能力与土壤养分的积累和分配[35]。为此, 探究放牧对土壤质量与植物群落物种多样性之间的互作机制对于揭示放牧生态系统效应至关重要。
3.2 放牧对草地土壤—植物耦合的影响植物与土壤耦合是放牧管理的重要目标之一, 两者关联度之间的差异反映了植物—土壤各个因子互作的程度, 并最终体现在放牧管理对整个草地生态环境的耦合上[39]。本研究中两个季节性牧场属于中度协调(表 6), 表明在放牧条件下草地土壤与植物相互促进, 且有提升潜力。冬季牧场6.90头 月-1 hm-2放牧率下协调类型良好, 而在2.45头 月-1 hm-2放牧率下协调度最低(表 6), 反映了在土壤质量最低时, 土壤理化因子与植物群落物种多样性之间的关联性最强, 而在土壤质量最高时反之, 可能与植被组成对放牧的响应有关[40]。低放牧率下, 冬季牧场草地植物累积了充分的营养物质, 降低了植物对土壤养分的依赖程度。当放牧率超过草地生态系统载荷, 土壤速效养分快速流失并伴随着植物多样性降低[41], 进而增加了植物多样性与土壤理化性质的相互作用强度[42—45]。与春秋季牧场相比, 冬季牧场中植物处于枯萎或休眠状态, 家畜放牧对植物再生与演替的影响显著[29, 45—46]。高放牧率下冬季牧场积累的排泄物分解率低, 对植物次生演替与土壤理化性质具有长的时间脉冲效应[47], 也可能与耐牧和抗牧植物种增加有密切关系[44], 从而导致较高的植物—土壤耦合度。植物—土壤耦合展现了植物群落物种多样性与土壤因子之间的关系, 探究了放牧对土壤质量的潜在影响机制, 为生态系统多功能性验证最小数据集体系下土壤质量评价做了铺垫。
3.3 放牧调控下土壤质量—生态系统多功能性的关系生态系统受到外界变化做出功能响应[48]。放牧不仅影响土壤物理化学性质, 还参与植物群落结构与多样性的调控[49], 因此在评价放牧对土壤质量影响的同时, 可基于生态系统多功能性将土壤因子与植物因子相互结合, 进一步验证土壤质量评价的合理性。本研究结果表明, 随着放牧率的增加, 生态系统多功能性指数逐渐降低(P < 0.0001)(图 4);土壤质量指数与生态系统多功能性指数可以相互体现和验证(图 5、图 6)。生态系统多功能性权衡了系统中各个因素的作用, 间接证明了采用最小数据集法探究放牧对土壤质量作用的可靠性。而在今后的研究中, 充分利用更加全面的指标(如微生物群落结构与功能, 土壤酶系动态等)[3], 并结合生态系统多功能性是准确评价土壤质量的关键[50—51]。
4 结论利用最小数据集挖掘土壤质量关键因子, 结合植物—土壤耦合度, 揭示了放牧季节和放牧率对土壤质量的作用。影响土壤质量的关键因子因放牧季节和放牧率的变化而各有差异, 生态系统多功能性指数也间接证明了土壤质量指数构建的合理性。研究结果为草原可持续放牧利用提供了科学依据, 今后研究应更加全面地纳入和评价土壤质量影响因子。
| [1] |
朱永官, 彭静静, 韦中, 沈其荣, 张福锁. 土壤微生物组与土壤健康. 中国科学: 生命科学, 2021, 51(1): 1-11. |
| [2] |
Armenise E, Redmile-Gordon M A, Stellacci A M, Ciccarese A, Rubino P. Developing a soil quality index to compare soil fitness for agricultural use under different managements in the Mediterranean environment. Soil & Tillage Research, 2013, 130: 91-98. |
| [3] |
Bünemann E K, Bongiorno G, Bai Z G, Creamer R E, de Deyn G, de Goede R, Fleskens L, Geissen V, Kuyper T W, Mäder P, Pulleman M, Sukkel W, van Groenigen J W, Brussaard L. Soil quality-A critical review. Soil Biology and Biochemistry, 2018, 120: 105-125. DOI:10.1016/j.soilbio.2018.01.030 |
| [4] |
Nunes M R, Veum K S, Parker P A, Holan S H, Karlen D L, Amsili J P, van Es H M, Wills S A, Seybold C A, Moorman T B. The soil health assessment protocol and evaluation applied to soil organic carbon. Soil Science Society of America Journal, 2021, 85(4): 1196-1213. DOI:10.1002/saj2.20244 |
| [5] |
Macci C, Doni S, Bondi G, Davini D, Masciandaro G, Pistoia A. Effects of wild boar (Sus scrofa) grazing on soil properties in Mediterranean environment. CATENA, 2012, 98: 79-86. DOI:10.1016/j.catena.2012.06.005 |
| [6] |
侯扶江, 南志标, 任继周. 作物-家畜综合生产系统. 草业学报, 2009, 18(5): 211-234. |
| [7] |
Väisänen M, Sjögersten S, Large D, Drage T, Stark S. Long-term reindeer grazing limits warming-induced increases in CO2 released by tundra heath soil: potential role of soil C quality. Environmental Research Letters, 2015, 10(9): 094020. DOI:10.1088/1748-9326/10/9/094020 |
| [8] |
Lin X W, Zhang Z H, Wang S P, Hu Y G, Xu G P, Luo C Y, Chang X F, Duan J C, Lin Q Y, Xu B, Wang Y F, Zhao X Q, Xie Z B. Response of ecosystem respiration to warming and grazing during the growing seasons in the alpine meadow on the Tibetan Plateau. Agricultural and Forest Meteorology, 2011, 151(7): 792-802. DOI:10.1016/j.agrformet.2011.01.009 |
| [9] |
Li W L, Liu C L, Wang W Y, Zhou H K, Xue Y T, Xu J, Xue P F, Yan H P. Effects of different grazing disturbances on the plant diversity and ecological functions of alpine grassland ecosystem on the Qinghai-Tibetan Plateau. Frontiers in Plant Science, 2021, 12: 765070. DOI:10.3389/fpls.2021.765070 |
| [10] |
侯扶江. 草地-马鹿系统的草地表现[D]. 兰州: 甘肃农业大学, 2000.
|
| [11] |
张扬建, 朱军涛, 沈若楠, 王荔. 放牧对草地生态系统影响的研究进展. 植物生态学报, 2020, 44(5): 553-564. |
| [12] |
Baxendale C, Orwin K H, Poly F, Pommier T, Bardgett R D. Are plant-soil feedback responses explained by plant traits. New Phytologist, 2014, 204(2): 408-423. DOI:10.1111/nph.12915 |
| [13] |
Lindemann-Matthies P, Junge X, Matthies D. The influence of plant diversity on people's perception and aesthetic appreciation of grassland vegetation. Biological Conservation, 2010, 143(1): 195-202. DOI:10.1016/j.biocon.2009.10.003 |
| [14] |
Jing X, Sanders N J, Shi Y, Chu H Y, Classen A T, Zhao K, Chen L T, Shi Y, Jiang Y X, He J S. The links between ecosystem multifunctionality and above-and belowground biodiversity are mediated by climate. Nature Communications, 2015, 6(1): 1-8. |
| [15] |
Fang A M, Bao M H, Chen W Q, Dong J H. Assessment of surface ecological quality of grassland mining area and identification of its impact range. Natural Resources Research, 2021, 30(5): 3819-3837. DOI:10.1007/s11053-021-09868-8 |
| [16] |
任继周. 分类、聚类与草原类型. 草地学报, 2008, 16(1): 4-10. |
| [17] |
侯帅君, 王迎新. 马鹿夏季放牧对祁连山草原群落多样性的影响. 草业学报, 2020, 29(10): 206-210. |
| [18] |
侯扶江, 李广, 杨逢刚. 甘肃马鹿夏冬季在祁连山高山草地的放牧行为. 生态学报, 2003, 23(9): 1807-1815. |
| [19] |
鲍士旦. 土壤农化分析. 北京: 中国农业出版社, 2005: 1-40.
|
| [20] |
卓志清, 李勇, 勾宇轩, 赵云泽, 黄元仿, 兴安. 基于最小数据集的东北旱作区耕层质量评价与障碍诊断. 农业机械学报, 2021, 52(9): 321-330. |
| [21] |
李霞, 朱万泽, 舒树淼, 盛哲良, 王文武. 基于主成分分析的大渡河中游干暖河谷草地土壤质量评价. 生态学报, 2021, 41(10): 3891-3900. |
| [22] |
薛鸥, 魏天兴, 刘飞, 李英勇. 公路边坡植物群落多样性与土壤因子耦合关系. 北京林业大学学报, 2016, 38(1): 91-100. |
| [23] |
徐炜, 井新, 马志远, 贺金生. 生态系统多功能性的测度方法. 生物多样性, 2016, 24(1): 72-84. |
| [24] |
Qiu Y, Fu B, Wang J, Chen L, Meng Q, Zhang Y. Spatial prediction of soil moisture content using multiple-linear regressions in a gully catchment of the Loess Plateau, China. Journal of Arid Environments, 2010, 74(2): 208-220. DOI:10.1016/j.jaridenv.2009.08.003 |
| [25] |
Donovan M, Monaghan R. Impacts of grazing on ground cover, soil physical properties and soil loss via surface erosion: a novel geospatial modelling approach. Journal of Environmental Management, 2021, 287: 112206. DOI:10.1016/j.jenvman.2021.112206 |
| [26] |
Dong S K, Shang Z H, Gao J X, Boone R B. Enhancing sustainability of grassland ecosystems through ecological restoration and grazing management in an era of climate change on Qinghai-Tibetan Plateau. Agriculture, Ecosystems and Environment, 2020, 287: 106684. |
| [27] |
Semmartin M, Di Bella C, de Salamone I G. Grazing-induced changes in plant species composition affect plant and soil properties of grassland mesocosms. Plant and Soil, 2010, 328(1/2): 471-481. |
| [28] |
唐刘燕, 国慧, 杨振安. 不同放牧模式下青藏高原高寒草甸植被群落和土壤差异. 草业科学, 2021, 38(7): 1209-1217. |
| [29] |
刘金鑫, 宫渊波, 左琴, 陈林武, 房建佳, 刘珊珊. 山地牧道与植被空间异质性研究评述. 草业学报, 2012, 21(1): 254-261. |
| [30] |
Han G D, Hao X Y, Zhao M L, Wang M J, Ellert B H, Willms W, Wang M J. Effect of grazing intensity on carbon and nitrogen in soil and vegetation in a meadow steppe in Inner Mongolia. Agriculture, Ecosystems & Environment, 2008, 125(1/2/3/4): 21-32. |
| [31] |
Zhan T Y, Zhang Z C, Sun J, Liu M, Zhang X B, Peng F, Tsunekawa A, Zhou H K, Gou X W, Fu S. Meta-analysis demonstrating that moderate grazing can improve the soil quality across China's grassland ecosystems. Applied Soil Ecology, 2020, 147: 103438. |
| [32] |
Moffet C A, Zartman R E, Wester D B, Sosebee R E. Surface biosolids application: effects on infiltration, erosion, and soil organic carbon in Chihuahuan desert grasslands and shrublands. Journal of Environmental Quality, 2005, 34(1): 299-311. |
| [33] |
Stavi I, Argaman E, Zaady E. Positive impact of moderate stubble grazing on soil quality and organic carbon pool in dryland wheat agro-pastoral systems. CATENA, 2016, 146: 94-99. |
| [34] |
Wang X Y, Li Y Q, Gong X W, Niu Y Y, Chen Y P, Shi X P, Li W, Liu J. Changes of soil organic carbon stocks from the 1980s to 2018 in northern China's agro-pastoral ecotone. CATENA, 2020, 194: 104722. |
| [35] |
Schneider F, Amelung W, Don A. Origin of carbon in agricultural soil profiles deduced from depth gradients of C: N ratios, carbon fractions, δ13C and δ15N values. Plant and Soil, 2021, 460(1): 123-148. |
| [36] |
Wang C, Fu B J, Zhang L, Xu Z H. Soil moisture-plant interactions: an ecohydrological review. Journal of Soils and Sediments, 2019, 19(1): 1-9. |
| [37] |
Schipanski M E, Drinkwater L E. Nitrogen fixation in annual and perennial legume-grass mixtures across a fertility gradient. Plant and Soil, 2012, 357(1/2): 147-159. |
| [38] |
Noulèkoun F, Birhane E, Kassa H, Berhe A, Gebremichael Z M, Adem N M, Syoum Y, Mengistu T, Lemma B, Hagazi N, Abrha H, Rannestad M M, Mensah S. Grazing exclosures increase soil organic carbon stock at a rate greater than "4 per 1000" per year across agricultural landscapes in Northern Ethiopia. Science of the Total Environment, 2021, 782: 146821. |
| [39] |
Zhong Z K, Zhang X Y, Wang X, Fu S Y, Wu S J, Lu X Q, Ren C J, Han X H, Yang G H. Soil bacteria and fungi respond differently to plant diversity and plant family composition during the secondary succession of abandoned farmland on the Loess Plateau, China. Plant and Soil, 2020, 448(1/2): 183-200. |
| [40] |
Furey G N, Tilman D. Plant biodiversity and the regeneration of soil fertility. Proceedings of the National Academy of Sciences, 2021, 118(49): e2111321118. |
| [41] |
侯扶江, 杨中艺. 放牧对草地的作用. 生态学报, 2006, 26(1): 244-264. |
| [42] |
Bokdam J. Effects of browsing and grazing on cyclic succession in nutrient-limited ecosystems. Journal of Vegetation Science, 2001, 12(6): 875-886. |
| [43] |
Montagner D B, Nascimento D D Jr, de Lana Sousa B M, Vilela H H, da Silveira M C T, Euclides V P B, da Silva S C, Carloto M N. Morphogenesis in guinea grass pastures under rotational grazing strategies. Revista Brasileira De Zootecnia, 2012, 41(4): 883-888. |
| [44] |
Strom S. Novel interactions between phytoplankton and microzooplankton: their influence on the coupling between growth and grazing rates in the sea. Hydrobiologia, 2002, 480(1/2/3): 41-54. |
| [45] |
周龙, 方紫妍, 李林瑜, 艾克拜尔·毛拉, 陆彪. 放牧对西天山野果林下物种多样性及土壤的影响. 中国农学通报, 2021, 37(28): 35-42. |
| [46] |
付刚, 王俊皓, 李少伟, 何萍. 藏北高寒草地牧草营养品质对放牧的响应机制. 草业学报, 2021, 30(9): 38-50. |
| [47] |
Xiao L, Liu G B, Li P, Xue S. Ecological stoichiometry of plant-soil-enzyme interactions drives secondary plant succession in the abandoned grasslands of Loess Plateau, China. CATENA, 2021, 202: 105302. |
| [48] |
孙龙, 岳阳, 胡同欣. 干扰对生态系统多功能性的影响研究进展. 生态学报, 2022, 42(15): 6066-6075. |
| [49] |
Ren H Y, Eviner V T, Gui W Y, Wilson G W T, Cobb A B, Yang G W, Zhang Y J, Hu S J, Bai Y F. Livestock grazing regulates ecosystem multifunctionality in semi-arid grassland. Functional Ecology, 2018, 32(12): 2790-2800. |
| [50] |
Zhang R Y, Wang J S, Niu S L. Toward a sustainable grazing management based on biodiversity and ecosystem multifunctionality in drylands. Current Opinion in Environmental Sustainability, 2021, 48: 36-43. |
| [51] |
Zhang R Y, Tian D S, Chen H Y H, Seabloom E W, Han G D, Wang S P, Yu G R, Li Z L, Niu S L. Biodiversity alleviates the decrease of grassland multifunctionality under grazing disturbance: A global meta-analysis. Global ecology and Biogeography, 2022, 31: 155-167. |