 2022, Vol. 42
文章信息
- 郭艳菊, 马晓静, 许爱云, 史佳梅, 刘万龙, 许冬梅
- GUO Yanju, MA Xiaojing, XU Aiyun, SHI Jiamei, LIU Wanlong, XU Dongmei
- 宁夏东部风沙区沙化草地土壤水分和植被的空间特征
- Spatial characteristics of soil moisture and vegetation in desertification grassland in eastern Ningxia sand-wind area, China
- 生态学报. 2022, 42(4): 1571-1581
- Acta Ecologica Sinica. 2022, 42(4): 1571-1581
- http://dx.doi.org/10.5846/stxb202101140146
-
文章历史
- 收稿日期: 2021-01-14
- 网络出版日期: 2021-11-04


草地生态系统是陆地生态系统的重要组分, 其能量流动、物质循环和自我修复对维系区域生态平衡、发展地区经济具有重要价值。然而, 在气候变化和人类活动的双重作用下, 干旱、半干旱地区形成了以风蚀为主要特征的土地沙化, 其发生面积、危害程度已远远超出其他类型的土地退化[1-2]。土地沙化影响土壤养分的累积与分解、团聚体的形成及植被生产力、植物群落结构, 生态系统自我修复能力减弱[3-5]。干旱、半干旱地区降雨量少、蒸散量高、土壤保水能力差, 加之难以得到地下水的补充, 导致土壤水资源缺乏[6]。而土壤水分影响土壤侵蚀、碳氮转化及植物的生长、生理生态特性和群落结构, 对沙地土壤的演化具有重要作用[7]。因此, 探究沙化草地土壤水分的分异规律, 对沙化草地生态系统的保护和修复具有重要的理论和现实意义。
土壤水分受土壤质地、成土母质、气候条件、地形地貌、土地利用方式和植被覆盖类型等因素的综合作用, 在垂直方向和水平方向表现出明显的空间变异[8-11]。降水作为干旱、半干旱区草地生态系统唯一的水分来源, 直接影响土壤水分含量及草地生产力[12]。在沙化草地生态系统中, 地形通过起伏变化改变由降水格局产生的土壤水分空间分异规律, 往往形成沙丘底部土壤水分含量最高、坡中次之、坡顶最低的空间分布格局[13]。土壤水分的空间变异影响植物的生长发育及分布规律, 而植被对土壤性状也产生反馈作用, 由植被控制的土壤水分分异是许多干旱、半干旱生态系统土壤水分变化的重要影响因素[6-7]。在沙地生态系统灌丛群落演替初期, 土壤水分的空间异质性决定灌木物种的分布格局, 至群落相对稳定的固定沙地阶段, 灌丛的分布格局一定程度上改变了土壤水分的空间分布特征, 并对土壤水分的变化做出响应[14]。此外, 在干旱沙区, 灌木通过影响灌丛下土壤水分的空间分异, 导致灌丛下草本植物的生物量呈环状分布[15]。因此, 沙化草地生态系统降水、径流等水文过程决定土壤水分的分异, 而由土壤水分变化驱动的植被格局又反馈于土壤, 引起土壤水分的再分配。
宁夏东部风沙区地处我国北方农牧交错的生态脆弱带, 为黄土高原向鄂尔多斯台地的过渡地带, 也是半干旱向干旱气候的过渡带, 在全球气候变化和人为干扰因素共同作用下, 植被生态系统稳定性较低和土壤不稳定, 生态演替往往呈现出双向性, 以往对宁夏东部风沙区沙化草地的研究主要集中在沙化草地类型的划分[16]、植物光合生理生态[17]、优势物种替代[18]及土壤养分[19-21]、微生物数量[22]和酶活性[23]等对草地沙化的响应, 针对沙化草地小尺度范围内植被和土壤的空间异质性也有一些研究[14, 24]。然而, 针对动态变化的沙化草地生态系统其植被和土壤水分在沙化演替过程中的空间变异规律及其互馈关系如何, 目前还鲜有报道。本文基于草地生态系统在宁夏东部风沙区的生态地位, 采用经典统计学和地统计学方法, 研究自潜在沙化草地至重度沙化草地土壤水分、植被盖度和物种丰富度指数的变化, 探讨宁夏东部风沙区草地沙化演替过程中土壤水分和植被的空间分异规律及其相互关系, 以期为草地沙化演变过程中生物、非生物因子的定量化测度提供依据, 对明晰草地沙化敏感区域及干旱风沙区生态环境保护和建设具有指导意义。
1 材料与方法 1.1 研究区概况研究区位于宁夏东部盐池县哈巴湖自然保护区(E107°5′45″-107°6′7″, N37°43′34″-37°44′30″), 毛乌素沙地西南缘(图 1), 地貌为缓坡丘陵, 平均海拔1501 m, 年均降水量302.38 mm, 70%以上集中在6-9月份, 年均潜在蒸发量2131.7 mm。年平均日照时数2876 h, 1月平均气温-6.76 ℃, 7月平均气温23.91 ℃, 年平均气温9.93 ℃, 年平均无霜期162 d。土壤类型主要为灰钙土、风沙土, 土壤质地为沙壤和粉沙壤。研究区地处中我国温带草原的过渡地带, 属欧亚草原区, 植被组成以黑沙蒿(Artemisia ordosica)、短花针茅(Stipa breviflora)、猪毛蒿(Artemisia scoparia)、阿尔泰狗娃花(Heteropappus altaicus)、赖草(Leymus secalinus)、糙隐子草(Cleistogenes squarrosa)等为主。

|
| 图 1 研究区地理位置 Fig. 1 Location of the study area |
于2018年7月选取哈巴湖自然保护区典型区域为研究对象, 依据《天然草地退化、沙化、盐渍化的分级指标》(GB19733-2003), 将研究区划分为潜在沙化草地、轻度沙化草地、中度沙化草地和重度沙化草地4种沙化草地类型[25]。采用样线法, 自潜在沙化草地(北)至重度沙化草地(南)设置3条平行样线, 样线长为3.6 km, 相邻两条样线之间的间隔距离为500 m, 在每条样线上每隔200 m设置样方(草本植物1 m×1 m, 灌木10 m×10 m), 共计57个, 调查植物物种组成、密度和盖度(图 2)。同时, 在每个样方, 去除地表覆盖物后, 挖掘土壤剖面, 采用多点混合法按0-10 cm、10-20 cm、20-30 cm、30-40 cm、40-50 cm、50-60 cm、60-70 cm、70-80 cm、80-90 cm和90-100 cm分层采集土壤样品, 将同一土层样品混合后带回实验室, 采用烘干法测定土壤水分(SM)。土壤样品采集保证在当地有效降雨(>5 mm降水)后的20 d左右集中进行, 以消除降水等因素对土壤水分的影响。

|
| 图 2 样方分布示意图 Fig. 2 Sketch map of quadrat in the study area |
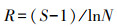
物种丰富度指数(R)采用Margalef指数, 计算公式如下:
|
式中, N为样方中全部物种的个体总数;S为样方中物种数。
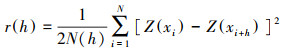
采用Excel 2010进行数据的基础处理;采用SPSS 22.0进行经典统计;采用R 4.0.2进行Pearson相关分析;利用GS+ 9.0进行土壤水分、植被盖度及物种丰富度指数的空间异质性分析。半变异函数计算公式如下:
|
式中, r(h)为半变异函数, h为两样点间空间间隔距离, N(h)为间隔距离为h时的样点对的总数, Z(xi)代表样点xi处的实测值, Z(xi+h)代表与xi间距为h时样点的实测值, 半变异函数有基台值(C0+C)、块金值(C0)、块金系数(C0/(C0+C))和变程(A0)4个重要参数。块金值(C0)表示由于测量误差及小于最小取样尺度引起的随机变异, 其值越大表明较小尺度上的某些过程越不能忽视;基台值(C0+C)反映系统内总的变异, 包括结构性变异和随机性变异两部分。块金系数(C0/(C0+C))表示随机部分引起的变异占总变异的比例, C0/(C0+C) 小于25%表明在空间上呈强烈的相关性, 主要受结构性因素的影响;介于25%和75%之间, 表明在空间上呈中等相关性;大于75%时, 在空间上呈弱相关性, 主要受随机性因素的影响。变程A0也称空间相关范围, 能够准确反映区域化变量自相关范围的大小[26]。
利用普通克里格(Ordinary Kriging)法进行空间插值估计, 并进行交叉实证检验。依据克里格插值结果, 绘制土壤水分及植被盖度、物种丰富度的空间分布图。
2 结果 2.1 沙化草地土壤水分、植被盖度及物种丰富度指数的描述性统计分析自潜在沙化草地至重度沙化草地, 0-100 cm土层土壤水分含量分布范围为0.82%-28.22%, 其中以70-100 cm深层土壤变异较大, 极大值和极小值的差值范围为22.82%-25.58%;随剖面深度的增加, 土壤水分含量总体呈先升高后降低的趋势, 以70-80 cm和80-90 cm土层最高。植被盖度和物种丰富度指数的变化范围分别为41.00%-93.00%和0.82-2.80(图 3, 表 1)。描述性统计分析结果表明, 0-100 cm各土层土壤水分的变异系数介于0.36-0.48, 植被盖度和物种丰富度指数的变异系数分别为0.20和0.26, 均属于中等变异。各土层土壤水分、植被盖度及物种丰富度指数的偏度均为正值, 表明数据在右侧分散。土壤水分的峰度介于-0.67-3.30, 表明数据分布较为陡峭, 存在极值;植被盖度及物种丰富度指数的峰度均为负值, 数据分布的峰都低于标准正态。采用Kolmogorov-Smirnov(K-S) 法检验, 将K-S值小于0.05的数据进行了自然对数转换, 转换后的数据均符合正态分布(P>0.05)。

|
| 图 3 宁夏东部风沙区沙化草地0-100 cm土层土壤水分、植被盖度及物种丰富度指数的分布 Fig. 3 Distribution of soil moisture at 0-100 cm soil layer, vegetation coverage and Margalef richness index in sandy desertified grassland in eastern Ningxia wind-sand area |
| 指标 Items |
土层 Soil layer/cm |
平均数 Mean |
中位数 Median |
极小值 Minimum |
极大值 Maximum |
标准差 Kurtosis |
变异系数 Coefficient of variation |
偏度 Skew |
峰度 Kurtosis |
K-S值 K-S value |
| 土壤水分 | 0-10 | 3.26 | 3.3 | 0.82 | 6.95 | 1.38 | 0.42 | 0.31 | 0.23 | 0.200 |
| Soil moisture/% | 10-20 | 5.62 | 5.13 | 2.53 | 11.40 | 2.04 | 0.36 | 1.31 | 1.47 | 0.000 |
| 20-30 | 7.13 | 6.36 | 2.44 | 16.52 | 2.74 | 0.38 | 1.43 | 2.51 | 0.001 | |
| 30-40 | 8.11 | 7.50 | 2.56 | 16.03 | 2.88 | 0.36 | 1.00 | 1.21 | 0.002 | |
| 40-50 | 9.06 | 8.35 | 2.81 | 18.19 | 3.47 | 0.38 | 0.77 | 0.26 | 0.000 | |
| 50-60 | 9.83 | 8.75 | 3.34 | 17.40 | 3.81 | 0.39 | 0.46 | -0.65 | 0.002 | |
| 60-70 | 10.68 | 10.12 | 2.56 | 19.04 | 4.18 | 0.39 | 0.36 | -0.67 | 0.082 | |
| 70-80 | 11.47 | 10.86 | 2.64 | 28.22 | 5.04 | 0.44 | 0.98 | 1.77 | 0.200 | |
| 80-90 | 11.79 | 11.12 | 2.62 | 27.93 | 5.69 | 0.48 | 0.78 | 0.32 | 0.200 | |
| 90-100 | 9.28 | 8.12 | 2.32 | 25.14 | 4.12 | 0.44 | 1.43 | 3.30 | 0.003 | |
| 植被盖度 Vegetation coverage/% |
61.37 | 61.00 | 41.00 | 93.00 | 12.10 | 0.20 | 0.45 | -0.19 | 0.200 | |
| 物种丰富度指数 Margalef richness index |
1.81 | 1.81 | 0.82 | 2.80 | 0.47 | 0.26 | 0.13 | -0.50 | 0.200 |
半变异函数模型最优拟合表明, 0-10 cm土层土壤水分和物种丰富度指数的最优模型分别为球状模型和指数模型, 10-100 cm各土层土壤水分和植被盖度的最优模型均为高斯模型(图 4), 决定系数为0.593-0.941, 且残差较小, 曲线拟合效果较好。各土层土壤水分和物种丰富度指数的块金系数为26.31%-41.86%, 介于25%-75%之间, 表现为中等的空间自相关性。植被盖度的块金系数为2.50%, 小于25%, 表现出强烈的空间自相关性。各土层土壤水分、植被盖度及物种丰富度指数的自相关范围较大, 变程为1453-8110 m (表 2)。0-10 cm表层土壤水分的块金值、变程及块金系数均较高, 随土层的加深, 土壤水分的块金值呈波动性下降趋势, 基台值则无明显变化规律。

|
| 图 4 宁夏东部风沙区沙化草地0-100 cm土层土壤水分、植被盖度及物种丰富度指数的半变异函数r(h)-h散点图 Fig. 4 r(h)-h scatter diagram of semi-variation function of soil moisture at 0-100 cm soil layer, vegetation coverage and Margalef richness index in sandy desertified grassland in eastern Ningxia wind-sand area SM: 土壤水分Soil moisture |
| 指标 Items |
土层 Soil layer/cm |
模型 Best model |
块金值 Nugget C0 |
基台值 Sill |
变程 Range A0/m |
块金系数 C0/(C0+C)/% |
决定系数 Coefficient of determination |
残差平方和 Residual sum of squares |
| 土壤水分Soil moisture/% | 0-10 | 球状 | 0.178 | 0.430 | 7746 | 41.86 | 0.625 | 2.06×10⁻² |
| 10-20 | 高斯 | 0.075 | 0.285 | 3749 | 26.31 | 0.842 | 4.82×10⁻³ | |
| 20-30 | 高斯 | 0.082 | 0.218 | 2371 | 37.61 | 0.723 | 1.04×10⁻² | |
| 30-40 | 高斯 | 0.067 | 0.184 | 1658 | 36.41 | 0.600 | 1.68×10⁻² | |
| 40-50 | 高斯 | 0.086 | 0.246 | 1855 | 34.95 | 0.629 | 2.77×10⁻² | |
| 50-60 | 高斯 | 0.105 | 0.266 | 2000 | 39.47 | 0.728 | 1.69×10⁻² | |
| 60-70 | 高斯 | 0.106 | 0.316 | 2092 | 33.54 | 0.798 | 1.85×10⁻² | |
| 70-80 | 高斯 | 0.119 | 0.316 | 1670 | 37.65 | 0.636 | 4.14×10⁻² | |
| 80-90 | 高斯 | 0.130 | 0.437 | 1862 | 29.74 | 0.737 | 6.07×10⁻² | |
| 90-100 | 高斯 | 0.076 | 0.283 | 1453 | 26.86 | 0.660 | 4.17×10⁻² | |
| 植被盖度 Vegetation coverage/% |
高斯 | 0.014 | 0.560 | 7771 | 2.50 | 0.941 | 1.02×10⁻³ | |
| 物种丰富度指数 Margalef richness index |
指数 | 0.061 | 0.165 | 8110 | 36.97 | 0.593 | 1.20×10⁻³ |
采用普通Kriging法对草地土壤水分、植被盖度及物种丰富度指数进行插值绘图(图 5)。可以看出, 自潜在沙化草地至重度沙化草地, 0-100 cm各土层土壤水分含量和植被盖度的空间插值图呈条带状和斑块状的梯度变化, 物种丰富度指数的空间插值图则呈较为明显的斑块分布;自潜在沙化草地至重度沙化草地, 土壤水分含量、植被盖度及物种丰富度指数总体表现为逐渐降低的趋势, 且各土层土壤水分西部比东部变化较为平缓。随土层加深, 土壤水分的高值区和低值区呈先升高后降低, 高值区由东向西北方和低值区由南向北变化。从土壤水分含量的分异看, 0-10 cm土层土壤水分克里格插值图以斑块状居多, 最高值出现在东侧, 等值线弯曲, 有明显的“高地”和“低谷”, 空间变异程度较高;其余土层土壤水分等值线较平直, 过渡较为平滑, 20-60 cm土层土壤水分总体表现为东北高西南低。

|
| 图 5 宁夏东部风沙区沙化草地0-100 cm土层土壤水分、植被盖度及物种丰富度指数的克里格插值图 Fig. 5 Spatial pattern of soil moisture at 0- 1 00 cm soil layer, vegetation coverage and Margalef richness index in sandy desertified grassland in eastern Ningxia wind-sand area |
相关分析表明(图 6), 宁夏东部风沙区沙化草地植被盖度与0-40 cm各土层土壤水分含量呈显著正相关(P < 0.05), 与40-100 cm各土层土壤水分含量呈极显著正相关(P < 0.01), 相关系数为0.26-0.55;与物种丰富度指数相关不显著(P>0.05)。物种丰富度指数与0-50 cm各土层土壤水分含量呈显著正相关(P < 0.05)。除0-10 cm土层与60-70 cm、70-80 cm土层, 10-20 cm土层与70-80 cm土层之间土壤水分含量相关不显著外(P>0.05), 其余各土层之间土水分含量均呈显著或极显著正相关(P < 0.05或P < 0.01), 且相邻土层之间土壤水分含量相关系数较高。

|
| 图 6 宁夏东部风沙区沙化草地0-100 cm各土层土壤水分、植被盖度及物种丰富度指数的相关分析 Fig. 6 Effects of vegetation coverage and Margalef richness index on soil moisture at 0-100 cm soil layer in sandy desertified grassland in eastern Ningxia wind-sand area *显著相关(P < 0.05), **极显著相关(P < 0.01) |
土地沙化对区域生态、水文和农业等均造成严重危害, 一直是生态环境治理的重点问题之一[27]。水分是干旱半干旱地区草地植物生长的重要制约因素[28]。宁夏东部风沙区沙化草地0-100 cm各土层土壤水分含量总体处于较低水平。这是由于当地降水少且变率大, 加之土质疏松, 强烈的风蚀加速土壤蒸发, 土壤保水能力较差[10, 29]。植被盖度自潜在沙化草地至重度沙化草地逐渐降低。在草地沙化过程中, 伴随着土壤细颗粒的吹蚀, 土壤结构变得更为松散, 土壤养分损失, 保水能力减弱, 限制了植物的生长和发育, 植被发生逆向演替, 群落向着更为耐旱耐贫瘠的方向演替, 植被盖度、密度及生物量等降低[30-32]。随草地沙化程度的加重, 植被盖度、物种丰富度指数及各土层土壤含水量总体呈下降趋势, 与以往的研究结果一致[32-33]。
植被及其生存的立地环境在任何尺度上都是时空连续的变异体, 具有一定的空间特征[34]。宁夏东部风沙区沙化草地0-100 cm各土层土壤水分含量的空间变异性表现为中等变异, 与以往研究得出的结果相似[6, 10, 30]。随土层的加深, 土壤水分含量呈先升高后降低的趋势, 以60-90 cm各土层较高, 且表层土壤水分含量的变异系数较大, 可能是研究区地处毛乌素沙地南缘, 强烈的蒸发、风蚀及水分入渗作用导致表层土壤水分含量较低, 并使得空间异质性增加[35]。随土层深度的增加, 影响土壤水分运移的作用力发生改变, 土壤水分含量增加[36]。
空间异质性是随机性因素和结构性因素共同作用的结果, 块金系数(C0/C0+C)可表明随机因素引起的空间变异占总变异的比例。宁夏东部风沙区沙化草地物种丰富度指数及各土层土壤水分含量的块金系数为26.31%-41.86%, 表现为中等的空间自相关性, 表明由地形地貌、成土母质及植被等自然要素引起的结构性因素和人类干扰等要素引起的随机因素在其空间总变异中均发挥作用[26]。表层土壤水分较其他土层的块金系数大, 强烈的风蚀通过影响水分循环及植被覆盖对降雨和表层地下水的截留作用导致表层水分含量的变化更趋于不稳定[37]。植被盖度的块金系数为2.50%, 小于25%, 表现出强烈的空间自相关性。植物是土壤中有机质及各种营养元素的主要来源, 同时, 土壤作为植物生长最重要的环境因子, 为植物的生长提供机械支持和物质基础[34]。植被盖度、物种丰富度指数及各土层土壤水分含量的变程为1453-8110 m, 说明其生态学过程在较大的尺度上发挥作用, 连续性较好。
宁夏东部风沙区沙化草地各土层土壤水分和植被盖度的空间插值图呈条带状和斑块状的梯度变化。任何生态系统的发展都具有双向性, 在自然因素和人为因素的共同作用下, 可能发生正向或逆向演替, 研究区由于生境的脆弱、敏感性, 在内外因素的扰动下更趋不稳定, 因此植被盖度和不同土层土壤水分含量自潜在沙化草地至重度沙化草地逐渐降低的条带状梯度变化过程中出现了局部升高的斑块格局。物种丰富度指数则呈现较为明显的斑块格局, 高值区出现在潜在沙化草地至轻度沙化草地、轻度沙化草地至中度沙化草地之间的过渡区域, 体现了不同生态类型过渡和转换过程中的边缘效应;同时, 也表明草地沙化演替过程中, 植被物种发生替代, 一些抗风蚀、耐沙埋的灌木、半灌木逐步占据优势地位[38-40]。土壤水分的空间分布受地形、土壤结构、质地及局部微气候等环境因子的直接影响, 同时, 由于植物与土壤之间的互馈作用, 植物个体发育、种群及群落结构等生物因子也对土壤水分产生影响[34, 41]。伴随着草地的沙化, 由风蚀作用产生的土壤粗粒化导致土壤质地变差、结构更为松散, 加之流沙堆积, 局地微地形发生变化, 引起土壤水分的再分配[29]。其次, 自潜在沙化草地至重度沙化草地, 群落发生逆向演替, 结构趋于简单, 优势物种更替, 群落盖度、密度及生物量等的变化导致土壤养分输入、微生物活动、水分蒸发蒸腾作用及土壤水分的运移过程发生改变[33]。此外, 沙化草地生态系统中灌木、半灌木的出现, 致使灌丛周围在风蚀作用下形成土壤水分、养分等的富集, 呈现明显的“沃岛效应”, 进而引起土壤水分的分异[42-43]。
4 结论宁夏东部风沙区沙化草地土壤水分含量总体处于较低水平, 在0-100 cm土层内随剖面深度的增加呈先上升后下降的趋势, 以70-90 cm土层最高。各土层土壤水分含量、植被盖度及物种丰富度指数均属于中等变异, 受地形地貌、土壤母质等结构性因素和人类扰动等随机性因素的共同作用, 其空间分布呈现出条带状和斑块状的梯度变化格局, 且连续性较好, 自潜在沙化草地至重度沙化草地, 总体表现为逐渐降低的趋势。基于各参数的空间分布格局, 在草地沙化演替过程中不同沙化草地类型之间的过渡和转换区是土壤水分和植被变化的敏感区域, 应作为草地沙化防治的关键区域加强管理。
致谢: 试验过程中得到宁夏盐池县科技局及彭文栋、赵永升、李永康等的大力支持和帮助。| [1] |
Zou X Y, Li J F, Cheng H, Wang J P, Zhang C L, Kang L Q, Liu W, Zhang F. Spatial variation of topsoil features in soil wind erosion areas of northern China. Catena, 2018, 167: 429-439. DOI:10.1016/j.catena.2018.05.022 |
| [2] |
Zhang H Y, Fan J W, Cao W, Warwick H, Li Y Z, Chi W F, Wang S Z. Response of wind erosion dynamics to climate change and human activity in Inner Mongolia, China during 1990 to 2015. Science of the Total Environment, 2018, 639: 1038-1050. DOI:10.1016/j.scitotenv.2018.05.082 |
| [3] |
黎明扬, 刘廷玺, 罗艳云, 段利民, 张俊怡, 周亚军, Buren S. 半干旱草原型流域表层土壤饱和导水率传递函数及遥感反演研究. 土壤学报, 2019, 56(1): 90-100. |
| [4] |
Zhang N N, Sun G, Zhong B, Wang E T, Zhao C Z, Wang Y J, Chen W, Wu N. Impacts of wise grazing on physicochemical and biological features of soil in a sandy grassland on the Tibetan Plateau. Land Degradation & Development, 2019, 30(7): 719-729. |
| [5] |
Fu C F, Bian Z H, Xi J J, Zhao J B. Spatial distribution characteristics of soil moisture in different types of sand dune in the Mu Us Sandy Land, adjacent to north of Chinese Loess Plateau. Environmental Earth Sciences, 2018, 77(4): 151. DOI:10.1007/s12665-018-7307-8 |
| [6] |
郭欣欣, 付强, 卢贺, 高凤杰, 杭艳红. 东北黑土区农林混合利用坡面土壤水分空间异质性及主控因素. 农业工程学报, 2018, 34(19): 123-130. DOI:10.11975/j.issn.1002-6819.2018.19.016 |
| [7] |
del Jesus M, Rinaldo A, Rodríguez-Iturbe I. Point rainfall statistics for ecohydrological analyses derived from satellite integrated rainfall measurements. Water Resources Research, 2015, 51(4): 2974-2985. DOI:10.1002/2015WR016935 |
| [8] |
Zhao B H, Liu Z B, Li P, Xu G C, Gao H D, Cheng Y T, Chang E H, Yuan S L, Zhang Y, Feng Z H. Spatial distribution of soil organic carbon and its influencing factors under the condition of ecological construction in a hilly-gully watershed of the Loess Plateau, China. Geoderma, 2017, 296: 10-17. DOI:10.1016/j.geoderma.2017.02.010 |
| [9] |
Cho E, Choi M. Regional scale spatio-temporal variability of soil moisture and its relationship with meteorological factors over the Korean peninsula. Journal of Hydrology, 2014, 516: 317-329. DOI:10.1016/j.jhydrol.2013.12.053 |
| [10] |
张璐, 朱仲元, 张圣微, 王慧敏. 半干旱草原型流域土壤水分变异及其影响因素分析. 农业工程学报, 2020, 36(13): 124-132. DOI:10.11975/j.issn.1002-6819.2020.13.015 |
| [11] |
Penna D, Borga M, Norbiato D, Fontana G D. Hillslope scale soil moisture variability in a steep alpine terrain. Journal of Hydrology, 2009, 364(3/4): 311-327. |
| [12] |
唐庄生, 安慧, 邓蕾, 上官周平. 荒漠草原沙漠化植物群落及土壤物理变化. 生态学报, 2016, 36(4): 991-1000. |
| [13] |
李军, 王新军, 贾宏涛, 赵成义. 古尔班通古特沙漠南缘干季土壤水分含量空间异质性. 中国沙漠, 2016, 36(6): 1628-1636. |
| [14] |
朱林峰, 张宇清, 秦树高, 关红杰, 张举涛, 高浩, 杨路明, 高宏仙. 油蒿群落不同恢复阶段的土壤水分空间异质性及植被特征. 水土保持通报, 2015, 35(6): 58-63. |
| [15] |
Li J, Zhao C Y, Song Y J, Sheng Y, Zhu H. Spatial patterns of desert annuals in relation to shrub effects on soil moisture. Journal of Vegetation Science, 2010, 21(2): 221-232. DOI:10.1111/j.1654-1103.2009.01135.x |
| [16] |
李侠, 李潮, 李淑英, 许冬梅, 谢应忠. 盐池县草地不同沙化阶段植物群落特征. 农业科学研究, 2013, 34(3): 22-26. DOI:10.3969/j.issn.1673-0747.2013.03.006 |
| [17] |
An H, Tang Z S, Keesstra S, Shangguan Z P. Impact of desertification on soil and plant nutrient stoichiometry in a desert grassland. Scientific Reports, 2019, 9(1): 9422. DOI:10.1038/s41598-019-45927-0 |
| [18] |
贾希洋, 马红彬, 周瑶, 张蕊, 宿婷婷, 张双乔, 张俊. 不同生态恢复措施下宁夏黄土丘陵区典型草原植物群落数量分类和演替. 草业学报, 2018, 27(2): 15-25. |
| [19] |
An H, Li Q L, Yan X, Wu X Y, Liu R T, Fang Y. Desertification control on soil inorganic and organic carbon accumulation in the topsoil of desert grassland in Ningxia, northwest China. Ecological Engineering, 2019, 127: 348-355. DOI:10.1016/j.ecoleng.2018.12.014 |
| [20] |
Qiu K Y, Xie Y Z, Xu D M, Pott R. Ecosystem functions including soil organic carbon, total nitrogen and available potassium are crucial for vegetation recovery. Scientific Reports, 2018, 8: 7607. DOI:10.1038/s41598-018-25875-x |
| [21] |
赵占辉, 张丛志, 刘昌华, 蔡太义, 张佳宝. 河南封丘县域农田土壤固碳速率空间变异特征及其影响因素. 应用生态学报, 2016, 27(5): 1479-1488. |
| [22] |
许冬梅, 王堃. 毛乌素沙地南缘生态过渡带土壤微生物特征. 中国沙漠, 2007, 27(5): 805-808. |
| [23] |
陈丽佳, 谢应忠, 许冬梅. 盐池县沙化草地土壤理化性质及酶活性研究. 安徽农业科学, 2015, 43(17): 109-111. DOI:10.3969/j.issn.0517-6611.2015.17.039 |
| [24] |
邱开阳, 谢应忠, 许冬梅, 时项锋, 齐拓野, 刘丽丹, 王东清. 毛乌素沙地南缘沙漠化临界区域土壤水分和植被空间格局. 生态学报, 2011, 31(10): 2697-2707. |
| [25] |
马晓静, 郭艳菊, 张嘉玉, 许爱云, 刘金龙, 许冬梅. 宁夏盐池县沙化草地土壤团聚体分异特征. 草业学报, 2020, 29(3): 27-37. |
| [26] |
王华, 陈莉, 宋敏, 宋同清, 曾馥平, 彭晚霞, 杜虎, 苏樑. 喀斯特常绿落叶阔叶混交林土壤磷钾养分空间异质性. 生态学报, 2017, 37(24): 8285-8293. |
| [27] |
颜亮, 周广胜, 张峰, 隋兴华, 平晓燕. 内蒙古荒漠草原植被盖度的空间异质性动态分析. 生态学报, 2012, 32(13): 4017-4024. |
| [28] |
赵亚楠, 周玉蓉, 王红梅. 宁夏东部荒漠草原灌丛引入下土壤水分空间异质性. 应用生态学报, 2018, 29(11): 3577-3586. |
| [29] |
Zuo X A, Zhao H L, Zhao X Y, Guo Y R, Yun J Y, Wang S K, Miyasaka T. Vegetation pattern variation, soil degradation and their relationship along a grassland desertification gradient in Horqin Sandy Land, northern China. Environmental Geology, 2009, 58(6): 1227-1237. DOI:10.1007/s00254-008-1617-1 |
| [30] |
Na R S, Du H B, Na L, Shan Y, He H S, Wu Z F, Zong S W, Yang Y, Huang L R. Spatiotemporal changes in the Aeolian desertification of Hulunbuir Grassland and its driving factors in China during 1980-2015. Catena, 2019, 182: 104123. DOI:10.1016/j.catena.2019.104123 |
| [31] |
Li Y Q, Zhao X Y, Wang S K, Zhang F X, Lian J, Huang W D, Mao W. Carbon accumulation in the bulk soil and different soil fractions during the rehabilitation of desertified grassland in Horqin Sandy Land (northern China). Polish Journal of Ecology, 2015, 63(1): 88-101. DOI:10.3161/15052249PJE2015.63.1.008 |
| [32] |
Legates D R, Mahmood R, Levia D F, DeLiberty T L, Quiring S M, Houser C, Nelson F E. Soil moisture: a central and unifying theme in physical geography. Progress in Physical Geography, 2011, 35(1): 65-86. DOI:10.1177/0309133310386514 |
| [33] |
Hu Y F, Jiang S L, Yuan S, Deng L J, Xiao H H, Shu X Y, Chen G D, Xia J G. Changes in soil organic carbon and its active fractions in different desertification stages of alpine-cold grassland in the eastern Qinghai-Tibet Plateau. Environmental Earth Sciences, 2017, 76(9): 348. DOI:10.1007/s12665-017-6684-8 |
| [34] |
张凯. 水蚀风蚀交错带小流域土壤性质和植被特征的空间分布及其驱动因素[D]. 杨凌: 中国科学院大学(中国科学院教育部水土保持与生态环境研究中心), 2019.
|
| [35] |
阿拉木萨, 周丽芳. 科尔沁沙地流动沙丘土壤水分空间变化特征分析. 土壤, 2011, 43(3): 392-397. |
| [36] |
方楷, 宋乃平, 魏乐, 安慧. 荒漠草原不同地形条件下土壤水分和地上生物量的时空分异. 干旱区研究, 2012, 29(4): 641-647. |
| [37] |
冯博, 贾小旭, 于冬雪, 赵春雷, 贾玉华. 黄土高原北部草地土壤水分空间变异研究. 土壤通报, 2019, 50(5): 1123-1130. |
| [38] |
Zuo X A, Zhao X Y, Wang S K, Li Y Q, Lian J, Zhou X. Influence of dune stabilization on relationship between plant diversity and productivity in Horqin Sand Land, Northern China. Environmental Earth Sciences, 2012, 67(5): 1547-1556. DOI:10.1007/s12665-012-1950-2 |
| [39] |
Parra-Tabla V, Albor-Pinto C, Tun-Garrido J, Angulo-Pérez D, Barajas C, Silveira R, Ortíz-Díaz J J, Arceo-Gómez G. Spatial patterns of species diversity in sand dune plant communities in Yucatan, Mexico: importance of invasive species for species dominance patterns. Plant Ecology & Diversity, 2018, 11(2): 157-172. |
| [40] |
张继义, 赵哈林, 张铜会, 赵学勇. 科尔沁沙地植被恢复系列上群落演替与物种多样性的恢复动态. 植物生态学报, 2004, 28(1): 86-92. DOI:10.3321/j.issn:1005-264X.2004.01.013 |
| [41] |
王甜, 康峰峰, 韩海荣, 程小琴, 白英辰, 马俊勇, 桂志宏. 山西太岳山小流域土壤水分空间异质性及其影响因子. 生态学报, 2017, 37(11): 3902-3911. |
| [42] |
许冬梅, 赵丽莉, 谢应忠. 盐池县草地沙漠化过程中植物群落的动态变化. 西北植物学报, 2011, 31(10): 2084-2089. |
| [43] |
Yan Y C, Xu D W, Xu X L, Wang D L, Wang X, Cai Y R, Chen J Q, Xin X P, Eldridge D J. Shrub patches capture tumble plants: potential evidence for a self-reinforcing pattern in a semiarid shrub encroached grassland. Plant Soil, 2019, 442(1/2): 311-321. |