 2022, Vol. 42
文章信息
- 魏雪, 李雨, 吴鹏飞
- WEI Xue, LI Yu, WU Pengfei
- 青藏高原不同牧草人工草地对土壤线虫群落的影响
- Effects of artificial grasslands with different forage species on soil nematode communities on the Qinghai-Tibetan Plateau
- 生态学报. 2022, 42(3): 1071-1087
- Acta Ecologica Sinica. 2022, 42(3): 1071-1087
- http://dx.doi.org/10.5846/stxb202101150166
-
文章历史
- 收稿日期: 2021-01-15
- 网络出版日期: 2021-10-11


青藏高原作为“世界第三极”, 是生物多样性热点区域以及重要的生态安全屏障区[1]。其天然草地面积约占全国草地面积的三分之一, 是我国重要的草牧业生产基地[2]。然而, 青藏高原地处生态脆弱区, 近几十年来受气候变化和过度放牧等的共同影响[3], 高寒草地生态系统退化严重, 导致畜牧生产和生物避难所等重要生态系统服务功能下降[4]。近年来, 国家采取了施肥、补种、禁牧围封和建植人工草地等措施对退化草地进行恢复, 其中建植人工草地最为有效[5]。建植人工草地也是解决草畜矛盾的主要途径[6]。因此人工草地, 尤其是单播人工草地在该区得到快速发展[7]。
土壤线虫数量巨大, 占全部多细胞生物数量的80%[8];其物种丰富、分布广泛, 在有机质分解和养分循环方面发挥关键作用[9-10], 是草地生态系统的重要组成部分。土壤线虫食性多样, 主要有植食性、食真菌、食细菌、捕食性和杂食性等, 在土壤食物网中占有重要地位[11]。其次, 线虫身体透明, 内部构造清晰, 易于鉴定。同时, 线虫世代周期较短, 迁移能力弱, 对环境变化敏感, 因此被广泛用作反映生态系统受干扰程度和土壤健康水平的指示生物[12]。
前期研究表明, 青藏高原天然草地向人工草地转变, 显著改变了植物群落组成[7]和土壤碳、氮储量[5, 13]。植物作为土壤食物网的主要生产者和资源提供者, 极大地影响着土壤线虫群落及其生态功能[14-15]。已有研究表明不同植物下的植食性线虫(针属Paratylenchus)密度差异显著[16], 甚至某些植食性线虫只有在特定植物存在时数量才会增加[17-19]。不同物种植物的根系分泌物[20]、根际土壤理化性质[21]和微生物群落[22]存在差异, 可间接影响食微线虫[23-24]。植物功能群也会对土壤线虫群落产生影响, 已有研究表明豆科植物对食细菌线虫有利, 而杂类草对食真菌线虫有利[25-26]。Ye等[27]研究发现, 与禾本科相比, 豆科单作和禾本科-豆科混作增加了植食性、食细菌和食真菌线虫的密度。此外, 植物群落多样性也可影响土壤线虫群落多样性。有研究表明线虫的多样性随着植物多样性的增加而增加[28], 但也有研究发现某些植食性线虫在单一植物栽培中的数量比多种植物混合栽培中更多[24, 27]。前期研究发现青藏高原天然草地转变为燕麦人工草地后改变了线虫群落结构, 增加了线虫密度以及食细菌和食真菌线虫的比例[29], 然而不同人工草地土壤线虫群落组成及多样性的差异尚不明确。
在青藏高原地区选取广泛建植的6种牧草单播人工草地, 通过调查不同人工草地和天然草地的土壤线虫群落, 研究天然草地转变为人工草地对土壤线虫群落的影响以及不同人工草地土壤线虫群落多样性差异。研究结果不仅有助于揭示建植人工草地对高寒草甸地下食物网结构和功能的影响, 还可促进生态环境的保护以及民族地区畜牧业的可持续发展。
1 材料与方法 1.1 研究区概况研究区位于青藏高原东缘阿坝藏族羌族自治州红原县境内(31°50′—33°22′N, 101°51′—103°23′E), 平均海拔3500 m。该地是典型的高原大陆性气候, 霜冻期极长, 无绝对无霜期, 春秋短促, 冬季寒冷, 雨热同季。日照时间长, 年均达2389 h, 年均蒸发量为1232 mm。年均气温0.9 ℃;最热月为7月, 月均气温为10.9 ℃;最冷月为1月, 月均气温为-10.3 ℃。降水量年际间波动大, 年均降水量约为680 mm, 80%集中在生长季阶段。植被类型主要为亚高山草甸, 盖度为70%—90%, 优势种为高山嵩草(Kobresia pygmaea C. B. Clarke)和四川嵩草(K. setschwanensis Hand.-Mazz.), 常见类群有高山紫菀(Aster alpinus L.)、蕨麻(Potentilla anserina L.)、草玉梅(Anemone rivularis Buch.-Ham.)、垂穗披碱草(Elymus nutans Griseb.)、老芒麦(E. sibiricus L.)和紫羊茅(Festuca rubra L.)等为主。
1.2 样地设置本研究在西南民族大学青藏高原生态保护与畜牧业高科技研究示范基地(32°48′N, 102°33′E)2013年建植的种质资源圃内进行。2016年7月, 选取垂穗披碱草(E. nutans, EN)、老芒麦(E. sibiricus, ES)、早熟禾(Poa annua L., PA)、羊茅(F. ovina L., FO)等多年生禾本科牧草和连续播种的一年生禾本科牧草燕麦(Avena sativa L., AS)以及多年生豆科牧草紫花苜蓿(Medicago sativa L., MS)6种单播人工草地作为研究对象[30]。每种牧草人工草地2块样地, 面积为2 m × 4 m[30]。同时, 在资源圃外围两侧另选2块2 m × 4 m的天然草地(Natural grassland, NG)作为对照[30]。在每块样地内按对角线法设置3个50 cm × 50 cm的样方。本研究共7种处理, 每种处理6个重复。
天然草地的植物优势种为垂穗披碱草、平车前(Plantago depressa Willd.)、早熟禾和珠芽蓼(Polygonum viviparum L.), 盖度为75%—90%。各人工草地的施肥、除杂和收割等田间管理措施相同。人工草地均采取春季苗期施肥, 施肥标准为含氮量35%的硝酸铵(NH4NO3)33 g/m2和含P2O5 14%的过磷酸钙磷(Ca(H2PO4)2·H2O) 40 g/m2;每年播种期、苗期对人工草地进行人工除杂。每年9月对人工草地和天然草地进行牧草刈割, 留茬4 cm左右。
1.3 土壤样品采集和线虫分离及鉴定在每个样方内用土钻采集3个0—15 cm的土样作为一个复合样, 混合均匀带回室内。称取50 g鲜土, 采用湿漏斗(Baermann)法分离土壤线虫, 连续分离48 h。分离到的线虫保存于4%的福尔马林溶液中。根据《中国土壤动物检索图鉴》[31]和《De Nematoden van Nederland》[32]等, 在正置显微镜(Olympus CX31)下对土壤线虫进行计数和鉴定。每个样品随机选取100条线虫进行鉴定, 不足100条的全部鉴定, 一般鉴定到属。根据土壤含水量, 将土壤线虫密度换算成每100 g干土中的个数。并根据食性将线虫分为植食性、食真菌、食细菌和杂食-捕食性等4个营养类群[33-34]。
1.4 土壤理化性质分析土壤含水量(WC)采用烘干法测定;土壤有机碳(SOC)含量采用硫酸-重铬酸钾氧化外加热法进行测定;全氮(TN)含量采用半微量开式定氮法测定;有效氮(AN)含量采用碱解扩散法测定;全磷(TP)含量采用高氯酸-硫酸-钼锑抗比色法测定;有效磷(AP)含量采用碳酸氢钠浸提-钼锑抗比色法测定;全钾(TK)含量采用氢氟酸-高氯酸消煮火焰光度计法测定;有效钾(AK)含量采用中性乙酸铵提取-火焰光度计法测定;土壤pH采用电位法测定[35]。
1.5 数据分析根据线虫各类群的密度占总密度的比例来划分数量等级, 10%以上的为优势类群, 1%—10%的为常见类群, 1%以下的为稀有类群。
在属的水平上, 计算土壤线虫类群数;并计算Shannon多样性指数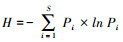

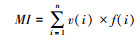
自由生活线虫成熟度指数MI(Maturity index)[36]:
|
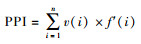
植物寄生线虫成熟度指数PPI(Plant parasite index)[36]:
|
式中v(i)为第i类线虫的c-p值, f(i)为第i类占总数的比例, f′(i)为第i类植物寄生线虫占总数的比例。
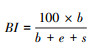
基础指数BI(Basal index)[11]:
|
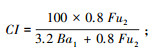
通道指数CI(Channel index)[11]:
|
富集指数EI(Enrichment index)[11]:

|
结构指数SI(Structure index)[11]:

|
式中, b=∑kb×nb, e=∑ke×ne, s=∑ks×ns。b为基础组分, 包含Ba2(食细菌线虫中的c-p2类群)和Fu2(食真菌线虫中的c-p2类群);e为富集组分, 包含Ba1(食细菌线虫中的c-p1类群)和Fu2;s为结构组分, 包含Ba3-Ba5、Fu3-Fu5、Om3-Om5和P2-P5(c-p值范围为3—5的食细菌、食真菌和杂食性线虫以及c-p值范围为2—5的捕食性线虫)。kb、ke和ks为各类群所对应的权重值(值为0.8—5.0之间), nb、ne和ns为各类群的相对密度。BI指示土壤食物网的抵抗力, 值越大, 相对抵抗力越大;CI指示土壤食物网中占优势的分解通道, 值大于50表明以真菌分解通道为主, 值小于50表明以细菌分解通道为主;EI指示外界养分投入状况, 值越大, 外界养分投入越多;SI指示食物链的长度及食物网的连通性, 值越大, 食物链越长, 连通性越高[11, 37]。EI与SI联合使用, 以SI为横坐标, EI为纵坐标, 可以将线虫区系划分为A、B、C和D 4个象限, 分别代表了食物网不同的特征[11]。
采用car软件包的qqplot函数对数据进行正态性检验, 以及用Bartlett检验进行方差齐性检验。对于不符合正态分布的数据采用car包的powerTransform函数进行Box-Cox正态变换。为研究不同牧草人工草地对土壤线虫群落密度、类群数、各营养类群密度和生态指数以及土壤理化性质等参数的影响, 对符合假设检验的参数采用单因素方差分析(One-way ANOVA)进行分析, 不符合的则直接进行非参数Kruskal-Wallis检验。方差分析用aov函数进行, 对差异显著的数据采用multcomp包的glht函数进行多重比较。Kruskal-Wallis检验用kruskal.test函数进行, 对差异显著的数据采用FSA包的dunnTest函数进行多重比较。
采用去趋势对应分析(Detrended correspondence analysis, DCA)对样方及群落进行排序, 第一排序轴长度小于3, 因此选用冗余分析(Rundancy analysis, RDA)对土壤线虫属的分布与环境因子间的关系进行排序。去趋势对应分析和冗余分析分别采用vegan包的decorana和rda函数进行。此外, 采用全子集多元回归分析(Multiple regression analyses)探索土壤线虫群落与环境因子间的关系, 采用lm函数以及leaps包的regsubsets函数进行。以上数据分析均在R 3.6.1(R Development Core Team)中进行。
2 结果 2.1 土壤线虫群落组成本研究分离到的土壤线虫隶属于2纲8目32科58属(附表 1)。土壤线虫平均密度为1754个/100 g干土;其中紫花苜蓿样地的密度最低, 为949个/100 g干土;燕麦样地最高, 为3267个/100 g干土(附表 1)。在科水平上, 垫刃科(Tylenchidae)和奎希娅科(Qudsianematidae)为优势类群, 分别占总密度的15.73%和14.41%, 纽带科(Hoplolaimidae)和头叶科(Cephalobidae)等16科为常见类群, 共占总密度的64.53%;诺帝科(Nordiidae)和细齿科(Leptonchidae)等14科为稀有类群, 共占总密度的5.32%(附表 1)。在属的水平上, 没有发现优势类群(附表 1)。
| 序号 No. |
类群 Group |
垂穗披碱草 | 老芒麦 | 早熟禾 | 羊茅 | 燕麦 | 紫花苜蓿 | 天然草地 | 平均值Mean | 功能团 Guild |
|||||||||||||||
| 密度Abundance/(个/100 g) | 比例Percentage/% | 密度Abundance/(个/100 g) | 比例Percentage/% | 密度Abundance/(个/100 g) | 比例Percentage/% | 密度Abundance/(个/100 g) | 比例Percentage/% | 密度Abundance/(个/100 g) | 比例Percentage/% | 密度Abundance/(个/100 g) | 比例Percentage/% | 密度Abundance/(个/100 g) | 比例Percentage/% | 密度Abundance/(个/100 g) | 比例Percentage/% | ||||||||||
| 泄管纲Secernentea | 902.36 | 58.46 | 1062.55 | 58.34 | 762.48 | 48.44 | 889.11 | 61.92 | 1994.54 | 61.06 | 589.26 | 62.07 | 994.67 | 58.93 | 1027.85 | 58.60 | |||||||||
| 垫刃目Tylenchida | 414.93 | 26.88 | 548.99 | 30.14 | 496.59 | 31.55 | 708.00 | 49.30 | 1104.10 | 33.80 | 426.21 | 44.90 | 472.91 | 28.02 | 595.96 | 33.97 | |||||||||
| 垫刃科Tylenchidae | 174.75 | 11.32 | 357.72 | 19.64 | 276.34 | 17.56 | 179.86 | 12.52 | 492.72 | 15.08 | 249.61 | 26.29 | 200.76 | 11.89 | 275.97 | 15.73 | |||||||||
| 1 | 丝尾垫刃属Filenchus | 101.70 | 6.59 | 111.79 | 6.14 | 132.67 | 8.43 | 83.41 | 5.81 | 262.77 | 8.04 | 112.55 | 11.86 | 162.57 | 9.63 | 138.21 | 7.88 | Fu2 | |||||||
| 2 | 叉针属Boleodorus | 24.08 | 1.56 | 102.39 | 5.62 | 97.74 | 6.21 | 96.45 | 6.72 | 199.14 | 6.10 | 50.49 | 5.32 | 24.52 | 1.45 | 84.97 | 4.84 | He2 | |||||||
| 3 | 野外垫刃属Aglenchus | 29.33 | 1.61 | 17.85 | 1.13 | 30.80 | 0.94 | 56.19 | 5.92 | 13.67 | 0.81 | 21.12 | 1.20 | He2 | |||||||||||
| 4 | 细纹垫刃属Lelenchus | 12.16 | 0.79 | 94.35 | 5.18 | 20.88 | 1.33 | 18.20 | 1.04 | He2 | |||||||||||||||
| 5 | 具脊垫刃属Coslenchus | 19.86 | 1.09 | 30.37 | 3.20 | 7.18 | 0.41 | He2 | |||||||||||||||||
| 6 | 垫刃属Tylenchus | 36.81 | 2.38 | 7.19 | 0.46 | 6.29 | 0.36 | He2 | |||||||||||||||||
| 纽带科Hoplolaimidae | 101.68 | 6.59 | 75.47 | 4.14 | 94.65 | 6.01 | 266.27 | 18.54 | 227.26 | 6.96 | 32.38 | 3.41 | 158.99 | 9.42 | 136.67 | 7.79 | |||||||||
| 7 | 拟盘旋属Pararotylenchus | 60.84 | 3.94 | 49.69 | 2.73 | 18.78 | 1.19 | 112.52 | 7.84 | 143.69 | 4.40 | 24.88 | 2.62 | 84.81 | 5.02 | 70.74 | 4.03 | He3 | |||||||
| 8 | 螺旋属Helicotylenchus | 23.87 | 1.55 | 25.78 | 1.42 | 43.21 | 2.75 | 74.67 | 5.20 | 67.79 | 2.08 | 7.50 | 0.79 | 58.80 | 3.48 | 43.09 | 2.46 | He3 | |||||||
| 9 | 盘旋属Rotylenchus | 16.96 | 1.10 | 32.66 | 2.07 | 79.08 | 5.51 | 15.78 | 0.48 | 15.39 | 0.91 | 22.84 | 1.30 | He3 | |||||||||||
| 锥垫刃科Tylodoridae | 14.05 | 0.91 | 45.56 | 2.50 | 32.67 | 2.08 | 93.72 | 6.53 | 195.33 | 5.98 | 72.21 | 7.61 | 35.89 | 2.13 | 69.92 | 3.99 | |||||||||
| 10 | 头垫刃属Tetylenchus | 14.05 | 0.91 | 45.56 | 2.50 | 32.67 | 2.08 | 93.72 | 6.53 | 195.33 | 5.98 | 72.21 | 7.61 | 35.89 | 2.13 | 69.92 | 3.99 | He2 | |||||||
| 粒科Anguinidae | 15.88 | 1.03 | 6.05 | 0.33 | 43.54 | 2.77 | 40.97 | 2.85 | 118.83 | 3.64 | 11.01 | 1.16 | 48.47 | 2.87 | 40.68 | 2.32 | |||||||||
| 11 | 茎属Ditylenchus | 15.88 | 1.03 | 6.05 | 0.33 | 43.54 | 2.77 | 40.97 | 2.85 | 118.83 | 3.64 | 11.01 | 1.16 | 48.47 | 2.87 | 40.68 | 2.32 | Fu2 | |||||||
| 肾形科Rotylenchulidae | 52.10 | 3.38 | 24.59 | 1.35 | 10.79 | 0.69 | 67.59 | 4.71 | 15.13 | 0.46 | 26.46 | 2.79 | 28.09 | 1.60 | |||||||||||
| 12 | 肾形属Rotylenchulus | 52.10 | 3.38 | 24.59 | 1.35 | 10.79 | 0.69 | 67.59 | 4.71 | 15.13 | 0.46 | 26.46 | 2.79 | 28.09 | 1.60 | He3 | |||||||||
| 针科Paratylenchidae | 30.46 | 1.97 | 32.57 | 1.79 | 10.97 | 0.70 | 24.64 | 1.72 | 23.67 | 0.72 | 4.45 | 0.47 | 8.65 | 0.51 | 19.34 | 1.10 | |||||||||
| 13 | 针属Paratylenchus | 30.46 | 1.97 | 32.57 | 1.79 | 10.97 | 0.70 | 24.64 | 1.72 | 23.67 | 0.72 | 4.45 | 0.47 | 8.65 | 0.51 | 19.34 | 1.10 | He2 | |||||||
| 锥科Dolichodoridae | 15.95 | 1.03 | 4.01 | 0.22 | 20.51 | 1.30 | 30.60 | 2.13 | 7.62 | 0.23 | 20.15 | 1.19 | 14.12 | 0.80 | |||||||||||
| 14 | 那格尔属Nagelus | 15.95 | 1.03 | 4.01 | 0.22 | 20.51 | 1.30 | 30.60 | 2.13 | 7.62 | 0.23 | 20.15 | 1.19 | 14.12 | 0.80 | He3 | |||||||||
| 环科Criconematidae | 10.05 | 0.65 | 3.02 | 0.17 | 7.12 | 0.45 | 4.35 | 0.30 | 23.54 | 0.72 | 6.55 | 0.69 | 7.81 | 0.45 | |||||||||||
| 15 | 大节片属Macroposthonia | 5.03 | 0.33 | 7.12 | 0.45 | 18.35 | 0.56 | 6.55 | 0.69 | 5.29 | 0.30 | He3 | |||||||||||||
| 16 | 中轮属Criconemoides | 5.03 | 0.33 | 3.02 | 0.17 | 4.35 | 0.30 | 1.77 | 0.10 | He3 | |||||||||||||||
| 17 | 沟环属Ogma | 5.19 | 0.16 | 0.74 | 0.04 | He3 | |||||||||||||||||||
| 突腔唇科Ecphyadophoridae | 23.55 | 2.48 | 3.36 | 0.19 | |||||||||||||||||||||
| 18 | 类突腔唇属Ecphyadophoroides | 23.55 | 2.48 | 3.36 | 0.19 | He2 | |||||||||||||||||||
| 滑刃目Aphelenchida | 176.42 | 11.43 | 186.91 | 10.26 | 184.52 | 11.72 | 86.10 | 6.00 | 411.02 | 12.58 | 56.29 | 5.93 | 267.92 | 15.87 | 195.60 | 11.15 | |||||||||
| 真滑刃科Aphelenchidae | 32.96 | 2.14 | 119.67 | 6.57 | 82.40 | 5.24 | 41.41 | 2.88 | 260.76 | 7.98 | 56.29 | 5.93 | 171.33 | 10.15 | 109.26 | 6.23 | |||||||||
| 19 | 真滑刃属Aphelenchus | 32.96 | 2.14 | 119.67 | 6.57 | 82.40 | 5.24 | 41.41 | 2.88 | 260.76 | 7.98 | 56.29 | 5.93 | 171.33 | 10.15 | 109.26 | 6.23 | Fu2 | |||||||
| 滑刃科Aphelenchoididae | 143.46 | 9.29 | 67.24 | 3.69 | 102.12 | 6.49 | 44.69 | 3.11 | 150.26 | 4.60 | 96.58 | 5.72 | 86.34 | 4.92 | |||||||||||
| 20 | 滑刃属Aphelenchoides | 143.46 | 9.29 | 67.24 | 3.69 | 102.12 | 6.49 | 44.69 | 3.11 | 150.26 | 4.60 | 96.58 | 5.72 | 86.34 | 4.92 | Fu2 | |||||||||
| 小杆目Rhabditida | 311.02 | 20.15 | 326.65 | 17.93 | 81.37 | 5.17 | 95.00 | 6.62 | 479.41 | 14.68 | 106.75 | 11.24 | 253.84 | 15.04 | 236.29 | 13.47 | |||||||||
| 头叶科Cephalobidae | 98.27 | 6.37 | 132.62 | 7.28 | 42.37 | 2.69 | 59.00 | 4.11 | 389.86 | 11.93 | 88.99 | 9.37 | 129.03 | 7.64 | 134.31 | 7.66 | |||||||||
| 21 | 头叶属Cephalobus | 47.13 | 3.05 | 79.18 | 4.35 | 24.28 | 1.54 | 42.32 | 2.95 | 201.42 | 6.17 | 40.05 | 4.22 | 83.01 | 4.92 | 73.91 | 4.21 | Ba2 | |||||||
| 22 | 拟丽突属Acrobeloides | 28.90 | 1.87 | 48.37 | 2.66 | 18.09 | 1.15 | 16.67 | 1.16 | 111.61 | 3.42 | 37.94 | 4.00 | 42.18 | 2.50 | 43.40 | 2.47 | Ba2 | |||||||
| 23 | 丽突属Acrobeles | 22.24 | 1.44 | 5.06 | 0.28 | 76.83 | 2.35 | 11.00 | 1.16 | 3.85 | 0.23 | 17.00 | 0.97 | Ba2 | |||||||||||
| 盆咽科Panagrolaimidae | 70.17 | 4.55 | 66.30 | 3.64 | 7.19 | 0.46 | 29.90 | 2.08 | 68.00 | 2.08 | 17.76 | 1.87 | 105.10 | 6.23 | 52.06 | 2.97 | |||||||||
| 24 | 盆咽属Panagrolaimus | 70.17 | 4.55 | 66.30 | 3.64 | 7.19 | 0.46 | 29.90 | 2.08 | 68.00 | 2.08 | 17.76 | 1.87 | 105.10 | 6.23 | 52.06 | 2.97 | Ba1 | |||||||
| 畸头科Teratocephalidae | 49.50 | 3.21 | 80.04 | 4.39 | 17.73 | 1.13 | 13.67 | 0.42 | 19.71 | 1.17 | 25.81 | 1.47 | |||||||||||||
| 25 | 真畸头属Euteratocephalus | 23.02 | 1.49 | 37.25 | 2.05 | 14.70 | 0.93 | 8.48 | 0.26 | 16.51 | 0.98 | 14.28 | 0.81 | Ba3 | |||||||||||
| 26 | 畸头属Teratocephalus | 26.48 | 1.72 | 42.79 | 2.35 | 3.04 | 0.19 | 5.19 | 0.16 | 3.20 | 0.19 | 11.53 | 0.66 | Ba3 | |||||||||||
| 小杆科Rhabditidae | 85.66 | 5.55 | 40.00 | 2.20 | 14.08 | 0.89 | 7.89 | 0.24 | 21.09 | 1.20 | |||||||||||||||
| 27 | 三等齿属Pelodera | 41.19 | 2.67 | 40.00 | 2.20 | 14.08 | 0.89 | 7.89 | 0.24 | 14.74 | 0.84 | Ba1 | |||||||||||||
| 28 | 小杆属Rhabditis | 36.25 | 2.35 | 5.18 | 0.30 | Ba1 | |||||||||||||||||||
| 29 | 原杆属Protorhabditis | 8.23 | 0.53 | 1.18 | 0.07 | Ba1 | |||||||||||||||||||
| 短腔科Brevibuccidae | 7.41 | 0.48 | 7.69 | 0.42 | 6.11 | 0.43 | 3.03 | 0.17 | |||||||||||||||||
| 30 | 扭沟属Plectonchus | 7.41 | 0.48 | 7.69 | 0.42 | 6.11 | 0.43 | 3.03 | 0.17 | Ba1 | |||||||||||||||
| 泄腺纲Adenophorea | 641.30 | 41.54 | 758.78 | 41.66 | 811.52 | 51.56 | 546.89 | 38.08 | 1272.13 | 38.94 | 360.08 | 37.93 | 693.33 | 41.07 | 726.29 | 41.40 | |||||||||
| 矛线目Dorylaimida | 412.77 | 26.74 | 564.36 | 30.99 | 640.98 | 40.72 | 397.55 | 27.68 | 888.91 | 27.21 | 202.55 | 21.34 | 409.34 | 24.25 | 502.35 | 28.64 | |||||||||
| 奎希娅科Qudsianematidae | 155.97 | 10.10 | 230.94 | 12.68 | 372.37 | 23.66 | 152.04 | 10.59 | 498.17 | 15.25 | 109.13 | 11.50 | 250.77 | 14.86 | 252.77 | 14.41 | |||||||||
| 31 | 小矛线属Microdorylaimus | 37.64 | 2.44 | 135.21 | 7.42 | 147.59 | 9.38 | 73.96 | 5.15 | 240.04 | 7.35 | 52.47 | 5.53 | 178.06 | 10.55 | 123.57 | 7.04 | OP4 | |||||||
| 32 | 真矛线属Eudorylaimus | 50.24 | 3.25 | 37.49 | 2.06 | 67.20 | 4.27 | 17.73 | 1.23 | 107.38 | 3.29 | 15.78 | 1.66 | 38.52 | 2.28 | 47.76 | 2.72 | OP4 | |||||||
| 33 | 表矛线属Epidorylaimus | 29.75 | 1.93 | 12.36 | 0.68 | 74.19 | 4.71 | 16.27 | 1.13 | 130.87 | 4.01 | 10.79 | 1.14 | 39.18 | 2.23 | OP4 | |||||||||
| 34 | 索努斯属Thonus | 25.01 | 1.62 | 14.78 | 0.81 | 41.53 | 2.64 | 23.08 | 1.61 | 19.88 | 0.61 | 21.19 | 2.23 | 34.19 | 2.03 | 25.66 | 1.46 | OP4 | |||||||
| 35 | 拱唇属Labronema | 13.33 | 0.86 | 31.11 | 1.71 | 41.86 | 2.66 | 21.00 | 1.46 | 8.90 | 0.94 | 16.60 | 0.95 | OP4 | |||||||||||
| 索恩线虫科Thornematidae | 72.01 | 4.66 | 100.03 | 5.49 | 119.37 | 7.58 | 92.81 | 6.46 | 134.08 | 4.10 | 38.61 | 4.07 | 40.24 | 2.38 | 85.31 | 4.86 | |||||||||
| 36 | 中矛线属Mesodorylaimus | 27.28 | 1.77 | 21.27 | 1.17 | 69.01 | 4.38 | 58.03 | 4.04 | 108.47 | 3.32 | 21.55 | 2.27 | 13.67 | 0.81 | 45.61 | 2.60 | OP4 | |||||||
| 37 | 咽针属Laimydorus | 44.73 | 2.90 | 78.77 | 4.32 | 50.36 | 3.20 | 34.78 | 2.42 | 25.62 | 0.78 | 17.06 | 1.80 | 26.57 | 1.57 | 39.70 | 2.26 | OP5 | |||||||
| 孔咽科Aporcelaimidae | 44.96 | 2.91 | 19.93 | 1.09 | 32.24 | 2.05 | 68.71 | 4.78 | 192.76 | 5.90 | 14.99 | 1.58 | 66.51 | 3.94 | 62.87 | 3.58 | |||||||||
| 38 | 无孔小咽属Aporcelaimellus | 11.08 | 0.72 | 11.02 | 0.70 | 45.34 | 3.16 | 173.01 | 5.30 | 8.36 | 0.50 | 35.54 | 2.03 | OP5 | |||||||||||
| 39 | 图鲁玛那瓦属Torumanawa | 2.39 | 0.15 | 13.09 | 0.72 | 13.36 | 0.85 | 23.37 | 1.63 | 14.99 | 1.58 | 30.80 | 1.82 | 14.00 | 0.80 | OP5 | |||||||||
| 40 | 类缢咽属Paraxonchium | 31.49 | 2.04 | 6.85 | 0.38 | 7.85 | 0.50 | 19.75 | 0.60 | 27.36 | 1.62 | 13.33 | 0.76 | OP5 | |||||||||||
| 穿咽科Nygolaimidae | 48.79 | 3.16 | 144.08 | 7.91 | 79.24 | 5.03 | 36.87 | 2.57 | 45.54 | 1.39 | 22.28 | 2.35 | 51.82 | 3.07 | 61.23 | 3.49 | |||||||||
| 41 | 穿咽属Nygolaimus | 48.79 | 3.16 | 144.08 | 7.91 | 79.24 | 5.03 | 36.87 | 2.57 | 45.54 | 1.39 | 22.28 | 2.35 | 51.82 | 3.07 | 61.23 | 3.49 | OP5 | |||||||
| 诺帝科Nordiidae | 63.99 | 4.15 | 43.01 | 2.36 | 3.93 | 0.25 | 8.48 | 0.26 | 17.06 | 0.97 | |||||||||||||||
| 42 | 短体长针属Longidorella | 63.99 | 4.15 | 43.01 | 2.36 | 3.93 | 0.25 | 8.48 | 0.26 | 17.06 | 0.97 | He4 | |||||||||||||
| 细齿科Leptonchidae | 10.05 | 0.65 | 20.26 | 1.11 | 28.32 | 1.80 | 42.44 | 2.96 | 17.55 | 1.85 | 16.95 | 0.97 | |||||||||||||
| 43 | 垫咽属Tylencholaimus | 10.05 | 0.65 | 15.19 | 0.83 | 28.32 | 1.80 | 24.20 | 1.69 | 17.55 | 1.85 | 13.62 | 0.78 | Fu4 | |||||||||||
| 44 | 原细齿属Proleptonchus | 5.06 | 0.28 | 18.25 | 1.27 | 3.33 | 0.19 | Fu4 | |||||||||||||||||
| 颚针科Belondiridae | 11.91 | 0.77 | 6.10 | 0.33 | 5.51 | 0.35 | 4.68 | 0.33 | 4.03 | 0.23 | |||||||||||||||
| 45 | 缢咽属Axonchium | 11.91 | 0.77 | 6.10 | 0.33 | 5.51 | 0.35 | 4.68 | 0.33 | 4.03 | 0.23 | He5 | |||||||||||||
| 膜皮科Diphtherophoridae | 5.10 | 0.33 | 9.88 | 0.30 | 2.14 | 0.12 | |||||||||||||||||||
| 46 | 膜皮属Diphtherophora | 5.10 | 0.33 | 9.88 | 0.30 | 2.14 | 0.12 | Fu3 | |||||||||||||||||
| 窄咽目Araeolaimida | 57.57 | 3.73 | 55.52 | 3.05 | 60.26 | 3.83 | 75.71 | 5.27 | 262.40 | 8.03 | 133.39 | 14.05 | 226.24 | 13.40 | 124.44 | 7.09 | |||||||||
| 绕线科Plectidae | 53.88 | 3.49 | 55.52 | 3.05 | 56.18 | 3.57 | 71.15 | 4.95 | 245.44 | 7.51 | 133.39 | 14.05 | 226.24 | 13.40 | 120.26 | 6.86 | |||||||||
| 47 | 绕线属Plectus | 17.66 | 1.14 | 28.14 | 1.54 | 56.18 | 3.57 | 38.59 | 2.69 | 82.84 | 2.54 | 43.56 | 4.59 | 147.35 | 8.73 | 59.19 | 3.37 | Ba2 | |||||||
| 48 | 拟绕线属Anaplectus | 23.50 | 1.52 | 6.85 | 0.38 | 32.56 | 2.27 | 129.86 | 3.98 | 32.61 | 3.44 | 74.40 | 4.41 | 42.83 | 2.44 | Ba2 | |||||||||
| 49 | 威尔斯属Wilsonema | 12.73 | 0.82 | 20.54 | 1.13 | 32.74 | 1.00 | 57.22 | 6.03 | 4.49 | 0.27 | 18.24 | 1.04 | Ba2 | |||||||||||
| 细咽科Leptolaimidae | 3.69 | 0.24 | 4.08 | 0.26 | 4.56 | 0.32 | 16.96 | 0.52 | 4.18 | 0.24 | |||||||||||||||
| 50 | 连胃属Chronogaster | 3.69 | 0.24 | 4.08 | 0.26 | 4.56 | 0.32 | 16.96 | 0.52 | 4.18 | 0.24 | Ba3 | |||||||||||||
| 嘴刺目Enoplida | 161.36 | 10.45 | 118.37 | 6.50 | 106.36 | 6.76 | 68.13 | 4.74 | 96.78 | 2.96 | 11.85 | 1.25 | 50.91 | 3.02 | 87.68 | 5.00 | |||||||||
| 无咽科Alaimidae | 148.94 | 9.65 | 88.91 | 4.88 | 93.09 | 5.91 | 61.31 | 4.27 | 96.78 | 2.96 | 11.85 | 1.25 | 50.91 | 3.02 | 78.83 | 4.49 | |||||||||
| 51 | 无咽属Alaimus | 148.94 | 9.65 | 88.91 | 4.88 | 93.09 | 5.91 | 61.31 | 4.27 | 96.78 | 2.96 | 11.85 | 1.25 | 50.91 | 3.02 | 78.83 | 4.49 | Ba4 | |||||||
| 棱咽科Prismatolamidae | 5.03 | 0.33 | 18.30 | 1.00 | 6.07 | 0.39 | 4.20 | 0.24 | |||||||||||||||||
| 52 | 棱咽属Prismatolaimus | 5.03 | 0.33 | 18.30 | 1.00 | 6.07 | 0.39 | 4.20 | 0.24 | Ba3 | |||||||||||||||
| 三孔科Tripylidae | 11.16 | 0.61 | 7.19 | 0.46 | 2.62 | 0.15 | |||||||||||||||||||
| 53 | 三裂体属Trischistoma | 11.16 | 0.61 | 7.19 | 0.46 | 2.62 | 0.15 | OP3 | |||||||||||||||||
| 巴氏科Bastianiidae | 7.39 | 0.48 | 6.81 | 0.47 | 2.03 | 0.12 | |||||||||||||||||||
| 54 | 巴氏属Bastiania | 7.39 | 0.48 | 6.81 | 0.47 | 2.03 | 0.12 | Ba3 | |||||||||||||||||
| 单齿目Mononchida | 9.59 | 0.62 | 20.54 | 1.13 | 3.93 | 0.25 | 5.51 | 0.38 | 18.86 | 0.58 | 12.28 | 1.29 | 6.84 | 0.40 | 11.08 | 0.63 | |||||||||
| 单齿科Mononchidae | 9.59 | 0.62 | 20.54 | 1.13 | 3.93 | 0.25 | 5.51 | 0.38 | 18.86 | 0.58 | 12.28 | 1.29 | 6.84 | 0.40 | 11.08 | 0.63 | |||||||||
| 55 | 克拉克属Clarkus | 20.54 | 1.13 | 3.93 | 0.25 | 5.51 | 0.38 | 5.19 | 0.16 | 12.28 | 1.29 | 6.84 | 0.40 | 7.75 | 0.44 | OP4 | |||||||||
| 56 | 锉齿属Mylonchulus | 5.10 | 0.33 | 8.48 | 0.26 | 1.94 | 0.11 | OP4 | |||||||||||||||||
| 57 | 同等齿属Comiconchus | 4.50 | 0.29 | 5.19 | 0.16 | 1.38 | 0.08 | OP4 | |||||||||||||||||
| 单宫目Monhysterida | 5.19 | 0.16 | 0.74 | 0.04 | |||||||||||||||||||||
| 单宫科Monhysteridae | 5.19 | 0.16 | 0.74 | 0.04 | |||||||||||||||||||||
| 58 | 单宫属Monhystera | 5.19 | 0.16 | 0.74 | 0.04 | Ba2 | |||||||||||||||||||
| 总密度Total abundance | 1543.67 | 100.00 | 1821.33 | 100.00 | 1574.00 | 100.00 | 1436.00 | 100.00 | 3266.67 | 100.00 | 949.33 | 100.00 | 1688.00 | 100.00 | 1754.14 | 100.00 | |||||||||
| 总类群数Total richness | 50.00 | 44.00 | 42.00 | 36.00 | 42.00 | 32.00 | 32.00 | 58.00 | |||||||||||||||||
| He: 植食性线虫Herbivores;Fu: 食真菌线虫Fungivores;Ba: 食细菌线虫Bacterivores;OP: 杂食-捕食性线虫Omnivores-Predators;Hex、Fux、Bax、OPx, x指c-p值 | |||||||||||||||||||||||||
不同草地的土壤线虫群落优势类群存在一定差异(附表 1)。在属水平上, 紫花苜蓿样地的优势类群为丝尾垫刃属(Filenchus)(占11.86%);天然草地为小矛线属(Microdorylaimus)(占10.55%)和真滑刃属(Aphelenchus)(占10.15%);而其他人工草地无优势属(附表 1)。
2.2 土壤线虫密度和多样性线虫密度、类群数和Shannon多样性指数均在燕麦样地最高, Simpson优势度指数在燕麦样地最低(图 1)。分析结果表明, 燕麦样地的线虫密度与老芒麦样地无显著差异, 但显著高于其他样地;与天然草地相比, 燕麦样地的线虫密度增加了93.47%(图 1)。燕麦样地的线虫类群数和Shannon多样性指数显著高于天然草地, 其Simpson优势度指数显著低于垂穗披碱草、紫花苜蓿样地和天然草地;此外, 羊茅样地的线虫Simpson优势度指数显著低于天然草地NG(图 1)。

|
| 图 1 不同人工草地和天然草地的土壤线虫群落密度和多样性(平均值±标准误) Fig. 1 The abundance, taxonomic richness, Shannon index and Pielou index of the soil nematode communities in the artificial grasslands of the different forage species and the natural grasslands (Mean±SE) 不同小写字母表示不同样地间差异显著(P<0.05) |
燕麦样地的各营养类群密度均为最高, 其植食性和杂食-捕食性线虫密度显著高于天然草地, 分别增加了179.42%和113.66%;其食真菌线虫密度显著高于垂穗披碱草、老芒麦、羊茅和紫花苜蓿样地, 其食细菌线虫密度显著高于早熟禾、羊茅和紫花苜蓿样地(图 2)。此外, 老芒麦和早熟禾样地的杂食-捕食性线虫密度显著高于紫花苜蓿样地(图 2)。

|
| 图 2 不同人工草地和天然草地的土壤线虫营养类群密度(平均值±标准误) Fig. 2 The abundances of the trophic groups of the soil nematode communities in the artificial grasslands of the different forage species and the natural grasslands (Mean±SE) |
禾本科牧草的自由生活线虫成熟度指数呈增加趋势, 其中早熟禾和羊茅样地显著高于天然草地(图 3)。紫花苜蓿样地的植物寄生线虫成熟度指数PPI最低, 显著低于天然草地(图 3)。与天然草地相比, 垂穗披碱草、老芒麦、早熟禾和羊茅等多年生禾本科牧草样地的线虫基础指数BI显著下降, 但各人工草地的通道指数均无明显变化(图 3)。此外, 垂穗披碱草样地的线虫通道指数小于50, 表明以细菌分解通道为主;而其他样地大于50, 表明以真菌分解通道为主。

|
| 图 3 不同人工草地和天然草地的土壤线虫生态指数(平均值±标准误) Fig. 3 MI, PPI, BI and CI of the soil nematodes community in the artificial grasslands of the different forage species and the natural grasslands (Mean±SE) |
不同人工草地的线虫富集指数和结构指数具有显著差异(图 4), 表明植物物种对养分富集状况和土壤食物网的结构的影响不同。其中, 紫花苜蓿样地的线虫富集指数和结构指数最低。天然草地、早熟禾和羊茅样地的线虫区系处于B和C象限之间, 表明土壤养分状况较好, 食物网稳定成熟;与天然草地相比, 早熟禾和羊茅样地结构指数增加, 表明食物链更长, 连通性更高。垂穗披碱草和老芒麦样地的线虫区系位于B象限, 表明土壤养分状况好, 食物网成熟。燕麦和紫花苜蓿样地的线虫区系位于C象限, 表明土壤养分富集状况中等, 食物网处于结构化状态。

|
| 图 4 不同人工草地和天然草地的线虫区系分析(平均值±标准误) Fig. 4 Nematode faunal analysis of the different artificial grasslands and the natural grasslands (Mean±SE) 误差线上不同字母表示不同样地间的富集指数(大写)或结构指数(小写)差异显著(P<0.05) |
土壤含水量、有机碳、全氮、有效氮、全磷、有效磷、全钾、有效钾和pH在样地间均具有显著差异(表 1)。老芒麦样地的土壤含水量显著高于紫花苜蓿样地。土壤有机碳、有效氮、有效磷、有效钾均在天然草地最高, 全氮、全磷、全钾均在羊茅样地最高, 土壤pH在垂穗披碱草样地最高。
| 垂穗披碱草 EN |
老芒麦 ES |
早熟禾 PA |
羊茅 FO |
燕麦 AS |
紫花苜蓿 MS |
天然草地 NG |
F | P | |
| 含水量WC/% | 0.28±0.01 ab | 0.26±0.02 b | 0.29±0.03 ab | 0.32±0.01 ab | 0.33±0.02 ab | 0.35±0.02 a | 0.30±0.02 ab | 3.12 | 0.01 |
| 有机碳SOC/(g/kg) | 27.87±0.91 cd | 31.17±0.72 bc | 29.50±1.31 cd | 34.04±0.26 ab | 26.18±0.93 de | 23.15±0.27 e | 36.72±1.65 a | 22.09 | <0.01 |
| 全氮TN/(g/kg) | 2.86±0.11 b | 3.02±0.09 ab | 3.01±0.12 ab | 3.36±0.04 a | 2.62±0.07 bc | 2.32±0.03 c | 3.29±0.16 a | 14.47 | <0.01 |
| 有效氮AN/(mg/kg) | 212.82±3.40 b | 273.29±7.37 a | 214.23±7.54 b | 280.32±3.75 a | 226.41±8.48 b | 189.38±7.96 b | 310.79±15.43 a | 26.97 | <0.01 |
| 全磷TP/(g/kg) | 0.75±0.02 a | 0.76±0.01 a | 0.76±0.02 a | 0.82±0.02 a | 0.76±0.02 a | 0.66±0.02 b | 0.76±0.01 a | 6.19 | <0.01 |
| 有效磷AP/(mg/kg) | 7.76±0.33 ab | 7.90±0.43 ab | 7.71±0.55 ab | 7.60±0.38 ab | 6.79±0.03 b | 6.82±0.49 b | 9.68±1.19 a | 2.72 | <0.05 |
| 全钾TK/(g/kg) | 14.60±0.24 b | 14.92±0.03 b | 14.15±0.22 b | 18.60±1.90 a | 14.17±0.20 b | 13.22±0.23 b | 14.98±0.03 b | 5.42 | <0.01 |
| 有效钾AK/(mg/kg) | 117.67±7.50 bc | 124.60±8.27 b | 98.61±7.09 bc | 115.94±3.47 bc | 105.54±4.59 bc | 77.81±1.73 c | 185.26±21.17 a | 11.89 | <0.01 |
| 土壤pH | 5.56±0.06 a | 5.04±0.07 d | 5.25±0.08 bcd | 5.30±0.04 bc | 5.33±0.06 ab | 5.38±0.02 ab | 5.09±0.03 cd | 10.86 | <0.01 |
| EN: 垂穗披碱草Elymus nutans Griseb.;ES: 老芒麦Elymus sibiricus L.;PA: 早熟禾Poa annua L.;FO: 羊茅Festuca ovina L.;AS: 燕麦Avena sativa L.;MS: 紫花苜蓿Medicago sativa L.;NG: 天然草地Natural grassland;WC: 含水量Water content;SOC: 有机碳Soil organic carbon;TN: 全氮Total nitrogen;AN: 有效氮Available nitrogen;TP: 全磷Total phosphorus;AP: 有效磷Available phosphorus;TK: 全钾Total potassium;AK: 有效钾Available potassium;同一行内不同字母表示不同样地间差异显著(P<0.05) | |||||||||
冗余分析结果表明, 第一排序轴的解释量具有显著性(P<0.01)。第一轴与全钾(r=0.80, P<0.05)显著正相关, 与碳氮比(r=-0.98, P<0.01)显著负相关;第二轴与全磷(r=0.95, P<0.001)和有效钾(r=0.78, P<0.001)显著正相关(图 5)。天然草地与6种人工草地的土壤线虫群落组成存在差异, 尤其是与垂穗披碱草、早熟禾、羊茅和紫花苜蓿样地明显不同。此外, 紫花苜蓿样地与其他样地的土壤线虫群落组成存在明显差异。

|
| 图 5 土壤线虫群落与土壤环境因子的冗余分析 Fig. 5 Ordination diagram from the redundancy analysis (RDA) on the relationships between the soil nematode communities and the soil parameters TP: 全磷Total phosphorus;TK: 全钾Total potassium;AP: 有效磷Available phosphorus;AK: 有效钾Available potassium;黑色箭头代表土壤参数, 空心三角形代表土壤线虫的属 |
多元回归分析结果表明土壤线虫密度和土壤有效钾含量呈显著正相关关系, 与碳磷比呈显著负相关关系;线虫类群数与土壤碳氮比呈显著负相关关系(表 2)。在所观测的土壤环境因子中, 有效钾是影响土壤线虫群落最主要的因素。
| 有机碳 SOC |
全氮 TN |
全磷 TP |
有效钾 AK |
碳氮比 C/N |
碳磷比 C/P |
氮磷比 N/P |
|
| 密度Abundance | 0.45* | -0.46* | |||||
| 类群数Richness | -0.34* | ||||||
| 植食性线虫密度Herbivore abundance | -0.37* | 0.31 | |||||
| 食真菌线虫密度Fungivore abundance | 0.39* | -0.39* | |||||
| 食细菌线虫密度Bacterivore abundance | 0.77*** | -0.63** | |||||
| 自由生活线虫成熟度指数MI | 0.82*** | -0.73*** | |||||
| 植物寄生线虫成熟度指数PPI | 0.42** | ||||||
| 基础指数BI | -0.46** | ||||||
| 结构指数SI | -1.50** | 0.98*** | 1.53*** | ||||
| MI: 自由生活线虫成熟度指数Maturity index;PPI: 植物寄生线虫成熟度指数Plant parasite index;BI: 基础指数Basal index;SI: 结构指数Structure index;*P<0.05;**P<0.01;***P<0.001 | |||||||
本研究发现, 天然草地转变为人工草地后土壤线虫的群落组成、密度和多样性发生变化, 其中燕麦样地线虫群落的密度、类群数和Shannon多样性指数以及植食性和杂食-捕食性线虫密度均显著增加, 而其他人工草地无显著变化(图 1—2)。这与杨锐等[29]的研究结果相似。天然草地转变为人工草地后, 植物的物种、群落多样性、生物量和盖度等的变化是影响土壤线虫群落的重要因素。首先, 与天然草地相比, 人工草地植物物种单一, 多样性降低。理论上植物多样性的降低可通过食物资源的多样性(凋落物的质量和组成)降低和生境简化[24, 38]降低线虫群落的多样性[24], 然而很多研究发现线虫多样性很少受到植物多样性的影响, 植物物种对线虫群落的影响更大[26, 28, 39]。已有研究发现, 单一作物处理下的某些植食性线虫数量比多种作物混种处理下更多[24, 27], 这与不同物种的植物营养成分[40]、根系分泌物[20]、微生物群落[22]和土壤理化性质[21]不同有关。本研究中不同牧草的营养成分及其根系分泌物和微生物情况尚不清楚, 需进一步分析。其次, 转变为人工草地后, 植物生物量的变化会改变食物资源的数量, 进而影响线虫增长[41]。燕麦的地上生物量和总生物量较高[42], 是植食性线虫密度和总密度增加的原因之一。其次, 垂穗披碱草和老芒麦为疏丛型上繁草, 早熟禾为根茎-疏丛型下繁草, 羊茅为矮生-密丛型下繁草, 燕麦为疏丛型上繁草, 紫花苜蓿为直立型上繁草[40], 不同植物的分蘖特性和株丛形状不同会影响植物群落盖度。燕麦样地的盖度高于天然草地[42], 已有研究表明盖度的增加会降低土壤温度同时增加湿度[43], 进而可能影响土壤线虫群落。
此外, 天然草地转变为人工草地后, 播种、翻耕、施肥和除杂等田间管理措施以及植物群落的变化会改变土壤理化性质[44], 是影响土壤线虫群落的另一重要因素[27, 45, 46]。冗余分析结果表明, 土壤全钾、碳氮比、全磷和有效钾是影响线虫群落组成的重要因素(图 5), 这些养分的变化可以通过植物的生物量和土壤pH间接影响线虫群落组成[47]。有研究表明青藏高原地区适当使用钾肥可以促进植物对氮的吸收, 提高植物的生物量和质量[48-49]的同时可能间接增加线虫密度。本研究也发现线虫密度与有效钾显著正相关(表 2), 焦加国等[50]也有类似发现。线虫类群数与土壤碳氮比呈显著负相关(表 2), 本研究燕麦样地的碳氮比下降(表 1), 有利于凋落物降解, 资源可用性的增加减轻了种间竞争的强度, 从而可供更多样的线虫生存[51]。此外, 与天然草地和多年生牧草人工草地不同, 一年生燕麦每年需要翻耕重新播种, 翻耕会降低土壤容重, 增加土壤孔隙和通气性, 可能有利于线虫的运动和生存[52]。
3.2 人工草地间土壤线虫群落差异本研究发现, 燕麦(一年生禾本科)人工草地的线虫总密度以及食真菌、食细菌和杂食-捕食性线虫密度分别显著高于其他几种多年生禾本科和豆科紫花苜蓿人工草地(图 1-2), 表明同一功能群的不同植物物种对土壤线虫群落的影响差异很大, 很多研究也有类似发现[16, 26]。其次, 多年生禾本科牧草和豆科紫花苜蓿人工草地间的线虫群落密度、多样性以及植食性、食真菌和食细菌线虫密度均无显著差异(图 1-2)。上述研究结果表明, 与植物功能群相比, 植物物种对土壤线虫群落密度和多样性的影响更大。然而, 其他研究发现豆科固氮植物通过提高土壤肥力和净初级生产力, 导致其土壤总微生物、细菌、真菌和绿藻生物量以及植食性、食细菌和食真菌线虫密度显著高于禾本科植物[27, 53]。本研究结果与其相反, 可能因为随着紫花苜蓿种植年限的增加, 酚酸类和皂苷类等自毒物质的积累[54-55]抑制了线虫的增长[56-57]。也可能因为施用的无机氮过量, 限制了豆科植物共生根瘤菌的形成及相应的共生固氮作用[58-59], 从而对线虫群落产生了抑制作用。此外, 豆科和禾本科植物的根系结构不同, 豆科牧草为直根系, 根系深;而禾本科牧草为须根系, 根系浅, 分布更广, 单位体积根系生物量和根系密度更高, 且比表面积更大[60-61], 为土壤线虫提供了更多的食物资源和避难所, 从而促进其增长[62]。
已有研究发现植食性线虫的取食作用通过促进根系的碳渗出会增加土壤微生物活性[63], 本研究燕麦地较多的植食性线虫通过促进微生物群落, 可能间接增加食细菌和食真菌线虫的密度。丛枝菌根真菌是食真菌线虫的食物之一, 在草本植物群落中普遍存在[22], 燕麦的丛枝菌根真菌孢子密度大于早熟禾、紫羊茅和紫花苜蓿[64], 可能是燕麦样地的食真菌线虫较多的另一个原因。此外, 杂食性线虫通常以多种食物资源为食, 捕食性线虫以土壤微小型动物为食, 燕麦地提供了较多的植食性、食细菌和食真菌线虫等作为杂食-捕食性线虫的食物资源, 自下而上的调控作用可能会增加燕麦地杂食-捕食性线虫的密度。
3.3 人工草地对土壤食物网结构和功能的影响土壤线虫群落是良好的指示生物, 可以指示和反映土壤食物网结构和功能的变化[12]。本研究发现建植人工草地增加了自由生活线虫成熟度指数(图 3), 表明禾本科牧草, 尤其是早熟禾和羊茅样地线虫群落K对策者比例较高。可能因为禾本科人工草地的土壤有机碳和可利用养分等食物资源降低(表 1), 导致典型机会主义线虫(c-p1)类群减少。本研究发现多年生禾本科人工草地降低了线虫的基础指数(图 3), 表明其土壤食物网的抵抗力降低。线虫通道指数结果(图 3)表明垂穗披碱草样地与其他草地不同, 以细菌分解通道为主[11]。可能因为该样地的土壤碳氮比最低(表 1), 致使食细菌线虫增加, 进而导致分解通道发生转变[65]。燕麦为一年生牧草, 每年进行翻耕处理, 其干扰较多年生牧草大, 且其线虫密度高, 养分循环快, 可能是导致其富集指数和结构指数较低的原因。紫花苜蓿样地的线虫富集指数和结构指数最低(图 4), 可能是紫花苜蓿产生的酚酸类和皂苷类等次生代谢物引起的自毒效应[54-55]抑制了线虫的增长[56-57], 从而造成了土壤食物网的相对退化。这也是其紫花苜蓿下的植物寄生线虫成熟度指数PPI最低的原因。同时, 可能由于施用的无机氮过量, 限制了豆科的固氮作用[58-59], 从而可能降低土壤养分。因此, 为维持土壤的生态功能, 不同植物物种人工草地的施肥策略需进一步研究。
4 结论综上所述, 青藏高原地区建植燕麦人工草地显著增加了土壤线虫群落的总密度和多样性以及植食性和杂食-捕食性线虫密度。与植物功能群相比, 植物物种对土壤线虫群落密度和多样性的影响更大。天然草地转变为人工草地改变了土壤线虫的群落组成, 其中土壤全钾、碳氮比、全磷和有效钾是影响土壤线虫群落组成的重要因素。建植人工草地是缓解青藏高原草蓄矛盾的重要措施, 鉴于当地生态环境脆弱, 在大面积建植人工草地前应对地下生态过程的变化深入研究。
| [1] |
Su X K, Han W Y, Liu G H, Zhang Y, Lu H T. Substantial gaps between the protection of biodiversity hotspots in alpine grasslands and the effectiveness of protected areas on the Qinghai-Tibetan Plateau, China. Agriculture, Ecosystems & Environment, 2019, 278: 15-23. |
| [2] |
董世魁, 汤琳, 张相锋, 刘世梁, 刘全儒, 苏旭坤, 张勇, 武晓宇, 赵珍珍, 李钰, 沙威. 高寒草地植物物种多样性与功能多样性的关系. 生态学报, 2017, 37(5): 1472-1483. |
| [3] |
Hopping K A, Knapp A K, Dorji T, Klein J A. Warming and land use change concurrently erode ecosystem services in Tibet. Global Change Biology, 2018, 24(11): 5534-5548. DOI:10.1111/gcb.14417 |
| [4] |
Cao Y N, Wu J S, Zhang X Z, Niu B, Li M, Zhang Y J, Wang X T, Wang Z P. Dynamic forage-livestock balance analysis in alpine grasslands on the Northern Tibetan Plateau. Journal of Environmental Management, 2019, 238: 352-359. |
| [5] |
Li W, Wang J L, Zhang X J, Shi S L, Cao W X. Effect of degradation and rebuilding of artificial grasslands on soil respiration and carbon and nitrogen pools on an alpine meadow of the Qinghai-Tibetan Plateau. Ecological Engineering, 2018, 111: 134-142. DOI:10.1016/j.ecoleng.2017.10.013 |
| [6] |
Wu G L, Liu Z H, Zhang L, Hu T M, Chen J M. Effects of artificial grassland establishment on soil nutrients and carbon properties in a black-soil-type degraded grassland. Plant and Soil, 2010, 333(1/2): 469-479. |
| [7] |
Li Y Y, Dong S K, Wen L, Wang X X, Wu Y. Soil carbon and nitrogen pools and their relationship to plant and soil dynamics of degraded and artificially restored grasslands of the Qinghai-Tibetan Plateau. Geoderma, 2014, 213: 178-184. DOI:10.1016/j.geoderma.2013.08.022 |
| [8] |
Van Den Hoogen J, Geisen S, Routh D, Ferris H, Traunspurger W, Wardle D A, De Goede R G M, Adams B J, Ahmad W, Andriuzzi W S, Bardgett R D, Bonkowski M, Campos-Herrera R, Cares J E, Caruso T, De Brito Caixeta L, Chen X Y, Costa S R, Creamer R, Da Cunha Castro J M, Dam M, Djigal D, Escuer M, Griffiths B S, Gutiérrez C, Hohberg K, Kalinkina D, Kardol P, Kergunteuil A, Korthals G, Krashevska V, Kudrin A A, Li Q, Liang W J, Magilton M, Marais M, Martín J A R, Matveeva E, Mayad E H, Mulder C, Mullin P, Neilson R, Nguyen T A D, Nielsen U N, Okada H, Rius J E P, Pan K W, Peneva V, Pellissier L, Da Silva J C P, Pitteloud C, Powers T O, Powers K, Quist C W, Rasmann S, Moreno S S, Scheu S, Setälä H, Sushchuk A, Tiunov A V, Trap J, Van Der Putten W, Vestergård M, Villenave C, Waeyenberge L, Wall D H, Wilschut R, Wright D G, Yang J I, Crowther T W. Soil nematode abundance and functional group composition at a global scale. Nature, 2019, 572(7768): 194-198. DOI:10.1038/s41586-019-1418-6 |
| [9] |
Ferris H. Contribution of nematodes to the structure and function of the soil food web. Journal of Nematology, 2010, 42(1): 63-67. |
| [10] |
Jiang Y J, Qian H Y, Wang X Y, Chen L J, Liu M Q, Li H X, Sun B. Nematodes and microbial community affect the sizes and turnover rates of organic carbon pools in soil aggregates. Soil Biology and Biochemistry, 2018, 119: 22-31. DOI:10.1016/j.soilbio.2018.01.001 |
| [11] |
Ferris H, Bongers T, De Goede R G M. A framework for soil food web diagnostics: extension of the nematode faunal analysis concept. Applied Soil Ecology, 2001, 18(1): 13-29. DOI:10.1016/S0929-1393(01)00152-4 |
| [12] |
Yeates G W. Nematodes as soil indicators: functional and biodiversity aspects. Biology and Fertility of Soils, 2003, 37(4): 199-210. DOI:10.1007/s00374-003-0586-5 |
| [13] |
徐梦, 李晓亮, 蔡晓布, 李晓林, 张旭博, 张俊伶. 藏东南地区不同土地利用方式下土壤有机碳组分及周转变化特征. 中国农业科学, 2018, 51(19): 3714-3725. DOI:10.3864/j.issn.0578-1752.2018.19.009 |
| [14] |
Shao Y H, Wang X L, Zhao J, Wu J P, Zhang W X, Neher D A, Li Y X, Lou Y P, Fu S L. Subordinate plants sustain the complexity and stability of soil micro-food webs in natural bamboo forest ecosystems. Journal of Applied Ecology, 2016, 53(1): 130-139. DOI:10.1111/1365-2664.12538 |
| [15] |
Yan J, Zhang Y Z, Crawford K M, Chen X Y, Yu S, Wu J H. Plant genotypic diversity effects on soil nematodes vary with trophic level. New Phytologist, 2021, 229(1): 575-584. DOI:10.1111/nph.16829 |
| [16] |
Viketoft M. Effects of six grassland plant species on soil nematodes: A glasshouse experiment. Soil Biology and Biochemistry, 2008, 40(4): 906-915. DOI:10.1016/j.soilbio.2007.11.006 |
| [17] |
Wardle D A, Yeates G W, Williamson W, Bonner K I. The response of a three trophic level soil food web to the identity and diversity of plant species and functional groups. Oikos, 2003, 102(1): 45-56. DOI:10.1034/j.1600-0706.2003.12481.x |
| [18] |
Porazinska D L, Bardgett R D, Blaauw M B, Hunt H W, Parsons A N, Seastedt T R, Wall D H. Relationships at the aboveground-belowground interface: plants, soil biota, and soil processes. Ecological Monographs, 2003, 73(3): 377-395. DOI:10.1890/0012-9615(2003)073[0377:RATAIP]2.0.CO;2 |
| [19] |
Van Ruijven J, De Deyn G B, Berendse F. Diversity reduces invasibility in experimental plant communities: the role of plant species. Ecology Letters, 2003, 6(10): 910-918. DOI:10.1046/j.1461-0248.2003.00516.x |
| [20] |
Wurst S, Van Beersum S, Wagenaar R, Bakx-Schotman T, Drigo B, Janzik I, Lanoue A, Van Der Putten W H. Plant defence against nematodes is not mediated by changes in the soil microbial community. Functional Ecology, 2009, 23(3): 488-495. DOI:10.1111/j.1365-2435.2009.01543.x |
| [21] |
Wardle D A. Communities and ecosystems: linking the aboveground and belowground components. New Jersey: Princeton University Press, 2002.
|
| [22] |
Emery S M, Reid M L, Bell-Dereske L, Gross K L. Soil mycorrhizal and nematode diversity vary in response to bioenergy crop identity and fertilization. Global Change Biology Bioenergy, 2017, 9(11): 1644-1656. DOI:10.1111/gcbb.12460 |
| [23] |
Eom A H, Hartnett D C, Wilson G W T. Host plant species effects on arbuscular mycorrhizal fungal communities in tallgrass prairie. Oecologia, 2000, 122(3): 435-444. DOI:10.1007/s004420050050 |
| [24] |
Viketoft M, Sohlenius B. Soil nematode populations in a grassland plant diversity experiment run for seven years. Applied Soil Ecology, 2011, 48(2): 174-184. DOI:10.1016/j.apsoil.2011.03.008 |
| [25] |
Viketoft M, Palmborg C, Sohlenius B, Huss-Danell K, Bengtsson J. Plant species effects on soil nematode communities in experimental grasslands. Applied Soil Ecology, 2005, 30(2): 90-103. DOI:10.1016/j.apsoil.2005.02.007 |
| [26] |
Sohlenius B, Boström S, Viketoft M. Effects of plant species and plant diversity on soil nematodes-a field experiment on grassland run for seven years. Nematology, 2011, 13(1): 115-131. DOI:10.1163/138855410X520945 |
| [27] |
Ye Y Y, Rui Y C, Zeng Z X, He X Y, Wang K L, Zhao J. Responses of soil nematode community to monoculture or mixed culture of a grass and a legume forage species in China. Pedosphere, 2020, 30(6): 791-800. DOI:10.1016/S1002-0160(20)60039-X |
| [28] |
De Deyn G B, Raaijmakers C E, Van Ruijven J, Berendse F, Van Der Putten W H. Plant species identity and diversity effects on different trophic levels of nematodes in the soil food web. Oikos, 2004, 106(3): 576-586. DOI:10.1111/j.0030-1299.2004.13265.x |
| [29] |
杨锐, 吴鹏飞, 魏雪. 天然高寒草地转变为燕麦人工草地对土壤线虫群落的影响. 生态学报, 2020, 40(14): 4903-4920. |
| [30] |
李雨, 吴鹏飞, 龙伟, 马金豪. 高寒地区种植不同种类牧草对土壤节肢动物群落的影响. 生态学报, 2019, 39(20): 7697-7708. |
| [31] |
尹文英. 中国土壤动物检索图鉴. 北京: 科学出版社, 1998.
|
| [32] |
Bongers T. Nematodes from Netherlands (De Nematoden van Nederland). Utrecht: Koninklijke Nederlandse Natuurhistorische Vereniging, 1994.
|
| [33] |
Yeates G W, Bongers T, De Goede R G, Freckman D W, Georgieva S S. Feeding habits in soil nematode families and genera-an outline for soil ecologists. Journal of Nematology, 1993, 25(3): 315-331. |
| [34] |
Sieriebriennikov B, Ferris H, De Goede R G M. NINJA: An automated calculation system for nematode-based biological monitoring. European Journal of Soil Biology, 2014, 61: 90-93. DOI:10.1016/j.ejsobi.2014.02.004 |
| [35] |
鲍士旦. 土壤农化分析(第三版). 北京: 中国农业出版社, 2000.
|
| [36] |
Bongers T. The maturity index: an ecological measure of environmental disturbance based on nematode species composition. Oecologia, 1990, 83(1): 14-19. DOI:10.1007/BF00324627 |
| [37] |
Berkelmans R, Ferris H, Tenuta M, Van Bruggen A H C. Effects of long-term crop management on nematode trophic levels other than plant feeders disappear after 1 year of disruptive soil management. Applied Soil Ecology, 2003, 23(3): 223-235. DOI:10.1016/S0929-1393(03)00047-7 |
| [38] |
Anderson J M. Soil Organisms as Engineers: Microsite Modulation of Macroscale Processes. Boston: Springer, 1995.
|
| [39] |
Viketoft M, Bengtsson J, Sohlenius B, Berg M P, Petchey O, Palmborg C, Huss-Danell K. Long-term effects of plant diversity and composition on soil nematode communities in model grasslands. Ecology, 2009, 90(1): 90-99. DOI:10.1890/08-0382.1 |
| [40] |
王贤. 牧草栽培学. 北京: 中国环境科学出版社, 2006.
|
| [41] |
Hedlund K, Regina I S, Van Der Putten W H, Lepš J, Díaz T, Korthals G W, Lavorel S, Brown V K, Gormsen D, Mortimer S R, Barrueco C R, Roy J, Smilauer P, Smilauerová M, Van Dijk C. Plant species diversity, plant biomass and responses of the soil community on abandoned land across Europe: idiosyncracy or above-belowground time lags. Oikos, 2003, 103(1): 45-58. DOI:10.1034/j.1600-0706.2003.12511.x |
| [42] |
官惠玲, 樊江文, 李愈哲. 不同人工草地对青藏高原温性草原群落生物量组成及物种多样性的影响. 草业学报, 2019, 28(9): 192-201. |
| [43] |
Reese A T, Lulow K, David L A, Wright J P. Plant community and soil conditions individually affect soil microbial community assembly in experimental mesocosms. Ecology and Evolution, 2018, 8(2): 1196-1205. DOI:10.1002/ece3.3734 |
| [44] |
Crotty F V, Fychan R, Sanderson R, Rhymes J R, Bourdin F, Scullion J, Marley C L. Understanding the legacy effect of previous forage crop and tillage management on soil biology, after conversion to an arable crop rotation. Soil Biology and Biochemistry, 2016, 103: 241-252. DOI:10.1016/j.soilbio.2016.08.018 |
| [45] |
Zhao J, Wang X L, Wang X L, Fu S L. Legume-soil interactions: legume addition enhances the complexity of the soil food web. Plant and Soil, 2014, 385(1/2): 273-286. |
| [46] |
Viketoft M. Determinants of small-scale spatial patterns: Importance of space, plants and abiotics for soil nematodes. Soil Biology and Biochemistry, 2013, 62: 92-98. DOI:10.1016/j.soilbio.2013.03.012 |
| [47] |
Zhao J, Wang F M, Li J, Zou B, Wang X L, Li Z A, Fu S L. Effects of experimental nitrogen and/or phosphorus additions on soil nematode communities in a secondary tropical forest. Soil Biology and Biochemistry, 2014, 75: 1-10. DOI:10.1016/j.soilbio.2014.03.019 |
| [48] |
韩德梁, 徐智明, 艾琳, 韩烈保. 磷肥和钾肥对老龄多叶老芒麦牧草生物量和品质的影响. 植物营养与肥料学报, 2009, 15(6): 1486-1490. DOI:10.3321/j.issn:1008-505X.2009.06.035 |
| [49] |
刘文辉, 周青平, 贾志锋, 梁国玲. 施钾对青引1号燕麦草产量及根系的影响. 植物营养与肥料学报, 2010, 16(2): 419-424. |
| [50] |
焦加国, 刘贝贝, 毛妙, 叶成龙, 虞丽, 胡锋, 李辉信. 江苏省不同农业区土壤线虫群落分布特征. 应用生态学报, 2015, 26(11): 3489-3496. |
| [51] |
Song M, Li X M, Jing S S, Lei L J, Wang J L, Wan S Q. Responses of soil nematodes to water and nitrogen additions in an old-field grassland. Applied Soil Ecology, 2016, 102: 53-60. DOI:10.1016/j.apsoil.2016.02.011 |
| [52] |
Zhang S X, Cui S Y, Mclaughlin N B, Liu P, Hu N, Liang W J, Wu D H, Liang A Z. Tillage effects outweigh seasonal effects on soil nematode community structure. Soil and Tillage Research, 2019, 192: 233-239. DOI:10.1016/j.still.2019.05.017 |
| [53] |
Zhao J, Zeng Z X, He X Y, Chen H S, Wang K L. Effects of monoculture and mixed culture of grass and legume forage species on soil microbial community structure under different levels of nitrogen fertilization. European Journal of Soil Biology, 2015, 68: 61-68. DOI:10.1016/j.ejsobi.2015.03.008 |
| [54] |
荣思川, 师尚礼, 孙灿灿. 苜蓿植株及根际土壤中主要酚酸和香豆素物质含量测定. 土壤, 2016, 48(5): 931-938. |
| [55] |
Seguin P, Sheaffer C C, Schmitt M A, Russelle M P, Randall G W, Peterson P R, Hoverstad T R, Quiring S R, Swanson D R. Alfalfa autotoxicity: Effects of reseeding delay, original stand age, and cultivar. Agronomy Journal, 2002, 94(4): 775-781. |
| [56] |
Ohri P, Pannu S K. Effect of phenolic compounds on nematodes-A review. Journal of Applied and Natural Science, 2010, 2(2): 344-350. DOI:10.31018/jans.v2i2.144 |
| [57] |
D'Addabbo T, Carbonara T, Leonetti P, Radicci V, Tava A, Avato P. Control of plant parasitic nematodes with active saponins and biomass from Medicago sativa. Phytochemistry Reviews, 2011, 10(4): 503-519. DOI:10.1007/s11101-010-9180-2 |
| [58] |
Lau J A, Bowling E J, Gentry L E, Glasser P A, Monarch E A, Olesen W M, Waxmonsky J, Young R T. Direct and interactive effects of light and nutrients on the legume-rhizobia mutualism. Acta Oecologica, 2012, 39: 80-86. DOI:10.1016/j.actao.2012.01.004 |
| [59] |
West J B, Hillerislambers J, Lee T D, Hobbie S E, Reich P B. Legume species identity and soil nitrogen supply determine symbiotic nitrogen-fixation responses to elevated atmospheric[CO2]. New Phytologist, 2005, 167(2): 523-530. DOI:10.1111/j.1469-8137.2005.01444.x |
| [60] |
Wang B, Zhang G H. Quantifying the binding and bonding effects of plant roots on soil detachment by overland flow in 10 typical grasslands on the Loess Plateau. Soil Science Society of America Journal, 2017, 81(6): 1567-1576. DOI:10.2136/sssaj2017.07.0249 |
| [61] |
Vannoppen W, De Baets S, Keeble J, Dong Y, Poesen J. How do root and soil characteristics affect the erosion-reducing potential of plant species?. Ecological Engineering, 2017, 109: 186-195. DOI:10.1016/j.ecoleng.2017.08.001 |
| [62] |
Crotty F V, Fychan R, Scullion J, Sanderson R, Marley C L. Assessing the impact of agricultural forage crops on soil biodiversity and abundance. Soil Biology and Biochemistry, 2015, 91: 119-126. DOI:10.1016/j.soilbio.2015.08.036 |
| [63] |
Yeates G W, Saggar S, Hedley C B, Mercer C F. Increase in 14C-carbon translocation to the soil microbial biomass when five species of plant-parasitic nematodes infect roots of white clover. Nematology, 1999, 1(3): 295-300. DOI:10.1163/156854199508298 |
| [64] |
Gai J P, Feng G, Cai X B, Christie P, Li X L. A preliminary survey of the arbuscular mycorrhizal status of grassland plants in southern Tibet. Mycorrhiza, 2006, 16(3): 191-196. DOI:10.1007/s00572-005-0032-7 |
| [65] |
Ferris H, Matute M M. Structural and functional succession in the nematode fauna of a soil food web. Applied Soil Ecology, 2003, 23(2): 93-110. DOI:10.1016/S0929-1393(03)00044-1 |