 2018, Vol. 38
文章信息
- 陈静, 蒋万祥, 贺诗水, 王洪凯, 卓丽玲, 陈青, 王红妹.
- CHEN Jing, JIANG Wanxiang, HE Shishui, WANG Hongkai, ZHUO Liling, CHEN Qing, WANG Hongmei.
- 新薛河底栖动物物种多样性与功能多样性研究
- Study of macroinvertebrate species and functional diversity in the New Xue River, Shandong Province, China
- 生态学报. 2018, 38(9): 3328-3336
- Acta Ecologica Sinica. 2018, 38(9): 3328-3336
- http://dx.doi.org/10.5846/stxb201706241143
-
文章历史
- 收稿日期: 2017-06-24
- 网络出版日期: 2018-01-26


物种多样性表征生物多样性在溪流底栖动物生态学研究中广泛应用[1-4]; 然而, 越来越多的研究证实, 物种性状组成对研究一些重要的生态过程(如生态系统功能、群落组成等)十分重要[5]。许多关于生物多样性与生态系统功能关系的研究表明, 基于物种属性(性状)的研究比简单的物种多样性(如物种丰富度、Shannon指数、物种均匀度)研究可提供更多信息[6]。目前, 生物多样性研究已拓展至功能层面, 使用功能性状表征功能组成及多样性是当前底栖动物生态学研究的热点之一[7]。
物种多样性与功能多样性关系研究有助于了解种间共存[8-9]、生态位互补机制[10], 是研究生物多样性对生态系统功能影响的中心环节[11]。相对植物功能多样性研究, 我国动物功能多样性研究起步较晚, 特别是种类繁多的溪流底栖无脊椎动物, 近几年才见零星报道[7, 12]; 底栖动物功能多样性与物种多样性关系研究尚未见报道。功能多样性与物种多样性关系决定于所处的生态系统, 如Bu等[13]研究发现, 功能多样性与物种多样性存在显著的正相关; Biswas等[14]研究表明, 由中度干扰到严重干扰过程中, 功能多样性同物种多样性呈负相关; De Bello等[15]和Li等[16]等研究表明, 二者之间相互独立, 不存在显著的相关性。此外, 在研究功能多样性与物种多样性关系时, 很多研究并没有考虑到功能多样性的多面性。Mason等[11]认为功能多样性应包括功能丰富度、功能均匀度、功能分离度3个相互独立的组份。功能多样性3类指数之间及其与物种多样性之间究竟存在怎样的关系, 仍是一个值得深入探讨的问题[17]。
生物群落对环境变化的响应主要取决于物种功能性状组成[18]。研究生物多样性随环境梯度变化, 有助于理解生境异质性对多样性的直接影响[9]。本文在山东省新薛河选取代表性河段, 就季节性溪流底栖动物多样性随环境梯度的变化进行了研究。以期:1)明确物种多样性和功能多样性随环境梯度的变化; 2)厘清区域功能多样性与物种多样性的关系。为后续相关研究的开展提供背景数据及理论基础。
1 材料与方法 1.1 区域概况与样点设置新薛河位于山东省西南部, 属于南四湖水系, 全长89.6km, 流域面积686km2。根据栖境特征, 对5个代表性河段底栖动物进行了调查。A河段, 位于石嘴子水库坝下, 以缓流和静水为主, 沉积物较多。B河段下游紧挨枣庄市山亭区, 人口较为密集, 流量受上游水库排水量限制, 河道频繁出现干涸现象。C河段位于山亭区下游, 城市污水在经过沉积处理后, 直接排到该河段; D河段距离城区较远, 生境质量相对较好; E河段间歇性受人为干扰(衣物涮洗、家禽活动)。
1.2 底栖动物采集与鉴定2012年4、10、12月(2012年夏季上游A、B河段干涸), 每月中旬用40目网径、采样面积0.09m2的索伯网(Surber sampler)采集底栖动物, 将网中的底栖动物拣出, 装标本瓶中, 用10%的福尔马林液固定, 标本带回实验室后鉴定、计数[19-21]。每个河段沿水流方向设置采样点3个, 共计采集标本42个(4月份河段B处断流)。
1.3 功能性状和生物多样性计算功能性状主要参考相关文献[22-24]确定, 个别分类单元性状根据标本或分类资料的描述确定。选择化性(Voltinism)、漂移性(Occurrence in drift)、游泳能力(Swimming ability)、附着能力(Attachment)、形状(Shape)、成熟个体大小(Size at maturity)、流态偏好(Rheophily)、温度偏好(Thermal Preference)、生活型(Habit)、营养习性(Trophic habit)等10个性状纳入分析。功能性状及其等级描述同相关文献[7, 22]。
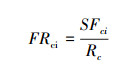
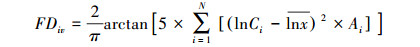
物种多样性指数(物种丰富度、物种均匀度、Shannon指数)计算方法同文献[3]。功能丰富度(Functional richness, FRci)[11]、功能均匀度(Functional evenness, FEve)[25]、功能分离度(Functional divergence, FDiv)[26]计算公式如下:
|
SFci为群落i内物种所占据的生态位空间; Rc为性状c的绝对值范围。

|
S为物种丰富度; PEWi为物种i的局部加权均匀度。
|
Ci为第i项功能性状的数值; Ai为第i项功能性状的相对丰度; 
功能多样性和物种多样性使用软件R3.1.3和FDiversity软件[27]计算。单因素方差分析(One-way ANOVA analysis)用于比较多样性指数的时空差异; 相关分析(Correlation analysis)、偏相关分析(Partial correlation analysis)用于计算多样性指数间的相关性; 逐步回归分析(Stepwise regression analysis)用于分析物种多样性对功能多样性的影响; 上述分析使用的软件为IBM SPSS 19.0。图表制作使用的软件为OringinPro 8.0和EXCEL 2007。
2 结果与分析 2.1 物种多样性时空格局对底栖动物物种多样性空间格局统计分析(图 1), 结果表明, 各河段物种多样性均值介于12.5—17.7之间, 表现为E河段≥C、D河段≥A、B河段(P < 0.05);Shannon指数均值介于1.3—2.0之间, 表现为B河段低于其他河段(P < 0.05);均匀度指数均值介于0.53—0.75之间, 表现为A、C、D河段≥E河段≥B河段(P < 0.05)。

|
| 图 1 底栖动物物种多样性空间分布格局 Fig. 1 Spatial distribution of macroinvertebrates species diversity A-E代表A-E河段; A河段:位于石嘴子水库坝下; B河段:下游紧挨枣庄市山亭区; C河段:山亭区下游; D河段:距离城区较远; E河段:间歇性受人为干扰(衣物涮洗、家禽活动) |
对物种多样性季节动态进行分析(图 2), 结果表明, 物种丰富度在10月份最低(均值为9.8), 4月份最高(均值为18.6);表现为10月份低于12和4月份(P < 0.05)。Shannon指数10月最低(均值为1.6), 4月最高(均值为2.0), 表现为4月≥12月≥10月(P < 0.05)。均匀度指数10月份最高(均值为0.73), 12月份最低(均值为0.62), 表现为10月≥4月≥12月(P < 0.05)。

|
| 图 2 底栖动物物种多样性季节动态 Fig. 2 Seasonal dynamics of macroinvertebrates species diversity |
对功能多样性指数空间格局统计分析(图 3), 结果表明:功能丰富度指数均值在A河段最低(均值为23.5), D河段最高(均值为41.0);表现为D河段≥B、C、E河段≥A河段(P < 0.05)。功能均匀度指数均值在C河段最低(均值为0.40), A河段最高(均值为0.56);表现为A≥E≥B、C、D(P < 0.05)。功能分离度指数均值在B河段最高(均值为0.90), D河段最低(均值为0.74);表现为A、B≥C、E≥D(P < 0.05)。

|
| 图 3 底栖动物功能多样性空间分布格局 Fig. 3 Spatial distribution of macroinvertebrates functional diversity |
统计分析功能多样性季节动态(图 4), 结果表明:功能丰富度均值10月份最低(均值为24.7), 12月份最高(均值为40.4);表现为12月≥4月≥10月(P < 0.05)。功能均匀度均值4月份最低(均值为0.42), 10月份最高(均值为0.53);表现为10月≥12月≥4月(P < 0.05)。功能分离度均值12月份最低(均值为0.75), 10月份最高(均值为0.88);表现为12月份显著低于10和4月份(P < 0.05)。

|
| 图 4 底栖动物功能多样性季节动态 Fig. 4 Seasonal dynamics of macroinvertebrates functional diversity indices |
采用Pearson相关分析法研究多样性指数间的相关性(表 1), 结果表明, 功能丰富度同Shannon指数相关显著(P < 0.05), 同物种丰富度相关极显著(P < 0.01)。功能均匀度同功能分离度、均匀度指数相关显著(P < 0.05)。功能分离度与均匀度指数相关性接近显著水平(P =0.052)。Shannon指数同物种丰富度和均匀度指数相关极显著(P < 0.01)。
| 生物多样性指数Biodiversity indices | 功能均匀度Fve | 功能分离度Fiv | 物种丰富度S | Shannon指数H | 均匀度指数E |
| 功能丰富度Fci | -0.157 | -0.219 | 0.603** | 0.364* | 0.021 |
| 功能均匀度Fve | 0.345* | -0.240 | 0.108 | 0.312* | |
| 功能分离度Fiv | -0.142 | 0.172 | 0.299 | ||
| 物种丰富度S | 0.487** | -0.083 | |||
| Shannon指数H | 0.817** | ||||
| * P < 0.05, ** P < 0.01; Fci: Functional richness, Fve: Functional evenness, Fiv: Functional dispersion, S: Species richness, H: Shannon index, E: Evenness | |||||
鉴于功能多样性3个指数代表多样性的不同方面[11], 且功能均匀度和分离度指数均与物种均匀度指数存在较大相关性, 以均匀度指数为控制变量, 对功能均匀度和功能分离度指数进行偏相关分析, 结果表明二者间无显著相关性(P >0.05)。
运用逐步回归分析研究物种多样性对功能多样性的影响(图 5), 结果表明, 物种丰富度、Shannon指数对功能丰富度影响显著(P < 0.05)。均匀度指数对功能均匀度影响显著(P < 0.05);对功能分离度影响接近显著水平(P =0.054)。

|
| 图 5 物种多样性指数同功能多样性指数间回归分析(仅列P < 0.1的图) Fig. 5 Regression analysis between species diversity and functional diversity indices(Only P < 0.1 in the figure) |
对物种多样性的分析可知, 受间歇性干扰的E河段物种丰富度高于D河段, 符合中度干扰可增加物种多样性的理论[28]。B河段各项指标(物种丰富度、Shannon指数、均匀度指数)均最低, 表明河道频繁断流对流域内底栖动物群落结构影响最大。各河段Shannon指数均值变化趋势同均匀度指数一致, 表明在空间格局上, 物种均匀度较物种丰富度对Shannon指数影响更大。在时间序列上, 10月份物种丰富度显著低于其他月份, 主要因为该时间段河道水量充沛, 流速较大, 底栖动物生存的底部空间扩大; 反之, 枯水期的12和4月份, 水面狭窄, 促使不同种类的底栖动物聚集[29](10、12、4月底栖动物密度分别为896、5259、13352个/m2)。相比物种均匀度, 物种丰富度变化趋势在季节间同Shannon指数较为一致, 表明在时间序列上物种丰富度对Shannon指数影响更大。
研究功能多样性随环境梯度的变化有助于理解生境异质性对功能多样性的直接影响[9]。功能丰富度是对物种占据生态位(性状)空间的度量, 功能丰富度低意味着群落中未被利用的资源多[17]。本文功能丰富度在缓流态的A河段低于其他河段(包括物种丰度最低的B河段), 表明流态对底栖动物功能丰富度影响重大。D河段(对照河段)功能丰度高于其他河段(包括物种丰度最高的E河段), 表明相对物种丰富度, 功能丰富度对环境压力具有更好的响应; 即环境压力可增加功能性状的同质性。功能均匀度常用来衡量物种性状在占据的性状空间中是否规律分布; 功能均匀度低, 意味着未充分利用或过度利用的资源多, 进而可作为生产力、稳定性、抵御入侵能力等的指标[11]。A河段功能均匀度最高, 主要原因在于该河段底栖动物密度最小(均值为1590个/m2, 低于其他河段), 功能性状组成相对均匀。C河段物种均匀度均值最高, 功能均匀度均值最低; 主要原因是城市生活用水的排放使底栖藻类大量繁殖, 以刮食藻类为生的摇蚊(如仅Orthocaldius vaillanti、Neozarelia sp.、Chaetocladius sp. 3个分类单元的相对丰度合计就高达39.6%)幼虫在数量上占据绝对优势。功能离散度体现了群落中物种间的生态位的互补程度[25]; 高功能分离度表示物种生态位重叠小, 资源竞争水平较低, 利用效率高[11]。A河段功能分离度高, 主要原因是该段物种丰富度低、密度小, 使得性状重叠相度对较小。B河段拟长跗摇蚊(Paratanytarsus sp.E)占绝对优势(相对丰度63%); 由功能分离度计算方法[26]可知, 该物种位于性状生态位空间的边缘地带应是B河段功能分离度高的主要原因。
在时间序列上, 3类功能多样性指数变化趋势相互独立。同物种多样性相比, 功能丰富度在4月份稍有下降, 主要原因在于春季是水生昆虫羽化的重要时期, 一些性状伴随生物的羽化从群落中消失或减少。10月份功能均匀度高于12月份和4月份, 主要是因为12月份和4月份水文环境稳定, 一些在竞争上占有优势的物种大量繁殖, 从而导致了群落生物性状分布更加不均匀。同理而论, 功能分离度在12月份最低, 也是由于生境稳定, 少数物种在群落中占据绝对优势(如Paratanytarsus sp.、Cheumatopsyche sp.两个物种相对丰度之和为55.6%), 4月份伴随摇蚊等水生昆虫, 特别是优势类群的羽化, 生物性状重叠度总体出现下降。
功能多样性3类指数间及其与物种多样性间不存在必然的关联性; 如果出现显著的关联, 一定是生态学性状作用的结果[11]。新薛河底栖动物功能多样性指数间相关不显著, 进一步验证了三者之间的独立性。Shannon指数由于受群落物种丰富度和均匀度共同影响[30], 因此, 与二者相关均显著。物种多样性的改变会引起功能多样性发生相应变化被普遍认同, 但二者间具体关系在很多生态系统中尚属未知[31]。本文功能丰富度受物种丰富度和Shannon指数影响显著, 主要原因在于随着物种的增加, 竞争增加, 生态位进一步分化[32-33]; 同时, 某些特殊功能物种的加入无疑会直接增加群落占据的性状空间, 这和很多研究的结果是一致的[13, 34]。同时, 我们也注意到, 功能多样性和物种多样性的关系在不同生态系统中有所差异, 如Devictor等[35]的研究发现, 随着物种丰度升高功能多样性下降。功能均匀度和离散度主要受群落功能性状分布的影响, 不受物种丰度的影响; 而物种均匀度可对性状分布产生不同程度影响, 因此, 二者均不同程度地受物种均匀度影响; 这和薛倩妮等[17]的研究结果是一致的。同时, 就分析结果可知, 功能多样性与物种多样性间拟合度总体不高(R2 < 0.364), 说明二者之间存在更为复杂的非线性关系。Zhang等[36]认为, 二者间的非线性关系是“功能多样性可提供更多不同于物种多样性的特殊信息”重要佐证。
致谢: 野外调查及室内分析得到李坤、马相铭、李丛丛的帮助, 特此致谢。| [1] | Costa S S, Melo A S. Beta diversity in stream macroinvertebrate assemblages:among-site and among-microhabitat components. Hydrobiologia, 2008, 598(1): 131–138. DOI:10.1007/s10750-007-9145-7 |
| [2] | Henriques-Oliveira A L, Nessimian J L. Aquatic macroinvertebrate diversity and composition in streams along an altitudinal gradient in Southeastern Brazil. Biota Neotropica, 2010, 10(3): 115–128. DOI:10.1590/S1676-06032010000300012 |
| [3] | 蒋万祥, 贾兴焕, 周淑婵, 李凤清, 唐涛, 蔡庆华. 香溪河大型底栖动物群落结构季节动态. 应用生态学报, 2009, 20(4): 923–928. |
| [4] | 蒋万祥, 蔡庆华, 唐涛, 吴乃成, 傅小城, 李凤清, 刘瑞秋. 香溪河大型底栖无脊椎动物空间分布. 应用生态学报, 2008, 19(11): 2443–2448. |
| [5] | Diniz-Filho J A F, Cianciaruso M V, Rangel T F, Bini L M. Eigenvector estimation of phylogenetic and functional diversity. Functional Ecology, 2011, 25(4): 735–744. DOI:10.1111/fec.2011.25.issue-4 |
| [6] | Barnett A J, Finlay K, Beisner B E. Functional diversity of crustacean zooplankton communities:towards a traitbased classification. Freshwater Biology, 2007, 52(5): 796–813. DOI:10.1111/fwb.2007.52.issue-5 |
| [7] | 蒋万祥, 何逢志, 蔡庆华. 香溪河水生昆虫功能性状及功能多样性空间格局. 生态学报, 2017, 37(6): 1861–1870. |
| [8] | Cardinale B J, Palmer M A, Collins S L. Species diversity enhances ecosystem functioning through interspecific facilitation. Nature, 2002, 415(6870): 426–429. DOI:10.1038/415426a |
| [9] | Hu G, Jin Y, Liu J L, Yu M J. Functional diversity versus species diversity:relationships with habitat heterogeneity at multiple scales in a subtropical evergreen broad-leaved forest. Ecological Research, 2014, 29(5): 897–903. DOI:10.1007/s11284-014-1178-6 |
| [10] | Tilman D, Reich P B, Knops J, Wedin D, Mielke T, Lehman C. Diversity and productivity in a long-term grassland experiment. Science, 2001, 294(5543): 843–845. DOI:10.1126/science.1060391 |
| [11] | Mason N W H, Mouillot D, Lee W G, Wilson J B. Functional richness, functional evenness and functional divergence:the primary components of functional diversity. Oikos, 2005, 111(1): 112–118. DOI:10.1111/oik.2005.111.issue-1 |
| [12] | 张潋波, 刘东晓, 刘朔孺, 张勇, 童晓立, 王备新. 钱塘江中游水生昆虫群落功能多样性对土地利用变化的响应. 应用生态学报, 2013, 24(10): 2947–2954. |
| [13] | Bu W S, Zang R G, Ding Y. Functional diversity increases with species diversity along successional gradient in a secondary tropical lowland rainforest. Tropical Ecology, 2014, 55(3): 393–401. |
| [14] | Reynaga M C, Santos D A D. Contrasting taxonomical and functional responses of stream invertebrates across space and time in a Neotropical basin. Fundamental and Applied Limnology/Archiv für Hydrobiologie, 2013, 183(2): 121–133. DOI:10.1127/1863-9135/2013/0501 |
| [15] | De Bello F, Lepš J, Sebastià M T. Variations in species and functional plant diversity along climatic and grazing gradients. Ecography, 2006, 29(6): 801–810. DOI:10.1111/eco.2006.29.issue-6 |
| [16] | Li W, Cheng J M, Yu K L, Epstein H E, Guo L, Jing G H, Zhao J, Du G Z. Plant functional diversity can be independent of species diversity:observations based on the impact of 4-yrs of nitrogen and phosphorus additions in an alpine meadow. PLoS One, 2015, 10(8). |
| [17] | 薛倩妮, 闫明, 毕润成. 山西五鹿山森林群落木本植物功能多样性. 生态学报, 2015, 35(21): 7023–7032. |
| [18] | Lavorel S, Garnier E. Predicting changes in community composition and ecosystem functioning from plant traits:revisiting the Holy Grail. Functional Ecology, 2002, 16(5): 545–556. DOI:10.1046/j.1365-2435.2002.00664.x |
| [19] | Epler J H. Identification manual for the larval chironomidae (Diptera) of North and South Carolina. EPA Grant#X984170-97. Crawfordville, FL, America: EPA, 2001: 1–500. |
| [20] | Morse J C, Yang L F, Tian L X. Aquatic Insects of China Useful for Monitoring Water Quality. Nanjing: Hohai University Press, 1994: 1–568. |
| [21] | Brinkhurst R O. Guide to the Freshwater Aquatic Microdrile Oligochaetes of North America. Ottawa, Ontario, Canada:Canadian Special Publication of Fisheries and Aquatic Sciences 84 Department of Fisheries and Oceans, 1986: 1–259. |
| [22] | Poff N L, Olden J D, Vieira N K M, Finn D S, Simmons M P, Kondratieff B C. Functional trait niches of North American lotic insects:traits-based ecological applications in light of phylogenetic relationships. Journal of the North American Benthological Society, 2006, 25(4): 730–755. DOI:10.1899/0887-3593(2006)025[0730:FTNONA]2.0.CO;2 |
| [23] | Usseglio-Polatera P, Bournaud M, Richoux R, Tachet H. Biological and ecological traits of benthic freshwater macroinvertebrates:relationships and definition of groups with similar traits. Freshwater Biology, 2000, 43(2): 175–205. DOI:10.1046/j.1365-2427.2000.00535.x |
| [24] | Tachet H, Richoux P, Bournaud M, Usseglio-Polatera P. Invertebres d'Eau Douce:Systématique, Biologie, Écologie. Paris:CNRS Editions, 2002: 1–552. |
| [25] | Villéger S, Mason N W H, Mouillot D. New multidimensional functional diversity indices for a multifaceted framework in functional ecology. Ecology, 2008, 89(8): 2290–2301. DOI:10.1890/07-1206.1 |
| [26] | Mason N W H, MacGillivray K, Steel J B, Wilson J B. An index of functional diversity. Journal of Vegetation Science, 2003, 14(4): 571–578. DOI:10.1111/j.1654-1103.2003.tb02184.x |
| [27] | Casanoves F, Pla L, Di Rienzo J A, Díaz S. FDiversity:a software package for the integrated analysis of functional diversity. Methods in Ecology and Evolution, 2011, 2(3): 233–237. DOI:10.1111/mee3.2011.2.issue-3 |
| [28] | Townsend C R, Scarsbrook M R, Dolédec S. The intermediate disturbance hypothesis, refugia, and biodiversity in streams. Limnology and Oceanography, 1997, 42(5): 938–949. DOI:10.4319/lo.1997.42.5.0938 |
| [29] | Bêche L A, Mcelravy E P, Resh V H. Long-term seasonal variation in the biological traits of benthic-macroinvertebrates in two Mediterranean-climate streams in California, U.S.A. Freshwater Biology, 2006, 51(1): 56–75. DOI:10.1111/FWB.2006.51.issue-1 |
| [30] | Shannon C E. A mathematical theory of communication. The Bell System Technical Journal, 1948, 27(3): 379–423. DOI:10.1002/bltj.1948.27.issue-3 |
| [31] | Cadotte M W, Carscadden K, Mirotchnick N. Beyond species:functional diversity and the maintenance of ecological processes and services. Journal of Applied Ecology, 2011, 48(5): 1079–1087. DOI:10.1111/jpe.2011.48.issue-5 |
| [32] | Mason N W H, de Bello F, Doležal J, Lepš J. Niche overlap reveals the effects of competition, disturbance and contrasting assembly processes in experimental grassland communities. Journal of Ecology, 2011, 99(3): 788–796. DOI:10.1111/jec.2011.99.issue-3 |
| [33] | Mouchet M A, Villéger S, Mason N W H, Mouillot D. Functional diversity measures:an overview of their redundancy and their ability to discriminate community assembly rules. Functional Ecology, 2010, 24(4): 867–876. DOI:10.1111/fec.2010.24.issue-4 |
| [34] | Biswas S R, Mallik A U. Species diversity and functional diversity relationship varies with disturbance intensity. Ecosphere, 2011, 2(4): 52. |
| [35] | Devictor V, Mouillot D, Meynard C, Jiguet F, Thuiller W, Mouquet N. Spatial mismatch and congruence between taxonomic, phylogenetic and functional diversity:the need for integrative conservation strategies in a changing world. Ecology Letters, 2010, 13(8): 1030–1040. |
| [36] | Zhang J T, Xiao J T, Li L F. Variation of plant functional diversity along a disturbance gradient in mountain meadows of the Donglingshan reserve, Beijing, China. Russian Journal of Ecology, 2015, 46(2): 157–166. DOI:10.1134/S1067413615020058 |