 2016, Vol. 36
文章信息
- 周文昌, 索郎夺尔基, 崔丽娟, 王义飞, 李伟
- ZHOU Wenchang, SUOLANG Duoerji, CUI Lijuan, WANG Yifei, LI Wei
- 排水对若尔盖高原泥炭地土壤有机碳储量的影响
- Effects of drainage on soil organic carbon stock in the Zoige peatlands, eastern Qinghai-Tibetan Plateau
- 生态学报, 2016, 36(8): 2123-2132
- Acta Ecologica Sinica, 2016, 36(8): 2123-2132
- http://dx.doi.org/10.5846/stxb201411022148
-
文章历史
- 收稿日期: 2014-11-02
- 网络出版日期: 2015-08-18


2. 中国林业科学研究院湿地研究所, 湿地生态功能与恢复北京市重点实验室, 北京 100091;
3. 若尔盖湿地国家自然保护区管理局, 若尔盖 624500
2. Beijing Key Laboratory of Wetland Services and Restoration, Institute of Wetland Research, Chinese Academy of Forestry, Beijing 100091, China;
3. The Management Bureau of Zoige Wetland National Nature Reserve, Zoige 624500, China
泥炭地是指泥炭厚度至少为30 cm或有机质含量超过50%的湿地[1, 2]。泥炭地面积占地球陆地表面积的3%,土壤存储了4.0×10¹⁷—6.0×10¹⁷ g 碳(C)[3, 4, 5, 6],相当于全球陆地土壤0—100 cm有机碳储量(1.395×10¹⁸—1.576×10¹⁸ g)的25%—43%[7, 8, 9, 10]和大气中碳库(CO2-C) (7.96×10¹⁷ g)的50%—75%[11]。因此,泥炭地土壤有机碳储量的动态直接地影响大气中二氧化碳(CO2)的浓度和作为预测将来全球气候变化的一个重要因素[1, 3, 12]。
泥炭地长期作为大气净的吸收碳“汇”[3, 5, 13],使得泥炭地在千年尺度上具有全球变冷潜力[14]。不过气候持续地变暖[11, 15]和过去数百年间泥炭地遭受人类活动严重的破坏[1, 16],泥炭地可能转换为大气碳排放“源”[15, 17, 18]。据统计,泥炭地为了满足农业和林业发展需求而排水,以及泥炭开采等人类活动,导致全球泥炭地面积约减少5000万 hm2 (减少了12.5%)[1, 16]。研究指出泥炭地排水,导致水位下降,迅速地引起土壤有机质氧化分解,随后出现较高CO2排放通量[18, 19],以及增加了溶解性有机碳(Dissolved organic carbon,DOC)输出生态系统[20, 21],导致泥炭地碳储量降低[19, 22, 23],影响到大气中CO2的浓度,进一步加剧气候变暖[11]。另外,泥炭地排水引起了泥炭地表萎缩、压实和下沉,随后降低泥炭厚度[18]和增加土壤容重[24, 25]。泥炭深度和土壤容重又是影响泥炭地碳储量估算中尚存较大不确定性的主要因素[26, 27];同时,以前泥炭地碳储量的估算结论中未考虑气候变化和人类活动的影响[19, 28, 29, 30]。因此,为了准确地估算泥炭地土壤有机碳储量,以及它对将来气候变化的影响[1, 31],加大泥炭地排水与其他土地利用对土壤碳储量的影响研究,对于深刻认识泥炭地碳循环具有重要意义。
作为世界湿地面积最大的高山湿地分布区——青海-西藏高原的若尔盖湿地,湿地面积约为50万 hm2[32]。然而,自20世纪60—70年代以来,由于过度放牧、排水和泥炭开采等人类活动的加剧,导致了自然湿地严重的退化或者萎缩[33, 34, 35],据Chen等[36]报道若尔盖高原泥炭地退化了30%,甚至研究报道若尔盖泥炭沼泽湿地退化了62%—88%[37],泥炭湿地的退化可能已降低其湿地生态系统服务功能价值[32]。例如,仅为了满足放牧草地的需求,若尔盖高原湿地自从1955年挖沟排水以来,排水沟渠长度达到1200 km,累计改造泥炭沼泽面积超过20万 hm2,占据若尔盖湿地面积的40%[34, 38]。湿地大量地开渠排水改变了湿地水文条件和植被的变化,可能已导致若尔盖湿地土壤转变为碳释放源,导致湿地碳“汇”功能减弱[35, 38]。然而,有关湿地排水对若尔盖高原泥炭湿地碳储量的影响研究报道较少,根据Bai等[39]报道若尔盖湿地排水后,表层(0—30 cm)土壤有机碳储量与相对原始的泥炭湿地比较,研究结果指出,排水无显著影响土壤有机碳储量。因此,由于研究者的泥炭取样深度较浅,很难客评价若尔盖高原湿地排水后,泥炭湿地土壤有机碳储量的影响变化,为了更加准确地评价泥炭湿地排水对若尔盖高原湿地土壤有机碳储量的影响,应该增加取样深度,以便为我国政策决策者制定湿地保护和恢复提供可靠的基础数据。
1 研究区和研究方法 1.1 研究区概况若尔盖高原湿地位于青海-西藏高原东部边缘,西临巴颜克拉山,东抵岷山,南至邛崃山,为一块完整的丘状高原,行政上主要包括四川省红原县、若尔盖县,此外还包括甘肃省玛曲东南部、碌曲县南部以及青海省的久治县西南部,海拔高度为3400—3700 m[33, 34]。本区属于高原寒温带湿润气候,年均气温为0.7—1.1℃,最高和最低气温月份分别为7月和1月,月平均值为10.8℃和-10.6℃;年均降水量为656.8 mm,86%降雨量集中于4—10月[33]。地表性或长年积水生长的植物主要为木里苔草(Carex muliensis)和毛果苔草(C. lasiocarpa)等沼生植被,沼泽化草甸的代表性的植被为西藏嵩草(Kobresia tibetica)-花蹄驴蹄草(Caltha scaposa),土壤类型为草甸土和泥炭沼泽土[33, 34]。
1.2 研究方法 1.2.1 样地设置和取样方法2013年8月中旬,于研究区若尔盖高寒湿地生态系统定位研究站选取对照地(未排水地)和排水地两个样点开展研究,两个样点位于同一个湖泊湿地周围,使得泥炭沉积时间大概一致。对照地分为两种水位状态,即长期性积水和季节性积水状态,对照地具有凹凸不平的垄网状草丘和丘间洼地;排水样地为排水沟渠相距130、200、300m的泥炭地,排水年代大约为1970年左右,目前排水沟渠宽度为3—7 m,深度1—1.5 m,样地因排水和多年放牧,垄网状草丘已消失,并且出现危害草场动物黑唇鼠兔(Ochotana curzoniae)和中华鼢鼠(Myospalax sp.),随之出现较多鼠兔洞和土丘,样地趋向于退化阶段。以上每种水位状态重复选取3块30 m × 20 m 标准样地[30],共15块,每1块样地随机重复取样3个土壤剖面,取样深度至少为1 m,泥炭层超过1 m的土壤深度取样到灰色粘土层为止。土壤取样通过泥炭土壤不锈钢土钻(规格为内径5 cm,长度30 cm,附有螺旋状的延伸把柄),每取一次为30 cm的垂直剖面深度,样品分割按照10 cm 或者20—30 cm 为1个样品,每个样品通过保鲜袋密闭,保存于冷藏(4℃)条件下运回实验室。样地基本信息见表 1。
| 样点Site | 地理坐标Location | 海拔Elevation/m | 泥炭深度/cm | 水位(标准差)Water table (SD) | 优势植被类型 Characteristics for dominant plant in sites |
| CK1 | 33°55′8″N,102°49′8″E | 3441 | 150 | 13.1(12.3) | 木里苔草( Carex muliensis)、西藏嵩草( Kobresia tibetica)、水毛茛( Batrachium bungei)、狸藻( Utricularia vulgaris)、杉叶藻( Hippuris vulgaris) |
| CK2 | 33°55′8″N,102°49′8″E | 3441 | 150 | -22.7(22.5) | 西藏嵩草、花葶驴蹄草( Caltha scaposa)、木里苔草、委陵菜( Potentilla anserine)、矮金莲花( Trollius farreri)、矮火绒草( Leontopodium nanum) |
| D130 | 33°55′10″N,102°44′8″E | 3432 | 50 | -91.9(13.5) | 矮生嵩草( Kobresia humilis)、海乳草( Glaux maritime)、委陵菜、大翅蓟( Onopordum acanthium) |
| D200 | 33°55′10″N,102°44′8″E | 3432 | 50 | -89.1(16.8) | 矮生嵩草、委陵菜、华扁穗草( Blysmus sinocompressus)、海乳草、大翅蓟 |
| D300 | 33°55′10″N,102°44′8″E | 3432 | 50 | -88.7(11.8) | 矮生嵩草、委陵菜、华扁穗草、海乳草、大翅蓟 |
| CK1:对照地1 Control site 1;CK2:对照地2 Control site 2;D130、D200和D300分别代表排水沟渠相距的距离为130 m、200 m和300 m; 水位正值为地表之上,负值为地表之下 | |||||
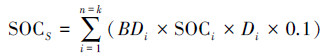
土壤有机碳储量是由土壤容重、土壤有机碳质量分数和深度决定的。土壤样品运回实验室,进行室内阴凉处风干处理2周后,同时移出土壤样品中粒径>2 mm的根系和岩石。然后为了防止高温下土壤有机碳损失,本实验样品放置于恒温箱温度设置为65 ℃烘干48h,直至恒重,计算土壤容重。土壤有机碳质量分数分析是将每个标准地的同一土层3个样品混合为1个样品,粉碎和通过120目筛(孔径为0.125 mm),其混合样品采用重铬酸钾氧化-外加热法测定土壤有机碳质量分数[40]。土壤有机碳储量(SOCS,tC/hm2)计算公式依据Ellert等[41]:
采用Excel 2010和SPSS 18.0 软件对数据进行统计分析。不同数据组之间采用单因素方差分析(one-way ANOVA)LSD多重比较方法进行检验。显著性水平设置为P=0.05,极显著性水平设置为P=0.01。
2 结果与分析 2.1 泥炭地排水对土壤容重的影响泥炭地排水显著地影响土壤容重(图 1)。泥炭地CK1、CK2、D130、D200和D300剖面土壤容重波动范围(平均值±标准差)分别为0.28—0.73(0.53±0.03)、0.35—0.67(0.46±0.09)、0.56—0.78(0.65±0.04)、0.46—0.77(0.60±0.02)、0.44—0.98(0.69±0.01)g/cm3,土壤容重随土壤深度增加而增加(图 1)。经统计分析表明:D130、D200和D300泥炭地0—30 cm土壤容重分别为(0.60±0.01)、(0.49±0.02)、(0.49±0.06) g/cm3,较对照地CK1分别增加了106.50%、69.95%、69.36%,而较对照地CK2分别增加了51.11%、24.36%、23.93%;D130、D200和D300泥炭地0—50 cm土壤容重分别为(0.58±0.02)、(0.48±0.02)、(0.54±0.10) g/cm3,较对照地CK1分别增加了75.36%、43.86%、61.00%,而较对照地CK2分别增加了50.41%、23.39%、38.10%;D130、D200和D300泥炭地0—100 cm土壤容重分别为(0.65±0.04)、(0.60±0.02)、(0.69±0.01) g/cm3,较对照地CK1分别增加了37.38%、26.61%、45.96%,而较对照地CK2分别增加了47.72%、36.14%、56.96%;D130、D200和D300泥炭地整个剖面土壤容重分别为(0.65±0.04)、(0.60±0.02)、(0.69±0.01) g/cm3,较对照地CK1分别增加了23.28%、13.62%、30.99%,而较对照地CK2分别增加了41.27%、30.20%、50.10%。泥炭地排水样点0—30、0—50、0—100 cm和整个剖面土壤容重平均值分别为(0.53±0.06)、(0.53±0.05)、(0.65±0.05) 、(0.65±0.05) g/cm3,分别较对照样点显著增加了57.53%、48.69%、41.79%和31.58%(P < 0.05)。

|
| 图 1 泥炭地不同深度土壤容重 Fig. 1 Bulk density for different soil depth in peatlands |
泥炭地排水对土壤有机碳质量分数具有影响(图 2)。泥炭地CK1、CK2、D130、D200和D300剖面土壤有机碳质量分数波动范围(平均值±标准差)分别为50.61—212.71(110.26±33.55)、82.69—202.32(156.25±51.18)、73.06—132.19(102.11±15.31)、53.44—179.20(112.09±2.69)和27.59—161.62(84.11±7.22)g/kg。泥炭地土壤有机碳质量分数垂直分布格局具有随土壤深度增加而降低的趋势。经过统计方差分析,泥炭地排水样点0—30、0—50、0—100 cm和整个剖面土壤有机碳质量分数与对照地比较,它们之间不存在差异显著(P>0.05)。尽管泥炭地排水样点0—30、0—50、0—100 cm和整个剖面土壤有机碳质量分数平均值分别为(144.05±13.59)、(143.22±19.03)、(99.44±14.18)和(99.44±14.18) g/kg,它们各自较对照样点分别降低了18.30%、16.49%、33.82%和23.09%,但它们之间并未达到显著性水平(P>0.05)。

|
| 图 2 泥炭地土壤有机碳质量分数 Fig. 2 Soil organic carbon mass fractions in peatlands |
泥炭地排水显著地影响土壤有机碳储量(图 3)。经过方差分析,泥炭地排水显著地影响一定土壤深度单位面积的土壤有机碳储量:泥炭地D130、D200和D300深度0—30 cm土壤有机碳储量分别为(230.92±13.10)、(229.17±9.32)、(214.17±12.99) tC/hm2,较对照地CK1分别增加了32.48%、31.47%和22.87%,而较对照地CK2分别增加了47.12%、46.00%和36.45%,使得泥炭地排水样点深度0—30 cm土壤有机碳储量极显著地较对照样点平均值增加了36.07%(或者(59.11±9.31) tC/hm2)(P < 0.01)。进一步对泥炭地排水样地和对照地泥炭地土壤深度0—50 cm和0—100 cm的土壤有机碳储量之间进行统计分析,它们之间无显著性差异(P>0.05)。当增加对照地完整的泥炭层取样,达到灰色粘土层后,泥炭地D130、D200和D300整个剖面的土壤有机碳储量分别为(641.97±85.51)、(606.34±33.10)、(473.72±43.81) tC/hm2,较对照地CK1分别降低了21.38%、25.74%和41.98%,而较对照地CK2分别降低了37.73%、41.18%和54.05%,导致了排水泥炭地样点较对照样点土壤有机碳储量极显著地降低了37.01%(或者(349.70±107.17) tC/hm2)(P < 0.01)。

|
| 图 3 泥炭地土壤有机碳储量 Fig. 3 Soil organic carbon stock in peatlands 注:不同字母表示不同处理之间的显著性差异,误差棒代表标准差(P < 0.05). |
本研究的若尔盖高原泥炭湿地土壤有机碳储量波动范围(473.72—1030.88 tC/hm2)位于已有报道的资料(表 2)。然而,本研究样点对照地泥炭地土壤有机碳储量为816.53和1030.88 tC/hm2,与三江平原和若尔盖高原泥炭地土壤有机碳储量吻合(828—1036 tC/hm2),但远远高于东北山地泥炭沼泽湿地土壤有机碳储量(90.1—521 tC/hm2)(表 2)。尽管泥炭地排水后,土壤有机碳储量降低,但是泥炭地土壤有机碳储量(473.72—641.79 tC/hm2)也远远高于大、小兴安岭土壤有机碳储量(90.1—382.8 tC/hm2),以及中国草地(87.9 tC/hm2)和森林生态系统土壤有机碳储量(193.55 tC/hm2)(表 2)。同时,排水泥炭地土壤有机碳储量的平均值((574.01±66.86) tC/hm2分别是中国陆地土壤0—100 cm平均有机碳储量[98.67 tC/hm2(91.7—108.3 tC/hm2)]和全球陆地[113.45 tC/hm2(100—121.6 tC/hm2)]的5.1和5.8倍;而对照地泥炭地土壤有机碳储量((923.71±107.18) tC/hm2)分别增加为8.1和9.4倍(表 2)。因此,这表明若尔盖高原湿地是陆地生态系一个重要的碳汇,进一步保护天然泥炭地和恢复退化泥炭地可能是缓减与适应气候变化的最低成本应对策略。
| 区域Region | 生态系统Ecosystems | 面积Area/(×103 hm2) | 土壤有机碳库SOC pool/(109t) | 土壤有机碳储量SOC stock/(t C hm2) | 参考文献References |
| 北方Boreal | 泥炭地 | 350000 | 270—370 | 771—1057 | [42] |
| 前苏联Former Soviet Union | 泥炭地 | 156000 | 215 | 1378 | [26] |
| 加拿大麦肯齐盆地Mackenzie River Basin | 泥炭地 | 803.808 | 0.982—1.025 | 530—1650 | [43] |
| 苏格兰Scottish | 泥炭地 | 1727 | 1.62 | 938 | [44] |
| 全球Global | 泥炭地 | 441350 | 612 | 1387 | [6] |
| 全球 | 泥炭地 | 400000 | 480 | 1200 | [4] |
| 全球 | 湿地 | 280000 | 202.4 | 723 | [7] |
| 全球 | 湿地 | 350000 | 225 | 643 | [45] |
| 中国China | 泥炭地 | 1042.6 | 2.17 | 1930 | [46] |
| 中国 | 泥炭地 | 1044 | 1.5 | 1436 | [47] |
| 三江平原Sanjiang plain | 泥炭地 | 400 | 828 | [28] | |
| 大兴安岭Daxing′anling | 泥炭沼泽 | 192.1—382.8 | [48] | ||
| 小兴安岭Xiaoxing′anling | 泥炭沼泽 | 90.1—354 | [30, 49, 50, 51] | ||
| 中国长白山Changbai Mountains | 泥炭沼泽 | 385—521 | [52] | ||
| 若尔盖高原Zoige Plateau | 泥炭地 | 460.5 | 0.477 | 1036 | [36] |
| 若尔盖高原Zoige Plateau | 沼泽草甸 | 345.181 | 0.245 | 708.4(648.7—764.5) | [40] |
| 中国China | 红树林湿地 | 22.025 | 0.00565 | 270.39 | [53] |
| 中国 | 湿地 | 22494265 | 5.04—6.19 | 224-275 | [54] |
| 中国 | 草地 | 331000 | 29.1 | 87.9(85—151) | [55] |
| 中国 | 森林 | 108620.7 | 21.023 | 193.55 | [56] |
| 中国 | 陆地 | 925450 | 100.18 | 108.3 | [57] |
| 中国 | 陆地 | 901140 | 82.65 | 91.7 | [58] |
| 中国 | 陆地 | 928100 | 89.14 | 96 | [59] |
| 全球Global | 陆地 | 12960000 | 1395.3 | 100 | [7] |
| 全球 | 陆地 | 12960000 [7] | 1576 | 121.6 | [8] |
| 全球 | 陆地 | 12960000 [7] | 1462—1548 | 112.8—119.4 | [9] |
| 若尔盖高原Zoige Plateau | 泥炭地 | 500 | 473.72—1030.88 | 本研究 |
泥炭地排水不仅引起泥炭土壤有机质氧化,而且影响土壤理化性质,诸如土壤容重、泥炭孔隙度和矿物质含量的变化,这将可能影响泥炭地土壤碳“汇”过程[60]。土壤容重是影响泥炭地土壤碳储量估算不确定性的主要因素之一[4, 26, 27, 42]。泥炭地排水后,引起地下水位大幅度下降(表 1),泥炭收缩,泥炭下沉而压实,导致表层(0—80 cm或者0—50 cm)土壤容重增加44%—63%[24, 25, 61],使得表层土壤有机碳储量累计速率较快[24],可能导致土壤有机碳储量增加[39, 62]。这与本研究的泥炭地排水导致0—30 cm土壤容重显著增加了57.53%,进一步增加土壤有机碳储量为36.07%吻合(图 1,图 3)。
不过,本研究样点泥炭地表30 cm以下的土壤容重也显著地增加了31.6%—48.7%,但土壤有机碳储量并未增加,反而降低了(图 1,图 3)。这可能是由于泥炭地排水后,水位大幅下降(表 1),泥炭有机质暴露于空气中,引起泥炭有机质氧化分解,泥炭层收缩,泥炭厚度降低[18],这可以从本研究的对照样点和排水样点的泥炭厚度得到证明(表 1)。例如,研究报道泥炭地排水后,尽管泥炭表层(0—60 cm 或0—70 cm)土壤容重增加44%—600%[18, 24, 60],但泥炭地排水导致了土壤有机碳储量降低了23.1—77.0 kg C m-2[18, 60];而森林泥炭地排水导致土壤有机碳储量降低了3.7—4.5 kg C/m2[22, 24]。泥炭地土壤有机碳储量的降低可能从土壤有机碳储量与深度呈显著正相关得到解释(图 4),这是由于泥炭深度是影响泥炭土壤碳储量估算中尚存不确定性因素主要原因之一[26, 27, 42, 43, 44],泥炭地土壤有机碳储量具有随泥炭厚度增加而增加的趋势[63]。因此,本研究排水泥炭地样点较对照地土壤有机碳储量降低了34.97 kg C m-2(或349.70 tC/hm2),可能是由于泥炭地排水后,泥炭厚度降低导致的。如果按照若尔盖高原湿地过去20世纪60—70年代排水计算,到目前为止排水年限约为40—50a,相当于土壤有机碳每年损失699.4—874.3 g C/m2,这个数值与其他研究的土壤碳损失位于同一数量级(131—690 gC m-2 a-1)[18, 22, 24, 60]。这种土壤有机碳的损失形式主要是以泥炭氧化(CO2)和淋溶冲刷的溶解性有机碳(DOC)损失[18, 22, 60],而据Leifeld等[60]研究报道泥炭地排水后,泥炭氧化解释了土壤碳损失达到28%—64%。但是某些学者研究报道,泥炭地排水造林后,土壤是大气碳“汇”,还是碳“源”,与地下水位、泥炭性质、土地利用和气候条件有关[60, 62, 64]。诸如,Minkkinen等[64]研究结果表明泥炭地养分不足的是土壤碳吸收“汇”,而养分充足的是土壤碳排放“源”。因此,进一步加大人类活动(尤其是泥炭地排水疏干)对泥炭地土壤有机碳储量的影响研究,对于开展泥炭地保护与恢复经营管理具有重要意义。

|
| 图 4 土壤深度和土壤有机碳储量的回归模型关系 Fig. 4 The regression equations for soil organic carbon stock and depth in peatlands |
本研究点位于若尔盖高原湿地,泥炭地排水导致了表层(0—30 cm)土壤容重增加,进而加速了土壤有机碳储量的累计速率,增加了表层土壤有机碳储量;然而,增加泥炭深度取样后,排水泥炭地土壤有机碳储量反而降低,可能源于泥炭地排水后,水位大幅度下降,导致了泥炭有机质快速氧化分解,进而降低土壤有机质厚度,降低了土壤有机碳储量。
致谢:本课题依托若尔盖高寒湿地生态系统定位研究站,得到若尔盖湿地国家级自然保护区管理局的支持和帮助,特此致谢。| [1] | Frolking S, Talbot J, Jones M C, Treat C C, Kauffman J B, Tuittila E S, Roulet N. Peatlands in the Earth's 21st century climate system. Environmental Reviews, 2011, 19(1): 371-396. |
| [2] | Maltby E, Immirzi P. Carbon dynamics in peatlands and other wetland soils, regional and global perspectives. Chemosphere, 1993, 27(6): 999-1023. |
| [3] | Gorham E. Northern peatlands: Role in the carbon cycle and probable responses to climatic warming. Ecological Applications, 1991, 1(2): 182-195. |
| [4] | Page S E, Rieley J O, Banks C J. Global and regional importance of the tropical peatland carbon pool. Global Change Biology, 2011, 17(2): 798-818. |
| [5] | Roulet N T. Peatlands, carbon storage, greenhouse gases, and the Kyoto protocol: Prospects and significance for Canada. Wetlands, 2000, 20(4): 605-615. |
| [6] | Yu Z C, Loisel J, Brosseau D P, Beilman D W, Hunt S J. Global peatland dynamics since the Last Glacial Maximum. Geophysical Research Letters, 2010, 37(13): L13402, doi: 10.1029/2010GL043584. |
| [7] | Post W M, Emanuel W R, Zinke P J, Stangenberger A G. Soil carbon pools and world life zones. Nature, 1982, 298(5870): 156-159. |
| [8] | Eswaran H, Van Den Berg E, Reich P. Organic carbon in soils of the world. Soil Science Society of America Journal, 1993, 57(1): 192-194. |
| [9] | Batjes N H. Total carbon and nitrogen in the soils of the world. European Journal of Soil Science, 1996, 47(2): 151-163. |
| [10] | Jobbágy E G, Jackson R B. The vertical distribution of soil organic carbon and its relation to climate and vegetation. Ecological Applications, 2000, 10(2): 423-436. |
| [11] | Solomon S, Qin D, Manning M,Chen Z, Marquis M, Averyt K B, Tignor M, Miller H L. Contribution Working Group I to the Fourth Assessment Report of the Intergovernmental Panel on Climate Change. Cambridge, United Kingdom and New York: Cambridge University Press, 2007. |
| [12] | Lal R. Soil carbon sequestration to mitigate climate change. Geoderma, 2004, 123(1/2): 1-22. |
| [13] | Clymo R S, Turunen J, Tolonen K. Carbon accumulation in peatland. Oikos, 1998, 81(2): 368-388. |
| [14] | Frolking S, Roulet N T. Holocene radiative forcing impact of northern peatland carbon accumulation and methane emissions. Global Change Biology, 2007, 13(5): 1079-1088. |
| [15] | Koehler A K, Sottocornola M, Kiely G.How strong is the current carbon sequestration of an Atlantic blanket bog? Global Change Biology, 2011, 17(1): 309-319. |
| [16] | Strack M. Peatlands andClimate Change. Saarijärven Offset Oy, Saarijärvi, Finland: International Peat Society Press, 2008: 9-23. |
| [17] | Maljanen M, Komulainen V M, Hytönen J, Martikainen P J, Laine J. Carbon dioxide, nitrous oxide and methane dynamics in boreal organic agricultural soils with different soil characteristics. Soil Biology and Biochemistry, 2004, 36(11): 1801-1808. |
| [18] | Kluge B, Wessolek G, Facklam M, Lorenz M, Schwärzel K. Long-term carbon loss and CO2-C release of drained peatland soils in northeast Germany. European Journal of Soil Science, 2008, 59(6): 1076-1086. |
| [19] | Turetsky M R, Louis V L S. Disturbance in boreal peatlands//Wieder R K. Vitt D H, eds. Boreal Peatland Ecosystems. Berlin Heidelberg: Springer-Verlag, 2006: 359-379. |
| [20] | Worrall F, Gibson H S, Burt T P. Modelling the impact of drainage and drain-blocking on dissolved organic carbon release from peatlands. Journal of Hydrology, 2007, 338(1): 15-27. |
| [21] | Armstrong A, Holden J, Kay P, Francis B, Foulger M, Gledhill S, McDonald A T, Walker A. The impact of peatland drain-blocking on dissolved organic carbon loss and discolouration of water; results from a national survey. Journal of Hydrology, 2010, 381(1/2): 112-120. |
| [22] | Simola H, Pitkänen A, Turunen J. Carbon loss in drained forestry peatlands in Finland, estimated by re-sampling peatlands surveyed in the 1980s. European Journal of Soil Science, 2012, 63(6): 798-807. |
| [23] | 崔巍, 牟长城, 卢慧翠, 包旭, 王彪. 排水造林对大兴安岭湿地生态系统碳储量的影响. 北京林业大学学报, 2013, 35(5): 28-36. |
| [24] | Pitkänen A, Turunen J, Tahvanainen T, Heikki S. Carbon storage change in a partially forestry-drained boreal mire determined through peat column inventories. Boreal Environment Research, 2013, 18(3/4): 223-234. |
| [25] | Minkkinen K, Laine J. Effect of forest drainage on the peat bulk density of pine mires in Finland. Canadian Journal of Forest Research, 1998, 28(2): 178-186. |
| [26] | Botch M S, Kobak K I, Vinson T S, Kolchugina T P. Carbon pools and accumulation in peatlands of the former Soviet Union. Global Biogeochemical Cycles, 1995, 9(1): 37-46. |
| [27] | 周文昌, 崔丽娟. 泥炭湿地碳储量核算与其影响因素分析. 土壤学报, 2014, 51(2): 226-237. |
| [28] | Zhang W J, Xiao H A, Tong C L, Su Y R, Xiang W S, Huang D Y, Syers J K, Wu J S. Estimating organic carbon storage in temperate wetland profiles in Northeast China. Geoderma, 2008, 146(1/2): 311-316. |
| [29] | Gorham E, Lehman C, Dyke A, Clymo D, Janssens J. Long-term carbon sequestration in North American peatlands. Quaternary Science Reviews, 2012, 58: 77-82. |
| [30] | 卢慧翠, 牟长城, 王彪, 包旭, 崔巍. 采伐对大兴安岭落叶松-苔草沼泽土壤有机碳储量的影响. 林业科学研究, 2013, 26(4): 459-466. |
| [31] | Burnham J H, Sletten R S. Spatial distribution of soil organic carbon in northwest Greenland and underestimates of high Arctic carbon stores. Global Biogeochemical Cycles, 2010, 24(3): GB3012, doi: 10.1029/2009GB003660. |
| [32] | Li J C, Wang W L, Hu G Y, Wei Z H. Changes in ecosystem service values in Zoige Plateau, China. Agriculture, Ecosystems & Environment, 2010, 139(4): 766-770. |
| [33] | Xiang S, Guo R Q, Wu N, Sun S C. Current status and future prospects of Zoige marsh in eastern Qinghai-Tibet Plateau. Ecological Engineering, 2009, 35(4): 553-562. |
| [34] | 赵魁义, 何池全. 人类活动对若尔盖高原沼泽的影响与对策. 地理科学, 2000, 20(5): 444-449. |
| [35] | 白军红, 欧阳华, 王庆改, 高海峰, 丁秋祎. 大规模排水前后若尔盖高原湿地景观格局特征变化. 农业工程学报, 2009, 25(S1): 64-68. |
| [36] | Chen H, Yang G, Peng C H, Zhang Y, Zhu D, Zhu Q A, Hu J, Wang M, Zhan W, Zhu E X, Bai Z Z, Li W, Wu N, Wang Y F, Gao Y H, Tian J Q, Kang X M, Zhao X Q, Wu J H. The carbon stock of alpine peatlands on the Qinghai-Tibetan Plateau during the Holocene and their future fate. Quaternary Science Reviews, 2014, 95: 151-158. |
| [37] | 刘玉红, 白云芳. 若尔盖高原湿地资源变化过程与机制分析. 自然资源学报, 2006, 21(5): 810-818. |
| [38] | Zhang W J, Lu Q F, Song K C, Qin G H, Wang Y, Wang X, Li H X, Li J, Liu G D, Li H. Remotely sensing the ecological influences of ditches in Zoige peatland, eastern Tibetan Plateau. International Journal of Remote Sensing, 2014, 35(13): 5186-5197. |
| [39] | Bai J H, Ouyang H, Xiao R, Gao J Q, Gao H F, Cui B S, Huang L B. Spatial variability of soil carbon, nitrogen, and phosphorus content and storage in an alpine wetland in the Qinghai-Tibet Plateau, China. Soil Research, 2010, 48(8): 730-736. |
| [40] | 蔡倩倩, 郭志华, 胡启鹏, 武高洁. 若尔盖高寒嵩草草甸湿地不同水分条件下土壤有机碳的垂直分布. 林业科学, 2013, 49(3): 9-16. |
| [41] | Ellert B H, Janzen H H, VandenBygaart A J, Bremer E. Measuring change in soil organic carbon storage//Carter M R, Gregorich E G, eds. Soil Sampling and Methods of Analysis. 2nd ed. Boca Raton: CRC Press, 2008: 25-38. |
| [42] | Turunen J, Tomppo E, Tolonen K, Reinikainen A. Estimating carbon accumulation rates of undrained mires in Finland-application to boreal and subarctic regions. The Holocene, 2002, 12(1): 69-80. |
| [43] | Beilman D W, Vitt D H, Bhatti J S, Forest S. Peat carbon stocks in the southern Mackenzie River Basin: Uncertainties revealed in a high-resolution case study. Global Change Biology, 2008, 14(6): 1221-1232. |
| [44] | Chapman S J, Bell J, Donnelly D, Lilly A. Carbon stocks in Scottish peatlands. Soil Use and Management, 2009, 25(2): 105-112. |
| [45] | IPCC (Intergovernmental Panel on Climate Change). Land Use, Land Use Change and Forestry: A special report of the IPCC. Cambridge, UK: Cambridge University Press, 2000. |
| [46] | Wang M, Chen H, Wu N, Peng C H, Zhu Q A, Zhu D, Yang G, Wu J H, He Y X, Gao Y H, Tian J Q, Zhao X Q. Carbon dynamics of peatlands in China during the Holocene. Quaternary Science Reviews, 2014, 99: 34-41. |
| [47] | Liu Z G, Wang M, Ma X H. Estimation of storage and density of organic carbon in peatlands of China. Chinese Geographical Science, 2012, 22(6): 637-646. |
| [48] | 牟长城, 王彪, 卢慧翠, 包旭, 崔巍. 大兴安岭天然沼泽湿地生态系统碳储量. 生态学报, 2013, 33(16): 4956-4965. |
| [49] | 满秀玲, 刘斌, 李奕. 小兴安岭草本泥炭沼泽土壤有机碳、氮和磷分布特征. 北京林业大学学报, 2010, 32(6): 48-53. |
| [50] | 蔡体久, 辛国辉, 张阳武, 戴潇漩, 刘斌. 小兴安岭泥炭藓湿地土壤有机碳分布特征. 中国水土保持科学, 2010, 8(5): 109-113. |
| [51] | 周文昌, 牟长城, 刘夏, 顾韩. 火干扰对小兴安岭白桦沼泽和落叶松-苔草沼泽凋落物和土壤碳储量的影响. 生态学报, 2012, 32(20): 6387-6395. |
| [52] | Bao K S, Yu X F, Jia L, Wang G P. Recent carbon accumulation in Changbai Mountain peatlands, northeast China. Mountain Research and Development, 2010, 30(1): 33-41. |
| [53] | Liu H X, Ren H, Hui D F, Wang W Q, Liao B W, Cao Q X. Carbon stocks and potential carbon storage in the mangrove forests of China. Journal of Environmental Management, 2014, 133: 86-93. |
| [54] | Zheng Y M, Niu Z G, Gong P, Dai Y J, Wei S G. Preliminary estimation of the organic carbon pool in China's wetlands. Chinese Science Bulletin, 2013, 58(6): 662-670. |
| [55] | Fang J Y, Yang Y H, Ma W H, Mohammat A, Shen H H. Ecosystem carbon stocks and their changes in China's grasslands. Science China Life Sciences, 2010, 53(7): 757-765. |
| [56] | 周玉荣, 于振良, 赵士洞. 我国主要森林生态系统碳贮量和碳平衡. 植物生态学报, 2000, 24(5): 518-522. |
| [57] | 王绍强, 周成虎. 中国陆地土壤有机碳库的估算. 地理研究, 1999, 18(4): 349-356. |
| [58] | 李克让, 王绍强, 曹明奎. 中国植被和土壤碳贮量. 中国科学 D 辑: 地球科学, 2003, 33(1): 72-80. |
| [59] | Yu D S, Shi X Z, Wang H J, Sun W X, Chen J M, Liu Q H, Zhao Y C. Regional patterns of soil organic carbon stocks in China. Journal of Environmental Management, 2007, 85(3): 680-689. |
| [60] | Leifeld J, Müller M, Fuhrer J. Peatland subsidence and carbon loss from drained temperate fens. Soil Use and Management, 2011, 27(2): 170-176. |
| [61] | Silins U, Rothwell R L. Forest peatland drainage and subsidence affect soil water retention and transport properties in an Alberta peatland. Soil Science Society of America Journal, 1998, 62(4): 1048-1056. |
| [62] | Minkkinen K, Laine J. Long-term effect of forest drainage on the peat carbon stores of pine mires in Finland. Canadian Journal of Forest Research, 1998, 28(9): 1267-1275. |
| [63] | Cannell M G R, Dewar R C, Pyatt D G. Conifer plantations on drained peatlands in Britain: A net gain or loss of carbon? Forestry, 1993, 66(4): 353-369. |
| [64] | Minkkinen K, Vasander H, Jauhiainen S, Karsisto M, Laine J. Post-drainage changes in vegetation composition and carbon balance in Lakkasuo mire, Central Finland. Plant and Soil, 1999, 207(1): 107-120. |