 2016, Vol. 36
文章信息
- 刘晔, 石磊
- LIU Ye, SHI Lei.
- 工业生态系统多样性评述
- Critical review on industrial diversity indicators
- 生态学报[J]. 2016, 36(22): 7302-7309
- Acta Ecologica Sinica[J]. 2016, 36(22): 7302-7309
- http://dx.doi.org/10.5846/stxb201608181694
-
文章历史
- 收稿日期: 2016-08-18
- 修订日期: 2016-11-18


Fisher和Williams [1]提出了生物多样性的概念, 生物多样性是指在一定时间和一定地区所有生物物种及其遗传变异和生态系统的复杂性总称。在生态学理论中, 多样性是生态系统稳定性的基础, 反映了不同尺度生态系统的演化过程, 影响着生态系统的结构和功能[2-4], 因此是生态学的核心概念之一。作为自然生态系统的人工类比物, 工业生态系统的多样性同样也受到了工业生态学和产业经济学等领域的广泛关注。
对于工业生态系统而言, 每一产业都对工业生态系统过程有贡献, 但不同产业的贡献在数量和特征上都存在差异。20世纪30年代的经济大萧条促使了人们对于经济发展稳定性的思考, McLaughlin提出了工业多样性(Industrial diversity)的概念[5], 旨在探讨在对区域经济影响最小的前提下获得最优的工业组成结构[6]。其后, 工业多样性成为产业经济学和区域经济学持续关注的一个研究主题, 重点比较不同地区产业结构的相似性, 寻求最优的产业组成和结构[6-9]。
工业生态学学科的建立重新激发了对工业多样性的研究, 工业生态学重在从产业组成和分布的角度来探讨对工业生态系统过程的影响, 强调多样性的产业格局对地区经济稳定和经济增长的作用[10-11]。
本文旨在归纳评述工业多样性相关的理论背景、相关指标及其政策含义。在比较工业生态系统与自然生态系统异同的基础上梳理了工业多样性定义的发展, 对现有工业多样性指标进行归纳整理, 比较各指标的优缺点, 为工业生态系统中工业多样性的评估提供理论支持, 为地区工业结构的科学调整和政策制定提供合理建议。
1 工业生态系统与自然生态系统的类比工业生态系统与自然生态系统在结构和功能上有诸多相似的特征[12-13]。同时, 工业生态学还强调工业生态系统与自然生态系统的耦合, 强调使整个循环向原有的自然生态系统靠拢, 即实现物质流动的封闭循环, 在物质利用方面实现循环而不产生多余的废物[14-16]。
1.1 组成类比自然系统以生物为主体, 由于外来物种入侵或生态环境恶化, 超出了生态系统的自我调节能力, 使得生态系统逐渐走向衰退。自然生态系统中, 物种分布是不均匀的, 在纬度较低、气候季节变化较小, 以及地形异质性高的地区, 物种多样性较高[17-19]。作为生物多样性最主要的结构和功能单位[20-21], 物种多样性(species diversity)研究的首要前提是多样性的测度与评判, 包括α多样性(群落内多样性)、β多样性(群落间多样性)、γ多样性(区域多样性)三个尺度[22], 研究的主体是物种, 而不同物种的数量、分布及差异构成了物种多样性。
与自然生态系统类似, 在工业生态系统中, 工业的数量和结构在不同的区间也存在着差异。其空间尺度可划分为区域内、区域间和地区多样性三个尺度。研究的主体是工业产业部门, 产业的企业数量、均匀度等结构特征组成工业多样性[23]。
与自然生态系统不同, 工业生态系统是以人类活动为主体的社会经济系统[24], 生态系统中各要素均受人类高强度的调控, 当生态环境恶化之后, 企业往往能够较为迅速地作出反应, 调节自身的结构, 以适应环境的变化。
1.2 功能类比工业生态系统与自然生态系统都存在包含生产者、消费者、分解者的食物链, 以进行物质、能量和信息的存储和交换。
自然生态系统中, 以绿色植物为代表的初级生产者通过光合作用从环境中获取、转化物质和能量, 而各种异养生物作为高级生产者直接或间接地消费绿色植物产品、形成新的有机物质, 其产品会再被其他动物和微生物消费, 沿着食物链向前移动。能量和物质沿着食物链逐级递减, 呈现出金字塔形。系统较为封闭, 各级生产者的生产力或以生物量为形式存留于系统中, 或被系统内的高级生产者加以利用, 只有少量以动物迁徙等形式离开原系统、进入其他生态系统[25]。生产者生产的有机物质全部留在系统内, 许多化学元素在系统内循环平衡, 是一个自给自足的系统。
工业系统中, 采矿业、能源产业等初级生产者将自然环境中的资源和能源移入系统, 这些物质和能量又被制造业这一高级生产者加以利用;工业过程所产生的一系列固体废弃物、废水和废气, 被分解者废旧资源再利用, 重新进入产业链循环, 否则将直接排入环境并带来污染等环境问题[26]。物质流从生产者流向消费者, 价值流的方向与之相反, 从消费者流向生产者。受运输和贸易等人类行为的影响, 系统较为开放, 由于工业产品的输出, 使原先在系统循环的营养物质离开了系统, 为了维持工业生态系统的稳定, 需要外部生态系统输入物质和能量。
2 工业多样性概念的发展早期大部分文献对工业多样性概念的定义主要借鉴生物多样性指标, 考虑工业种类数量和工业分布均匀程度基础上, 认为工业种类越多、分布越均匀, 工业多样性越高。工业多样性即为“一个地区存在的大量不同类型的工业”[27], “区域经济活动在一定种类的经济活动间的分布程度”[28], 或“不同工业间就业的均衡”[29]。基于这一多样性概念, 两个地区的工业种类数量一样, 就业在各工业间的概率分布一样, 但是两个地区工业多样性的含义却可能截然不同[30]。并且这种传统的关于工业多样性的认识忽略了工业多样性的多层次特性[31-32], 以及不同工业间的相互联系[33-35]。
20世纪70年代以来, 为了研究区域的工业组成、发展与经济稳定性的关系[7-8, 36-37], 基于不同工业间的经济联系和区域产业组合, 认为工业多样性不是基于行业数量和区域经济活动的分布, 而是基于工业之间的相互作用和联系。Collroy最先提出把投资组合理论(Markowitz portfolio approach)[7]应用到工业多样性的研究中, 把多样的工业看作地区的投资组合, 投资组合的方差矩阵反映工业间的相互作用以及工业多样性。Wundt和Martin [38]提出运用投入-产出模型(input-output modeling)[35]来分析工业多样性, 将一个地区的经济结构依据生产、消费和贸易之间的关系来模型化, 把工业多样性分解为各行业对区域经济直接和间接的影响。
Frenken [39]基于工业可逐级细分的特性, 提出了相关多样性(related variety)和不相关多样性(unrelated variety)的概念。明显具有技术替代性或互补性特征的细分产业间多样性称为相关多样性, 相关多样性水平高的区域具有较高的就业增长率;不具有显著技术替代性或互补性特征的产业间多样性则为非相关多样性, 非相关多样性仅对降低地区失业率具有正外部性[39-41]。
3 工业多样性指标的梳理对工业多样性的定义从简单到复杂, 工业多样性指标也随着对概念理解的深入不断发展。本文对研究中应用较多的赫芬达尔-赫希曼指数(Herfindhl-Hirschman Index)、圆拱指数(Ogive Index)、国家平均指数(National Averages Index)、克鲁格曼相似性指数(Krugman Similarity Index)、区位基尼系数(Locational Gini Coefficient Index)、工业结构相似性系数(Similarity Coefficient Index)、郡相似性指数(County Similarity Index)、熵指数(Entropy Index)、投资组合方差指数(Portfolio Variance Index)、结构变化指数(Structural Change Index)等工业多样性指标进行分类整理(表 1);依据理论依据的不同, 从工业种类数量和分布均匀程度、工业的可逐级细分性, 以及工业间的经济联系和区域产业组合三个角度将这10个指标分为三组。
| 分类Classification | 指标Index | 含义Meaning | 计算公式Calculation formula | 计算说明Calculation instruction |
| 工业种类数量和分布均匀程度 | 赫芬达尔-赫希曼指数 | 指数越小, 多样性越高;指数越大, 多样性越低。 |  |
si=i地区的产业总数, e=全国经济总值(就业、收入、产值), ei=i地区的经济总值, es=全国第s种产业类型的经济总值, esi=i地区第s种产业类型的经济总值, p是常数(1或2)。 |
| 圆拱指数 | 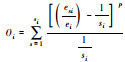 |
|||
| 国家平均指数 | 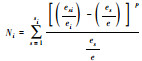 |
|||
| 克鲁格曼相似性指数 | 指数越大, 多样性越高;指数越小, 多样性越低。 | 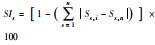 |
Ss, i=i地区第s种产业类型的经济总值占i地区经济总值的比例, Ss, n=i地区的经济总值占全国经济总值的比例, n为i地区的产业总数。 | |
| 区位基尼系数 | Gk的范围为0~0.5, 指数越小, 多样性越高, 指数越大, 多样性越低。 | 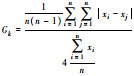 |
n=地区数, xi=i地区第s种产业类型的经济总值占i地区经济总值的比例, xj=j地区第s种产业类型的经济总值占j地区经济总值的比例. | |
| 工业结构相似性系数 | Sij的范围为0~1, 指数越大, 相似度越大;指数越小, 相似度越低。 |  |
n为产业数, 且k=1, 2, …, n;Xik为区域i中第k个产业占i地区经济总值的比例;Xjk为区域j中第k个产业占j地区经济总值的比例。 | |
| 郡相似性指数 | 指数越大, 多样性越高;指数越小, 多样性越低。 |  |
i=地区数, j=产业数, xij=i地区第j种产业类型的经济总值 | |
| 工业的可逐级细分性 | 熵指数 | 指数越大, 多样性越高;指数越小, 多样性越低。 | 总多样性: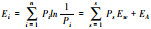 相关多样性: 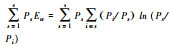 不相关多样性:  |
Pi为某地区某产业类型的经济总值占该地区经济总值的比例, s个大类部门, n个小类部门(n≥s), Ew部门内多样性, EA部门间多样性 |
| 工业间的经济联系和区域产业组合 | 投资组合方差指数 | 指数越小, 多样性越高;指数越大, 多样性越低。 | 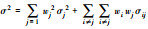 |
wi、wi是第i、j种产业类型所占的份额, σj2是第j种产业类型的方差, σij是i、j两种产业类型的协方差。 |
| 结构变化指数 | SCIt的范围为0—100,0代表时间t-1与t之间没有结构上的变化,100代表结构完全改变。 | 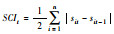 |
sit是t时间第i种产业类型所占的份额. |
基于工业种类数量和分布均匀程度的多样性指数, 主要包括赫芬达尔-赫希曼指数(Herfindhl-Hirschman Index)[42]、圆拱指数(Ogive Index)[27, 43]、国家平均指数(National Averages Index)[44-45]。这三个多样性指标是工业多样性的经典指标, 应用最多最普遍[9]。
其中国家平均指数(National Averages Index)依据区域商业周期理论, 认为某一个区域的部门组成与全国的部门组成越相似, 那么该区域相比其它区域就越稳定。
应用较多的还有郡相似性指数(County Similarity Index, CS-Index) [9]、工业结构相似性系数(Similarity Coefficient Index)[46], 克鲁格曼相似性指数(Krugman Similarity Index)[47-49]和区位基尼系数(Locational Gini Coefficient Index)[49-51]四个指标。
3.2 基于工业的可逐级细分性考虑工业可逐级细分性的多样性指数, 主要为熵指数(Entropy Index)[34], 通过将工业多样性分解为部门内多样性(within-set aspects)和部门间多样性(between-set aspects)两个层次[31], 区分相关多样性和不相关多样性(related variety, unrelated variety)[32, 40]。
3.3 基于工业间的经济联系和区域产业组合考虑工业间的经济联系和区域产业组合的多样性指数, 主要包括基于投资组合理论的投资组合方差指数(Portfolio Variance Index)[35, 52-54]和基于投入-产出模型的结构变化指数(Structural Change Index)[55-58]。
4 工业多样性指标的比较对这10个工业多样性指标, 依据自然生态系统中多样性的划分原则从空间尺度、时间尺度和政策含义, 以及基于工业特性的因素、可分解性、工业间的联系, 还有操作可行性共7方面进行归类整理, 并总结各指标的优缺点(表 2)。
| 评价准则Criterion | |||||||
| 因素Factors | 空间尺度Spatial scale | 时间尺度Time scale | 工业层级Industrial hierarchy | 产业组合Industrial combination | 操作可行性Operational feasibility | 政策含义Policy implications | |
| 赫芬达尔-赫希曼指数Herfindhl-Hirschman Index | 单因素 | 区域内 | 无 | 不考虑 | 不考虑 | 简单 | 工业分布集聚性 |
| 圆拱指数Ogive Index | 单因素 | 区域内 | 无 | 不考虑 | 不考虑 | 简单 | 工业分布均匀性, 经济稳定性 |
| 国家平均指数National Averages Index | 单因素 | 区域内 | 无 | 不考虑 | 不考虑 | 简单 | 工业组成与基准的相似性, 经济稳定性 |
| 克鲁格曼相似性指数Krugman Similarity Index | 单因素 | 区域内 | 无 | 不考虑 | 不考虑 | 简单 | 工业组成与基准的相似性 |
| 区位基尼系数Locational Gini Coefficient Index | 多因素 | 区域内 | 无 | 不考虑 | 不考虑 | 复杂 | 工业分布集聚性, 工业组成与基准的相似性 |
| 工业结构相似性系数Similarity Coefficient Index | 单因素 | 区域间 | 无 | 不考虑 | 不考虑 | 简单 | 不同地区的工业组成同构性 |
| 郡相似性指数County Similarity Index | 多因素 | 区域内 | 无 | 不考虑 | 不考虑 | 简单 | 工业组成与基准的相似性, 经济稳定性 |
| 熵指标Entropy Index | 单因素 | 区域内 | 无 | 考虑 | 不考虑 | 简单 | 工业分布集聚性, 工业分布均匀性, 经济稳定性 |
| 投资组合方差指数Portfolio Variance Index | 多因素 | 区域内 | 无 | 不考虑 | 考虑 | 复杂 | 经济稳定性 |
| 结构变化指数Structural Change Index | 多因素 | 区域内 | 有 | 不考虑 | 考虑 | 复杂 | 工业组成随时间的变化 |
赫芬达尔-赫希曼指数(Herfindhl-Hirschman Index)、圆拱指数(Ogive Index)、国家平均指数(National Averages Index)、克鲁格曼相似性指数(Krugman Similarity Index), 都是针对单一经济活动的分布情况, 运用单一因素(例如就业或生产增加值)来量化多样性[9], 计算方法相对容易, 但直观性比较差。
国家平均指数(National Averages Index)以全国的工业组成为最佳组合, 但是这一假设忽略了区域间自然资源和要素(劳动和资本), 以及不同尺度市场发展的差异[9];此外经济活动在全国的分布是随时间不断变化的, 这也会影响区域和国家工业组成的变化[29], 因此经济活动在全国范围内的分布很难作为判断地区工业多样性随时间变化的标准。
圆拱指数(Ogive Index)以部门经济活动绝对均匀分布为完全多样, 以经济活动的实际分布偏离基准的程度作为判断产业多样性的标准[59], 这个基准比国家平均指数(National Averages Index)更加客观, 能够判断一个地区随时间是否变得多样化。但是也没有理由认为区域经济应该均匀的分布[9], 因为不同地区需求模式、生产技术、偏好都存在差异。而且这一指数容易受到数据选取的影响, 使用不同种类的数据度量得到结果可能差异很大。
郡相似性指数(County Similarity Index, CS-Index)是一种改进的算法[9], 它可以同时运用多种因素来对多样性进行多元评价, 通过加总不同因素来获取一个总的标量值(scalar value), 再运用这个标量值进行地区间的对比。这一指数虽然也利用了全国的产业组合, 但不是每个地区都应该仿照全国的产业组合, 而是利用该地区可以获得的最高资源水平, 认为更多样的地区拥有该国更多份额的资源或经济活动。
区位基尼系数(Locational Gini Coefficient Index)运用多因素量化集中度[51], 可以清晰的反映每个工业部门是否有集聚现象以及集聚的程度, 以及区域内各产业部门与全国总体平均水平的差异, 还可以进行地区间的对比[27], 因此是一个较为全面的分析手段, 但其计算较为复杂, 应用偏少。
工业结构相似性系数(Similarity Coefficient Index)是对区域间工业组成的比较, 直接反映了工业结构的同构性, 而其随时间的变化趋势则反映了区域产业结构趋同或趋异的整体趋势。
熵指数(Entropy Index)基于热力学第二定律--熵定律, 拥有科学的基础, 具有可分解的属性, 可以进行不同层次的分析, 且计算方法简单[29, 60]。熵指数判断多样性的基准为经济活动平均分布, 与圆拱指数(Ogive Index)一致[34, 59]。但其不能反映区域经济发展水平的差异性, 某产业区位熵最大的地区不一定是该产业集聚水平最高的地区;而且由于熵指数假定投资平均分布为最优, 忽略了不同工业之间内在的相互依赖关系[9, 33]。
投资组合方差指数(Portfolio Variance Index)广泛应用于区域研究中[7, 35, 54]。它同时考虑了单个行业收入的稳定性, 以及不同行业之间的相互联系, 通过改变不同产业的相对份额来降低经济不稳定性[34, 61], 以达到投资组合方差最小化, 计算复杂, 且没有适用于所有区域的统一模型。而且, 降低投资组合方差虽然可以稳定经济, 却可能不利于经济增长, 因此将投资组合方差最小作为区域最优产业组合是很片面的。
许多研究认为, 结构变化指数(Structural Change Index)比其他多样性指标能更好的度量工业多样性[34-35, 38, 62], 但这一方法所需样本量很大, 数据难以获取[8, 29, 36], 其效果也需要进一步实证检验的证实[63]。
5 结论和讨论综上所述, 工业多样性是工业生态系统研究的重要组成部分。由于工业多样性计算方法很多, 且受多种因素的影响, 在指标选取时存在一定的难度, 目前还没有一个合理的测度指标可以准确的反映工业多样性, 每一种指数所反映的工业生态系统过程其视角或侧重点各不相同, 并且有各自的优缺点, 各种工业多样性指数间存在一定的互补作用。因此在实际应用中, 结合数据情况、研究尺度和研究目的, 选择多个指标, 对结果综合比较, 是一种比较合理的方法。此外, 工业多样性对工业生态系统影响的研究大多集中于工业多样性与经济稳定性[10]、区域规模[64]、产业结构[65]和市场结构[66-67]的关系, 尚未见对于不同观察尺度工业多样性的变化特点和机理的研究, 这一研究对深入理解工业生态系统发展的过程有非常重要的作用, 也是一项极具创新性的研究内容。
| [1] | Fisher R A, Corbet A S, Williams C B. The relation between the number of species and the number of individuals in a random sample of an animal population. The Journal of Animal Ecology , 1943, 12 (1) : 42–58. DOI:10.2307/1411 |
| [2] | Loreau M. Biodiversity and ecosystem functioning:recent theoretical advances. Oikos , 2000, 91 (1) : 3–17. DOI:10.1034/j.1600-0706.2000.910101.x |
| [3] | Tilman D. Causes, consequences and ethics of biodiversity. Nature , 2000, 405 (6783) : 208–211. DOI:10.1038/35012217 |
| [4] | McCann K S. The diversity-stability debate. Nature , 2000, 405 (6783) : 228–233. DOI:10.1038/35012234 |
| [5] | McLaughlin G E. Industrial diversification in American cities. The Quarterly Journal of Economics , 1930, 45 (1) : 131–149. DOI:10.2307/1882529 |
| [6] | Dissart J C. Regional economic diversity and regional economic stability:research results and agenda. International Regional Science Review , 2003, 26 (4) : 423–446. DOI:10.1177/0160017603259083 |
| [7] | Conroy M E. The concept and measurement of regional industrial diversification. Southern Economic Journal , 1975, 41 (3) : 492–505. DOI:10.2307/1056160 |
| [8] | Wagner J E. Regional economic diversity:action, concept, or state of confusion. Journal of Regional Analysis and Policy , 2000, 30 (2) : 1–22. |
| [9] | Mack E, Grubesic T H, Kessler E. Indices of industrial diversity and regional economic composition. Growth and Change , 2007, 38 (3) : 474–509. DOI:10.1111/grow.2007.38.issue-3 |
| [10] | Izraeli O, Murphy K J. The effect of industrial diversity on state unemployment rate and per capita income. The Annals of Regional Science , 2003, 37 (1) : 1–14. DOI:10.1007/s001680200100 |
| [11] | Berliant M, Fujita M. The dynamics of knowledge diversity and economic growth. Southern Economic Journal , 2011, 77 (4) : 856–884. DOI:10.4284/0038-4038-77.4.856 |
| [12] | Graedel T E. On the concept of industrial ecology. Annual Review of Energy and the Environment , 1996, 21 (1) : 69–98. DOI:10.1146/annurev.energy.21.1.69 |
| [13] | Erkman S. Industrial ecology:an historical view. Journal of cleaner production , 1997, 5 (1) : 1–10. |
| [14] | Lowenthal M D, Kasterberg W E. Industrial ecology and energy systems:a first step. Resources, conservation and recycling , 1998, 24 : 51–63. DOI:10.1016/S0921-3449(98)00028-7 |
| [15] | 郝新波. 工业生态学基本理论及其应用初探. 太原科技 , 2000, 3 : 1–4. |
| [16] | Graedel T E. Peer reviewed:The evolution of industrial ecology. Environmental science & technology , 2000, 34 (1) : 28–31. |
| [17] | Pianka E R. Latitudinal gradients in species diversity:a review of concepts. American Naturalist , 1966, 100 (910) : 33–46. DOI:10.1086/282398 |
| [18] | Currie D J. Energy and large-scale patterns of animal and plant species richness. American Naturalist , 1991, 137 : 27–49. DOI:10.1086/285144 |
| [19] | Rohde K. Latitudinal gradients in species diversity:the search for the primary cause. Oikos , 1992, 65 : 514–527. DOI:10.2307/3545569 |
| [20] | Dybzinski R, Fargione J E, Zak D R, Fornara D A, Tilmam D. Soil fertility increases with plant species diversity in a long-term biodiversity experiment. Oecologia , 2008, 158 : 85–93. DOI:10.1007/s00442-008-1123-x |
| [21] | Flombaum P, Sala O E. Higher effect of plant species diversity on productivity in natural than artificial ecosystems. Proceedings of the National Academy of Sciences , 2008, 105 : 6087–6090. DOI:10.1073/pnas.0704801105 |
| [22] | Whittaker R H. Evolution and measurement of species diversity. Taxon , 1972, 21 : 213–251. DOI:10.2307/1218190 |
| [23] | 林道辉, 朱利中. 工业生态学的演化与原理. 重庆环境科学 , 2002, 24 (4) : 14–17. |
| [24] | Graede T E, Allenby B R. Industrial Ecology. New Jersey: Pearson Education, 2003. |
| [25] | Odum E P. The Strategy of Ecosystem Development. Science , 1969 (164) : 262–270. |
| [26] | Lowe E A, Evans L K. Industrial ecology and industrial ecosystems. Journal of Cleaner Production , 1995, 3 (1) : 47–53. |
| [27] | Rodgers A. Some aspects of industrial diversification in the United States. Economic Geography , 1957, 33 (1) : 16–30. DOI:10.2307/142564 |
| [28] | Parr J B. Specialization, diversification and regional development. The Professional Geographer , 1965, 17 (6) : 21–25. DOI:10.1111/j.0033-0124.1965.021_h.x |
| [29] | Attaran M, Zwick M. Entropy and Other Measures of Industrial Diversification. Quarterly Journal of Business and Economics , 1987, 26 : 17–34. |
| [30] | Mizuno K, Mizutani F, Nakayama N. Industrial diversity and metropolitan unemployment rate. Annals of Regional Science , 2006, 40 (1) : 157–172. DOI:10.1007/s00168-005-0046-2 |
| [31] | Attaran M. Industrial diversity and economic-performance in United States Areas. Annals of Regional Science , 1986, 20 (2) : 44–54. DOI:10.1007/BF01287240 |
| [32] | Koen F, Frank V O, Thijs V. Related variety, unrelated variety and regional economic growth. Regional Studies , 2007, 41 (7) : 685–697. |
| [33] | Conroy M E. Alternative strategies for regional industrial diversification. Journal of Regional Science , 1974, 14 (1) : 31–46. DOI:10.1111/jors.1974.14.issue-1 |
| [34] | Siegel P B, Johnson T G, Alwang J. Regional economic diversity and diversification. Growth and Change , 1995, 26 (2) : 261–284. DOI:10.1111/grow.1995.26.issue-2 |
| [35] | Wagner J E, Deller S C. Measuring the effects of economic diversity on growth and stability. Land Economics , 1998, 74 (4) : 541–556. DOI:10.2307/3146884 |
| [36] | Kort J R. Regional economic instability and industrial diversification in the US. Land Economics , 1981, 57 (4) : 596–608. DOI:10.2307/3145674 |
| [37] | Spelman W. Growth, stability, and the urban portfolio. Economic Development Quarterly , 2006, 20 (4) : 299–316. DOI:10.1177/0891242406291491 |
| [38] | Wundt B D, Martin L R. Minimizing employment instability:A model of industrial expansion with input-output considerations. Regional Science Perspectives , 1993, 23 (1) : 81–93. |
| [39] | Frenken K, Van Oort F, Verburg T. Related variety, unrelated variety and regional economic growth. Regional studies , 2007, 41 (5) : 685–697. DOI:10.1080/00343400601120296 |
| [40] | Boschma R, Iammarino S. Related variety, trade variety and regional growth in Italy. Papers In Evolutionary Economic Geography , 2008, 85 (3) : 289–311. |
| [41] | Boschma R, Frenken K. The emerging empirics of evolutionary economic geography. Journal of Economic Geography , 2011, 11 (2) : 295–307. DOI:10.1093/jeg/lbq053 |
| [42] | Rhoades S A. The Herfindahl-Hirschman index. Federal Reserve Bulletin , 1993, 79 : 188. |
| [43] | Tress R C. Unemployment and the diversification of industry. The Manchester School , 1938, 9 (2) : 140–152. DOI:10.1111/j.1467-9957.1938.tb01420.x |
| [44] | Bahl R, Firestine R, Phares D. Industrial diversity in urban areas:Alternative measures and intermetropolitan comparisons. Economic Geography , 1971, 47 : 414–425. DOI:10.2307/142818 |
| [45] | Lynch L K. Economic structure and economic performance. Regional Science Perspectives , 1979, 9 : 84–95. |
| [46] | Secchi C.World Industry Since 1960:progress and prospects.New York:United Nations Industrial Development Organization, 1981. |
| [47] | BernatJr G A, Repice E S. Industrial composition of state earnings in 1958-1998. Survey of Current Business , 2000, 80 (2) : 70–78. |
| [48] | Kim S. Expansion of markets and the geographic distribution of economic activities:The trends in U.S.regional manufacturing structure, 1860-1987. The Quarterly Journal of Economics , 1995, 110 (4) : 881–908. DOI:10.2307/2946643 |
| [49] | Krugman P R. Geography and trade. Cambridge: Massachusetts Institute of Technology, 1991. |
| [50] | Kim Y, Barkley D L, Henry M S. Industry characteristics linked to establishment concentrations in nonmetropolitan areas. Journal of Regional Science , 2000, 40 (2) : 231–259. |
| [51] | Sohn J. Do birds of a feather flock together:Economic linkage and geographic proximity. The Annals of Regional Science , 2004, 38 (1) : 47–73. DOI:10.1007/s00168-003-0145-x |
| [52] | Markowitz H. Portfolio selection. The journal of finance , 1952, 7 (1) : 77–91. |
| [53] | Hunt G L, Sheesley T J. Specification and econometric improvements in regional portfolio diversification analysis. Journal of Regional Science , 1994, 34 (2) : 217–236. DOI:10.1111/jors.1994.34.issue-2 |
| [54] | Trendle B. An analysis diversification strategies in regional Queensland using a two-region, portfolio selection model. Australasian Journal of Regional Studies , 2011, 17 (2) : 102–121. |
| [55] | Connolly E, Lewis C. Structural change in the Australian economy. Rba Bulletin , 2010, 4 : 1–9. |
| [56] | Connolly E, Orsmond D.The mining industry:from bust to boom.Sydeny:Reserve Bank of Australia, 2011. |
| [57] | Parham D.Australia's productivity growth slump:Signs of crisis, adjustment or both? Canberra:Productivity Commission, 2012. |
| [58] | Productivity Commission.Looking Back on Structural Change in Australia:2002-2012.Canberra:Supplement to Annual Report 2011-12, 2013. |
| [59] | Wasylenko M J, Erickson R A. On measuring economic diversification-Comment. Land Economics , 1978, 54 (1) : 106–109. DOI:10.2307/3146208 |
| [60] | Malizia E E, Ke S. The influence of economic diversity on unemployment and stability. Journal of Regional Science , 1993, 33 (2) : 221–235. DOI:10.1111/jors.1993.33.issue-2 |
| [61] | Schoening N C, Sweeney L E. Proactive industrial development strategies and portfolio analysis. The Review of Regional Studies , 1992, 22 (3) : 227–238. |
| [62] | Siegel P B, Alwang J, Johnson T G. Toward an improved portfolio variance measure of regional economic stability. The Review of Regional Studies , 1994, 24 (1) : 71–86. |
| [63] | 张德常. 产业多样性的度量方法. 统计与决策 , 2010, 8 : 28–30. |
| [64] | Duranton G, Puga D. Diversity and specialisation in cities:why, where and when does it matter?. Urban studies , 2000, 37 (3) : 533–555. DOI:10.1080/0042098002104 |
| [65] | Gourlay A, Seaton J. The determinants of firm diversification in UK quoted companies. Applied Economics , 2004, 36 (18) : 2059–2071. DOI:10.1080/0003684042000295610 |
| [66] | Scherer F M. Schumpeter and plausible capitalis. Journal of economic literature , 1992, 30 : 1416–1433. |
| [67] | Bishop P, Wiseman N. External ownership and innovation in the United Kingdom. Applied Economics , 1999, 31 (4) : 443–450. DOI:10.1080/000368499324156 |