 2016, Vol. 36
文章信息
- 高猛, GAOMeng
- 植物空间分布格局中邻体距离的概率分布模型及参数估计
- Nearest neighbor distance in spatial point patterns of plant species-probability distribution model and parameter estimation
- 生态学报[J]. 2016, 36(14): 4406-4414
- Acta Ecologica Sinica[J]. 2016, 36(14): 4406-4414
- http://dx.doi.org/10.5846/stxb201412182517
-
文章历史
- 收稿日期: 2014-12-18
- 网络出版日期: 2015-10-30


2. Key Laboratory of Coastal Environmental Processes and Ecological Remediation, Yantai Institute of Coastal Zone Research, Chinese Academy of Sciences, Yantai 264003, China
植物种群空间分布格局是指特定时间内, 植物群落中某一种群的个体在空间的分布状况[1-3]。空间分布格局分析对于确定种群特征、种群间相互关系以及种群与环境之间的关系具有非常重要的作用, 对于了解种群空间分布规律以及种内与种间关系具有重要的意义[4-7]。按照种群内个体的聚集程度和方式, 种群分布格局一般可分为随机分布、均匀分布和聚集分布3种类型[8]。以频度/密度为基础的样方法和以距离为基础的无样地法属于两大类确定植物空间分布格局的研究方法[3-5, 9]。植物群落调查实践表明无样地法比于样方法在成本和可操作性两方面均有一定的优势[10]。
最近邻体法(nearest neighbor method, NN)属于无样地法之一,它最早由Clark和Evans[11]提出,以观测点与个体之间的距离(或者个体与个体之间的距离)为原始数据获取分析指标,用统计检验的方法考察实际值与理论期望值之间的差异显著性,进而判断种群的空间分布类型。Stoyan和Penttinen[12]指出最近邻体距离特别是高阶邻体距离的概率分布比一般的分析指标可以更好地量化空间分布格局。Thompson[13]早在1956年便推导出了随机分布格局中邻体距离的概率分布模型,Eberhardt[14]则给出了聚集分布格局中随机观测点到相邻个体距离的概率分布模型,Magnussen[15-16]等基于Eberhardt的概率分布模型提出了植物空间密度的点估计方法。在随机分布格局中,任意选择的观测点到其相邻个体距离与任意选择的个体到其相邻个体距离在统计学意义上是一致的,因此二者的概率分布模型也是一样的[6]。聚集分布格局中,任意选择的观测点到相邻个体距离和个体到个体距离并不一致,二者的概率分布模型也不相同。Gao[5]利用条件概率的极限法推导出聚集分布格局下的个体到相邻个体的概率分布模型,并以巴拿马Barro Colorado岛(Barro Colorado Island, BCI)样地183个热带雨林树种的空间分布数据进行了验证,结果表明该概率分布模型可以较好地拟合大多数树种的邻体距离分布。Gao[6]等利用该模型研究了BCI样地中树种分布多尺度特征,并总结出5类空间聚集指数-邻体距离阶数曲线。BCI样地属于热带雨林,物种丰富且大多数树种被证实在空间中聚集分布[17],这与Gao[5]模型的基本条件一致。本文的第一个研究目标是利用Gao[5]的邻体距离概率分布模型拟合加拿大西海岸南温哥华岛3个寒温带树种的空间分布数据,以检验该模型在北方森林的适用性。
Eberhardt概率分布模型含两个参数,概率密度函数的表达式较复杂。Magnussen[15-16]等在利用Eberhardt模型进行密度估计时采用了极大似然法(maximum likelihood),参数优化则基于Nealder-Mead算法。Gao模型与Eberhardt模型的概率密度函数的表达式相似,并通过求解极大似然数值方程来完成参数估计[5-6]。以上两种参数估计方法均属于极大似然法的范畴,当模型样本较少时,其求解过程可能只得到局部最优解而非全局最优解[16]。遗传算法(genetic algorithm)是一种通过模拟自然进化过程搜索最优解的方法,其主要特点是:直接对结构对象进行操作,不存在求导和函数连续性的限定,具有更好的全局寻优能力;采用概率化的寻优方法,能自动获取和指导优化的搜索空间,自适应地调整搜索方向,不需要确定的规则。遗传算法的这些性质,使其成为现代智能计算中的关键技术。本文的第二个研究目标是采用遗传算法估计Gao模型的两个参数,解决极大似然法数值优化不能得到全局最优解的问题。
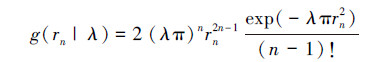
1 模型植物空间分布格局分析中,将个体的空间位置映射到二维空间上的点,形成空间点格局。空间点格局在统计学中被认为是空间点过程的一个实现[18]。空间点过程最基本的属性是过程强度λ(s),即位置s单位面积内的期望点数。随机分布的空间点格局,λ(s)为常量,对应一个Poisson过程。定义随机采样点到其第n个相邻个体的距离为随机变量rn,其概率分布模型的密度函数为[13]:
 (1)
(1)
式中, n记为邻体距离的阶数。如果假设λ(s)服从均值为λ的Gamma分布h(λ|α, β),则面积A的样地内点的个数服从期望为λA的负二项分布[19]。负二项分布是聚集分布格局分析中最普遍的概率分布模型[4]。将Gamma分布h(λ|α, β)带入模型(1),通过计算卷积可以得到聚集空间分布格局中rn的概率密度函数[15]:
 (2)
(2)
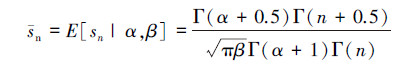
式中, α>0,β>0,且满足λ=α×β,Γ()为Gamma函数。需要估计的两个模型参数为α和β。定义任意个体到其第n个相邻个体的距离定义为随机变量sn,聚集分布点格局中,sn的概率密度函数为[5]:
 (3)
(3)
模型(3)与模型(2)的表达式相似,利用邻体距离的样本数据可以估计α和β的值。
2 数据与方法 2.1 数据本文以加拿大西海岸3个寒温带树种的空间分布数据验证概率分布模型(3)。研究区位于不列颠哥伦比亚省的南温哥华岛(48°38′N, 123°43′W),样地大小为102m×87m(0.8874hm2),平均海拔382m[20](图 1)。3个树种分别为西部红柏(Western red cedar, Thuja plicata),美国花旗松(Douglas-fir, Pseudotsuga menziesii),以及西部铁杉(Western hemlock, Tsuga heterophylla)。在统计个体到个体的邻体距离时,为避免边缘效应,在样地边界设置5m的缓冲区,即靠近样地边界5m内的个体不作统计,共计西部红柏337棵,美国花旗松508棵,西部铁杉767棵。

|
| 图 1 3个树种的空间分布点格局 Fig. 1 Spatial distribution point patterns of three tree species |
遗传算法是人工智能领域中用于解决最优化的一种启发式算法,这种算法借鉴了进化生物学中的一些现象,包括遗传、突变、自然选择以及杂交等[21]。图 2展示了8位编码的遗传算法计算流程图。选取适当的目标函数,便可以利用遗传算法估计模型(3)的参数。本研究中遗传算法是在数学软件MATLAB2008[22]环境下实现的,并编写遗传、突变、自然选择以及杂交4个计算过程的通用函数。

|
| 图 2 遗传算法的计算流程图 Fig. 2 Computation flowchart of Genetic Algorithm |
根据模型(3)概率密度的表达式,可以分别计算随机变量sn的期望和方差:
 (4)
(4)
 (5)
(5)
根据公式(4)和(5),可以在σ2/sn2式约去参数β,可以简化参数估计的计算量,遗传算法的目标函数定义为:
 (6)
(6)
ε越接近于0,参数估计值

为验证参数估计结果,概率分布模型(3)的拟合优度采用Kolmogorov-Smirnov(KS)检验,检验统计量KS定义为:
 (7)
(7)
式中, T(sn)和O(sn)分别为n阶邻体距离不大于sn的拟合及实际概率。
3 结果西部红柏(T.plicata)空间分布格局的聚集度比较高,具有团簇分布的特征。对目标区域内每一棵西部红柏个体计算到其周围邻体的距离,获得各阶邻体距离样本,然后利用概率分布模型拟合这些邻体距离样本,参数估计采用2.2—2.3中的遗传算法完成。表 1展示的是西部红柏(T.plicata)的各阶邻体距离概率分布模型的参数估计和拟合优势度检验结果,其中邻体距离的阶数为n=1, 2, …, 7。为了更直观地展示模型的拟合结果,图 3给出了n=1, 3, 5, 7时实际和拟合的概率密度函数以及对应的概率分布函数,其中概率分布函数为概率密度函数的累积值。对于概率密度函数,实际的概率密度函数比拟合的概率密度函数向左偏(图 3)。对于概率分布函数,在邻体距离值比较小的时候,拟合的概率分布小于实际概率分布,当邻体距离的值变大后,拟合的概率分布由大于实际概率分布。这种拟合与实际概率分布的不一致性是由于西部红柏(T.plicata)的团簇聚集分布特征导致的。当n=4时,实际和拟合的概率分布偏差最大,检验统计量KS=0.1909。参数
| 模型参数 Model parameters | n=1 | n=2 | n=3 | n=4 | n=5 | n=6 | n=7 |
|
| 0.4642 | 0.5548 | 0.5983 | 0.5949 | 0.5765 | 0.6343 | 0.6585 |
|
| 0.2154 | 0.1808 | 0.1623 | 0.156 | 0.1543 | 0.1398 | 0.1336 |
| KS | 0.1352 | 0.1322 | 0.1667 | 0.1909 | 0.1770 | 0.1629 | 0.1651 |

|
| 图 3 西部红柏(T. plicata)的邻体距离概率密度函数(左侧纵坐标)及概率分布函数(右侧纵坐标) Fig. 3 Probability density (left y-axis) /distribution functions (right y-axis) of nearest neighbor distance of Western red cedar (T. plicata) |
美国花旗松(P.menziesii)在样地中分布广泛,几乎不存在聚集的团簇(图 1)。由于概率分布模型(3)适用于随机分布和聚集分布[5],模型(3)可以较好地拟合美国花旗松(P.menziesii)的邻体距离分布。表 2给出了参数估计和拟合优势度检验的结果,并且在图 4中部分展示了拟合的概率密度函数和概率分布函数。受直方图的自身的限制,实际的和拟合的概率密度函数在视觉上有一定的差异,但是概率分布函数的一致性却很好(图 4)。当n=4时,实际和拟合的概率分布偏差最大,检验统计量KS=0.0739。由于美国花旗松在样地中具有随机分布的特征,
| 模型参数 Model parameters | n=1 | n=2 | n=3 | n=4 | n=5 | n=6 | n=7 |
|
| 49.3 | 51.1 | 50.2 | 49.7 | 52.4 | 53.1 | 51.6 |
|
| 0.0011 | 0.0013 | 0.0013 | 0.0013 | 0.0013 | 0.0014 | 0.0014 |
| KS | 0.0477 | 0.0549 | 0.0559 | 0.0739 | 0.0736 | 0.0592 | 0.0675 |

|
| 图 4 美国花旗松(P. menziesii)的邻体距离概率密度函数(左侧纵坐标)及概率分布函数(右侧纵坐标) Fig. 4 Probability density (left y-axis)/distribution functions (right y-axis) of nearest neighbor distance of Douglas-fir (P. menziesii) |
表 3给出了西部铁杉(T.heterophylla)邻体距离概率分布模型的参数估计和拟合优势度检验的结果。从表 3和图 5可以看出,实际的概率密度函数(概率分布函数)与拟合的概率密度函数(概率分布函数)一致性较好。西部铁杉(T.heterophylla)在样地中分布广泛,虽然也属于聚集分布,但团簇型的分布特征不是太明显,与概率分布模型(3)的假设一致。同样,当n=4时实际和拟合的概率偏差最大,检验统计量KS=0.0754。此外,
| 模型参数 Model parameters | n=1 | n=2 | n=3 | n=4 | n=5 | n=6 | n=7 |
|
| 0.699 | 0.7965 | 0.8938 | 0.9343 | 0.9784 | 1.0534 | 1.1313 |
|
| 0.2528 | 0.2152 | 0.1816 | 0.1672 | 0.1602 | 0.1485 | 0.1389 |
| KS | 0.0649 | 0.0641 | 0.0693 | 0.0754 | 0.0753 | 0.0491 | 0.063 |

|
| 图 5 西部铁杉(T. heterophylla)的邻体距离概率密度函数(左侧纵坐标)及概率分布函数(右侧纵坐标) Fig. 5 Probability density (left y-axis) /distribution functions (right y-axis) of nearest neighbor distance of Western hemlock (T. heterophylla) |
本文根据聚集分布格局中邻体距离(个体到个体)的概率分布模型期望和方差的特性,提出了一种简化的参数估计方法,利用遗传算法实现参数优化,并以加拿大南温哥华岛3个寒温带树种的空间分布数据进行了实例验证,得到的主要结论如下:
(1)通过定义合适的目标函数,可以简化模型参数估计的计算量,遗传算法可以有效地估计邻体距离概率模型的参数;
(2)西部红柏(T.plicata)和西部铁杉(T.heterophylla)的空间聚集度比较高,美国花旗松(P.menziesii)在样地中近似随机分布,Gao[5]的邻体距离概率分布模型可以很好地拟合西部铁杉(T.heterophylla)和美国花旗松(P.menziesii)的邻体距离概率分布。
邻体距离概率分布模型(3)的表达式较为复杂,Gao[5]在利用极大似然估计的方法估计模型参数时,定义了一个带有绝对值的目标函数。因此,参数估计问题转化为二维参数空间上的数值最优化问题。在计算过程中,样本的选择会影响数值优化算法的结果,特别是当邻体距离的样本较少时,会得到局部最优解而非全局最优解。本文提出利用遗传算法估计模型(3)的参数α和β,在定义目标函数(6)之后将参数估计问题转化为一维参数空间上的数值最优化问题。遗传算法在的作用是作为一种数值最优化技术解决一维参数空间上的数值最优化问题。然而,该方法仍然不能有效解决当样本少的时候估计不准确的问题。首先,本文提出的参数方法实质上是一种矩估计方法。矩法估计方法的优点是原理简单、使用方便,使用时可以不知总体的分布。理论上讲,矩法估计是以大样本为应用对象的,只有在样本容量较大时,才能保障它的优良性。因此,准确估计参数的关键是获得足够的邻体距离样本,这对两种估计方法都很重要。遗传算法本身对参数估计的精度不具有决定性作用。
邻体距离概率分布模型(3)是从聚集空间点格局的负二项分布模型推导而来的,参数α与负二项分布模型中的聚集指数k等价,其本身就与空间尺度相关[23-24]。植物空间分布格局分析中空间尺度概念涉及3个方面:研究区域的尺度、生态过程尺度和取样尺度[2, 25]。利用邻体距离分析空间分布格局也受到尺度的影响,在实际应用中需要关注取样尺度,即邻体距离的阶数。选取比较小的阶数会忽略掉较多的空间信息,选取较大的阶数会增加群落调查的工作量,并且还会受到边际效应的影响[5],所以建议采用的阶数是2到6。然而,模型(3)本身也有一定的局限性,因此在拟合聚集度较高的空间点格局的邻体距离时的,拟合效果并不理想[5-6],以及本文中的西部红柏的邻体距离分布。拟合效果不理想的原因有两个:1)实际的概率分布会出现多峰值的现象;2)实际概率向左倾斜的较多。针对以上两个问题,可以从以下2个方面进行改进:1)改进概率分布模型,例如采用混合型概率分布;2)采用高阶的邻体距离,使得概率分布右移。下一步的研究可以尝试采用人工智能方法对极大似然估计的目标函数进行优化,可以避免在样本较少的情况下不能得到全局最优解。
| [1] | Gaston Kevin J. Rarity. London: Chapman and Hall, 1994. |
| [2] | Fortin Marie Josee, Dale Mark R T. Spatial analysis:a guide for ecologists. Cambridge: Cambridge University Press, 2005. |
| [3] | 王本洋, 余世孝. 种群分布格局的多尺度分析[J]. 植物生态学报 , 2005, 29 (2) : 235–241. |
| [4] | 兰国玉, 雷瑞德. 植物种群空间分布格局研究方法概述[J]. 西北林学院学报 , 2003, 18 (2) : 17–21. |
| [5] | Gao M. Detecting spatial aggregation from distance sampling:a probability distribution model of nearest neighbor distance[J]. Ecological Research , 2013, 28 : 397–405. DOI:10.1007/s11284-013-1029-x |
| [6] | Gao M, Wang X X, Wang D. Species spatial distribution analysis using nearest neighbor methods:aggregation and self-similarity[J]. Ecological Research , 2014, 29 : 341–349. DOI:10.1007/s11284-014-1131-8 |
| [7] | Wiegand Thorsten, Moloney Kirk A. Rings, circles, and null models for point pattern analysis in ecology[J]. Oikos , 2004, 104 (2) : 209–229. DOI:10.1111/oik.2004.104.issue-2 |
| [8] | Pielou E C. A single mechanism to account for regular, random and aggregated populations[J]. Journal of Ecology , 1960, 48 : 575–584. DOI:10.2307/2257334 |
| [9] | 戴小华, 余世孝. GIS支持下的种群分布格局分析[J]. 中山大学学报(自然科学版) , 2003, 42 : 75–78. |
| [10] | Picard Nicolas, Kouyaté Amadou M, Dessard Hélène. Tree density estimations using a distance method in Mali Savanna[J]. Forest Science , 2005, 51 (1) : 7–18. |
| [11] | Clark Philip J, Evans Francis C. Distance to nearest neighbor as a measure of spatial relationships in populations[J]. Ecology , 1954, 35 (4) : 445–453. DOI:10.2307/1931034 |
| [12] | Stoyan Dietrich, Penttinen Antti. Recent applications of point process methods in forestry statistics[J]. Statistics Science , 2000, 15 : 61–78. DOI:10.1214/ss/1009212674 |
| [13] | Thompson H R. Distribution of distance to n-th nearest neighbor in a population of randomly distributed individuals[J]. Ecology , 1956, 37 (2) : 391–394. DOI:10.2307/1933159 |
| [14] | Eberhardt L L. Some developments in distance sampling[J]. Biometrics , 1967, 23 : 207–216. DOI:10.2307/2528156 |
| [15] | Magnussen Steen, Kleinn C, Picard N. Two new density estimator for distance sampling[J]. European Journal of Forest Research , 2008, 127 (3) : 213–224. DOI:10.1007/s10342-007-0197-z |
| [16] | Magnussen Steen, Fehrman Lutz, Platt William J. An adaptive composite density estimator for k-tree sampling[J]. European Journal of Forest Research , 2012, 131 (2) : 307–320. DOI:10.1007/s10342-011-0502-8 |
| [17] | Richard Condit, Peter S Ashton, Patrik Baker, Sarayudh Bunyavejchewin, Savithri Gunatilleke, Nimal Gunatilleke, Stephen P Hubbell, Roin B Foster, Akira Itoh, James V Lafrankie, Hua Sen Lee, Elizabeth Losos, N Manokaran, R Sukumar, Tauo Yamakura. Spatial patterns in the distribution of tropical tree species[J]. Science , 2000, 288 (5470) : 1414–1418. DOI:10.1126/science.288.5470.1414 |
| [18] | Diggle Peter J. Statistical analysis of spatial point patterns.2nd ed. London: Arnold, 2003. |
| [19] | Magnussen S, Picard N, Kleinn C. A Gamma-Poisson distribution of point to k nearest event distance[J]. Forest Science , 2008, 54 (4) : 429–441. |
| [20] | He F L, Duncan R P. Density-dependent effects on tree survival in an old-growth Douglas fir forest[J]. Journal of Ecology , 2000, 88 (4) : 676–688. DOI:10.1046/j.1365-2745.2000.00482.x |
| [21] | 周明, 孙树栋. 遗传算法原理与应用. 北京: 国防工业出版社, 1999. |
| [22] | MATLAB Tutorial, The MathWorks http://www.mathworks.cn. |
| [23] | He F L, Gaston K J. Estimating species abundance from occurrence[J]. American Naturalist , 2000, 156 (5) : 553–559. DOI:10.1086/303403 |
| [24] | Hui C, Veldtman Ruan, McGeoch Melode A. Measures, perceptions and scaling patterns of aggregated species distributions[J]. Ecography , 2010, 33 (1) : 95–102. DOI:10.1111/eco.2010.33.issue-1 |
| [25] | Dungan J L, Perry J N, Dale M R T, Legendre P, Citron-Pousty S, Fortin M J, Jakomulska A, Miriti M, Rosenberg M S. A balanced view of scale in spatial statistical analysis[J]. Ecography , 2002, 25 (5) : 626–640. DOI:10.1034/j.1600-0587.2002.250510.x |