 2015, Vol. 35
文章信息
- 刘驰, 李家宝, 芮俊鹏, 安家兴, 李香真
- LIU Chi, LI Jiabao, RUI Junpeng, AN Jiaxing, LI Xiangzhen
- 16S rRNA基因在微生物生态学中的应用
- The applications of the 16S rRNA gene in microbial ecology: current situation and problems
- 生态学报, 2015, 35(9): 2769-2788
- Acta Ecologica Sinica, 2015, 35(9): 2769-2788
- http://dx.doi.org/10.5846/stxb201306181726
-
文章历史
- 收稿日期:2013-06-18
- 网络出版日期:2014-05-22


2. 环境微生物四川省重点实验室, 中国科学院成都生物研究所, 成都 610041;
3. 中国科学院大学, 北京 100049
2. Environmental Microbiology Key Laboratory of Sichuan Province, Chengdu Institute of Biology, Chinese Academy of Sciences, Chengdu 610041, China;
3. University of Chinese Academy of Sciences, Beijing 100049, China
微生物是地球上数量最多和多样性最高的生物,1g土壤中仅细菌就可能有109个。由于大多数微生物尚不能纯培养,传统的微生物研究方法,如显微镜微形态观察、选择性培养基计数、纯菌种分离和生理生化鉴定等,在微生物多样性研究中都存在很大的局限性。基于非培养基础上的分子生物学方法可以使人们快速、系统地分析环境样品中微生物组成、结构和多样性,极大地促进了微生物生态学的发展。Zuckerkandl等首次提出使用基因序列作为分子钟来分析生物间的亲缘关系[1]。Woese和Fox基于16S rRNA基因序列对原核生物的系统进化关系进行了分析,提出了著名的“三域学说”[2]。从此,16S rRNA基因成为了最常用的生物标志物,广泛应用于微生物的系统进化、分类及多样性研究中。基于16S rRNA信息的系统分类结果与基于全基因组信息的分类结果很相似[3]。随着测序技术的发展,人们可以更加快捷地获得环境样品中的16S rRNA基因序列,这些序列信息可以和数据库中的已知信息进行比对,以研究环境样品中微生物群落的特点。本文主要针对当前使用16S rRNA基因分析微生物群落结构和多样性的现状进行总结,重点讨论当前技术的发展状况和存在的主要问题。
1 16S rRNA基因的特点微生物rRNA在漫长的进化过程中,由于其在碱基组成、核苷酸序列、高级结构及生物功能等方面表现出高度保守性而有微生物“化石”之称。保守性能够反映微生物之间的亲缘关系,为系统发育重建提供线索。然而rRNA的序列组成也不是完全保持恒定的,其具有一定的可变性,这种可变性能够反应出不同微生物的特征核酸序列,可以作为微生物多样性分析的分子基础。原核微生物的rRNA按沉降系数可以分为5S、16S和23S rRNA,大小分别约为120 bp、1540 bp和2904 bp左右(以Escherichia coli为例)。5S rRNA的基因序列较短,易于测定,但是由于其缺乏足够的遗传信息,不适用于系统分类研究;相反,23S rRNA含有的核苷酸序列较长,分析较困难。16S rRNA占细菌总RNA量的80%以上,基因序列长短适中,其结构中既有保守区域,又有变异区域,是较好的生物标志物。人们根据16S rRNA基因不同区域序列的可变性将其分为9 个可变区和9 个保守区[4] (图 1)。

|
| 图 1 16S rRNA基因保守区和可变区的分布 Fig. 1 Conserved and variable regions in the 16S rRNA gene |
虽然16S rRNA基因被广泛应用于微生物多样性分析中,然而对于某些属的菌群分辨效果较差,如Vibrio、Pseudomonas 等[5]。 人们一般设定16S rRNA基因序列相似性≥97%的原核生物为同一个种,但很多不同种的微生物其16S rRNA基因序列相似性却高于97%。另外,许多细菌的16S rRNA基因是多拷贝的,而且各拷贝的序列组成存在一些差异;16S rRNA基因也存在着水平转移问题,这些都直接影响着对原核微生物群落结构和多样性的分析。
1.1 基因水平转移(HGT)人们以前曾普遍认为16S rRNA基因不存在水平转移现象,然而一些研究发现,在许多细菌中16S rRNA基因都出现了水平转移[6,7]。在对Pseudomonas属的研究中发现,有些种的V1 区和V3 区中的48.3%和41.6%的16S rRNA基因序列可能是从另一个距离较远的种通过基因水平转移得到的,因此,应该避免使用这些可变区对Pseudomonas进行种间分类[7]。Choi等在对Pfam数据库蛋白结构域分析时发现已有的微生物可能发生过基因水平转移的占1.1%—9.7%,其中多于一个蛋白结构域基因发生水平转移的古菌占一半以上,而细菌占30%—50%,真核生物不到10%,这说明原核微生物发生基因水平转移的频率远远大于高等生物,他们也通过对比发现HGT对于群落SSU (small subunit) rRNA基因整体的系统发育分析影响不大[8]。Garcia-Valle等建立了基因水平转移数据库(HGT-DB),收录了多种微生物发生基因水平转移的数据和相关证据[9]。
1.2 16S rRNA基因的多拷贝及异质性很多原核微生物基因组中rRNA基因是多拷贝的,同一菌种中不同拷贝的基因序列也可能存在差异(异质性)[10]。Větrovsk y ′ 等研究了1690 种已知的细菌基因组,发现只有15%的基因组中16S rRNA基因是单拷贝的,21%的基因组含有3—7 个拷贝,最大的拷贝数是15(Brevibacillus brevis NBRC 100599和Photobacterium profundum SS9),2.4%的基因组中16S rRNA基因具有1%以上的序列差异[11]。在此之前,Pei等[12]通过对数据库中的rRNA序列进行分析时也发现,425个种都具有2—15个不等的rRNA基因拷贝数(2.22 ± 0.81),如古菌一般含2—4 个,氨氧化细菌含1—2 个,固氮菌一般含1—3 个;235个基因组中16S rRNA基因序列异质性变化在0.06%—20.38%之间,例如古菌 Haloarcula marismortui基因组含有的两种16S rRNA基因序列差异性达到了5%。 多拷贝的存在给微生物群落的定量分析带来诸多问题,使群落的多样性估计和结构分析存在较大的偏差[13]。Větrovsk y ′ 等使用高通量测序法分析土壤细菌时发现具有低拷贝16S rRNA基因的类群如Acidobacteria的丰度会被低估,而具有高拷贝16S rRNA基因的类群如Gammaproteobacteria的丰度会被高估。在某些特定情况下,对于拷贝数多或异质性大的菌群可以用其它替代性的单拷贝基因来分析其多样性或进化关系,如GroEL伴侣蛋白,RNA聚合酶β亚基(rpoB),DNA回旋酶β亚基(gyrB)和热休克蛋白(dnaK)等[14,15]。也有人使用hsp60进行Enterobacter的系统进化和分类研究[16]。异质性问题对16S rRNA基因高通量测序研究的影响还需要进一步系统性评估。
1.3 16S rRNA序列的二级结构不论种间的16S rRNA基因序列差异有多大,在进化过程中16S rRNA都保留了相似的二级结构,与 Escherichia coli的二级结构相似性很高[17]。Thermoanaerobacter tengcongensis含有4 个16S rRNA基因,这些基因的一级结构差别达到了6.7%,但二级结构却是很保守的[12]。研究者通过元基因组学方法发现其它细菌rRNA序列与Escherichia coli的 16S rRNA序列相似性为80.9%—99.0%时,它们的rRNA操纵子可以通用,只不过代时将会增加,这个研究表明保持二级结构是维持rRNA功能的重要前提。虽然HGT对微生物群落多样性的分析结果影响较小,但如果进行研究的某些微生物类群中16S rRNA基因发生HGT可能性较大,要精确构建进化树则需根据已有的实验经验综合进行分析。
RNA分子具有降解速度快且难以结晶的特点使得难于通过X射线晶体衍射和NMR(Nuclear Magnetic Resonance)等方法提高对RNA分子空间结构的认识,因此利用各种计算方法从理论上分析rRNA的空间结构是目前主要的方法。原核微生物16S rRNA的二级结构相对于一级结构更加保守,因而研究二级结构对于系统进化分类很有意义[18],尤其是对于种属的鉴定[19]。很多序列比对分析软件都考虑了二级结构,如RDP aligner、ARB(http://www.arb-home.de/)、SSU-ALIGN (http://selab.janelia.org/software/ssu-align/)等[20,21],使系统进化分类结果更加快速准确。rRNA二级结构分析编辑可使用ARB[22]和jphydit (http://plaza.snu.ac.kr/—jchun/jphydit/index.php)等。RNA二级结构的预测主要包括2种方法:最小自由能算法和序列比较分析方法。当前核酸数据库日益庞大,数据量呈指数性地增长,在16S rRNA一级结构的基础上进行二级结构分析对序列比对、OTU(operational taxonomic units)分类就变得更加重要[23,24],因此应该加强二级结构分析预测算法及软件的研究。
1.4 16S rRNA基因序列分析数据库研究者们已经建立了一些专门针对于16S rRNA的数据库,储存16S rRNA基因序列,通过互联网对新测定的序列进行比对分析,比较著名的数据库有SILVA(http://www.arb-silva.de)[25]、RDP(http://rdp.cme.msu.edu/)[21]和Greengenes(http://greengenes.lbl.gov/)[26],人们可以从这些数据库中获取高质量的16S rRNA基因序列信息。rrnDB(http://ribosome.mmg.msu.edu/rrndb)数据库专门用于记录细菌和古菌基因组中rRNA和tRNA基因的拷贝数[27]。在NCBI、DDBJ和EMBL数据库中也有许多16S rRNA基因全长和短序列,如NCBI Genbank中有几十万条大于1000 bp的人体微生物群落的16S rRNA序列。某些领域也建立了一些专业的数据库,如病原微生物16SpathDB (http://147.8.74.24/16SpathDB) 数据库,可用于鉴定对临床重要的细菌16S rRNA序列[28];CORE[29]是人体口腔微生物方面的专业数据库。Comparative RNA Web Site (http://www.rna.ccbb.utexas.edu/) 是分析rRNA二级结构的数据库。EzTaxon-e收集了已培养或未培养微生物的16S rRNA序列信息,常用于鉴定新分离的菌株[30]。probeBase可用来检索与16S rRNA有关的探针[31]。
2 16S rRNA基因在研究微生物群落中的应用常规的微生物分子生物学研究方法如分子杂交、SSCP、DGGE、RFLP、ERIC-PCR、FISH及克隆文库法等相对简单,易于实验操作,但得到的信息量有限,分辨率普遍较低。近些年来发展起来的高通量测序[32,33]和基因芯片技术[34,35]强有力地推进了微生物生态学的研究。尽管每种方法都有各自的局限性,但这些技术的应用使人们对环境中的微生物群落有了更深入的认识[35,36]。图 2勾画出了常用的利用16S rRNA基因分析微生物群落结构和多样性的基本流程。

|
| 图 2 基于16S rRNA基因的微生物群落多样性分析的主要流程 Fig. 2 Pipelines for microbial diversity analysis based on the 16S rRNA gene |
基于16S rRNA基因的指纹图谱技术如DGGE、TGGE、SSCP、ARDRA和T-RFLP等被广泛用于微生物群落的研究中[37]。由于指纹图谱技术的操作相对较简单,在环境微生物动态监测和分析等方面得到了广泛应用[38,39]。表 1列出了常见的指纹图谱分析方法的原理和优缺点,并与多基因序列分析(MLSA)进行比较。
| ARDRA: amplified ribosomal DNA restriction analysis; T-RFLP: terminal restriction fragment length polymorphism; ITS: internally transcribed spacer; ARISA: Automated ribosomal intergenic spacer analysis; RFLP: Restriction fragment length polymorphism; DGGE: Denaturing gradient gel electrophoresis; TGGE: Temperature gradient gel electrophoresis; SSCP: Single-strand conformation polymorphism; MLSA: Multilocus sequence analysis | |||
| 方法 Method | 原理 Principle | 特点 Characteristic | 参考文献 References |
| 核糖体分型 (Ribotyping) | 利用限制性内切酶对整个基因组进行酶切,用标记的16S rRNA基因探针与之杂交,检测相应的RNA操纵子的位置 | 只与限制性酶切位点的变化相关,需进行杂交试验,较费时 | [40] |
| 扩增性rDNA限制性酶切片段分析(ARDRA) | 对16S rRNA基因扩增或克隆产物进行限制性酶切片段长度多态性分析 | 分辨率高,与限制性位点有关,费时 | [41] |
| 末端限制性片段长度多态性分析(T-RFLP) | 通过PCR技术、DNA限制性酶切技术和荧光标记技术得到末端带有荧光标记的限制性多态性片段 | 方便快捷,灵敏度高,并只与末端限制性片段的大小有关 | [39] |
| 16S—23S内部转录间隔区 (ITS)分型 | ITS片段在进化过程中产生更多的变异,即使是亲缘关系非常接近的2个种都能在ITS序列上表现出差异 | 比16S rRNA基因序列具有更大的变异,对亲缘性更近的种属分型更有用 | [42] |
| 核糖体ITS区自动分型 (ARISA) | 利用荧光标记微生物核糖体基因间隔区(ITS)对差异进行分析 | 分辨率较高 | [43] |
| 限制性片段长度多态性分析 (RFLP) | 整个rRNA基因的限制性片段长度多态性分析 | 灵敏度高,操作要求高,分析较复杂 | [44] |
| 变性梯度凝胶电泳 (DGGE) | DNA在不同浓度的变性剂中解链行为不同,导致电泳迁移率发生变化,从而将片段大小相同而碱基组成不同的DNA片段分开 | 检测片段在500bp以内为宜,中等分辨率,只能检测优势菌群 | [45] |
| 温度梯度凝胶电泳(TGGE) | DNA在不同温度梯度环境中解链行为的不同会导致电泳迁移率发生变化 | 大片段DNA由于Tm值较高,检测难度较大 | [46] |
| 单链构象多态性 (SSCP) | 单链DNA的构象差异导致其在凝胶电泳中的迁移率变化 | 分辨率中等,检测片段小于400bp最为理想 | [47] |
| 多基因序列分析(MLSA) | 通常对几个长度为500bp左右的目的基因进行测序,用于进化分析 | 能有效地在种水平上鉴定菌株,还可用于生态型的划分 | [48] |
整体来看,指纹图谱技术通量和分辨率比较低,可以用来对样品进行初步的筛选或评估,例如有时为了减少测序量,可以先进行ARDRA或其它方法分型,然后根据分型结果对有代表性的样品再进一步研究。某些情况下如果仅使用16S rRNA的信息,分辨效果可能不是太好,可使用其它一些分子分析方法作为补充。相比16S rRNA和23S rRNA来说,ITS序列在进化过程中由于面临着较小的选择压力故存在较大的变异,因此ITS的长度和序列的多态性能用来区分不同种的原核生物[42]。在种的水平上,MLSA也是鉴定菌株非常好的方法[48],可利用16S rRNA基因序列和各种指纹技术将未知菌株聚类到一个科或属里,然后根据这一组菌株的特点选择某些代表性的标记基因进行MLSA分析,从而进行种、亚种以及生态型的划分。有时也可参考数据库MLST (http://www.mlst.net)或 PubMLST (http://www.pubmlst.org)进行一些病原微生物的多位点序列分型方面的信息查询。某些微生物之间的16S rRNA基因序列几乎相同,但是DNA杂交值却明显低于70%,因此它们代表着不同的种。16S rRNA基因同源性低于97%的菌株间其基因组DNA的相似性均低于60%。DNA-DNA杂交(DDH,whole genomic DNA-DNA hybridization) 实验操作复杂,不适合进行较大范围的系统分类研究,因此16S rRNA序列分析的结果可以说明是否有必要进行DDH实验。随着高质量序列数据的快速增长,ANI(average nucleotide identity)作为一种很精确且方便使用的分类方法,应用越来越广泛[49]。
2.2 荧光原位杂交技术(FISH)FISH技术是一种不依赖PCR的分子技术,它结合了分子生物学的精确性和显微镜的可视性,可原位监测和鉴定样品中不同的微生物个体,已经广泛应用于微生物定量分析和群落结构分析[50,51]。FISH的原理是根据待测微生物的16S rRNA基因中的保守序列,设计相应的特异性寡核苷酸探针,并进行荧光标记,通过探针与环境基因组中的DNA分子进行杂交,检测该特异微生物种群的存在和丰度。利用分子遗传上保守性不同的特异序列,可以在不同的分类水平(如属、种等)上进行检测。当前的荧光探针安全且具有很好的分辨力,如果使用具有不同激发和散射波长的荧光染料标记探针,可同时检测多个靶序列[52,53]。
FISH技术与其它方法结合能够更好地发挥优势,这些技术包括microcolony-FISH、DVC-FISH、in situ PCR-FISH、CPRINS-FISH、CARD-FISH、MAR-FISH等[53,54],其中CARD-FISH技术很好地解决了目标微生物数量较少时信号检测灵敏度低的问题[55]。Behrens等利用EL-FISH与NanoSIMS技术进行了微生物群落中单细胞进化分类和代谢活性的研究[56]。FISH技术成功应用的关键在于设计和获得具有高灵敏性和专一性的寡核苷酸探针以减少干扰,可使用ARB软件包结合probeBase数据库等多种方法进行探针分析和设计。综合来看,应用FISH技术不仅能研究微生物群落的结构特征和空间分布,还可以跟踪微生物种群的动态变化,此外利用mRNA等作为目标分子还可以进行群落代谢方面的研究。
2.3 实时定量PCR(qRT-PCR)qRT-PCR是通过对PCR扩增反应中每一个循环产物荧光信号的实时检测实现对起始模板定量的分析,具有特异性强、重复性好、准确快速等优点。通常使用的荧光化学方法有TaqMan荧光探针法和SYBR荧光染料法等。许多因素都会影响qRT-PCR反应在定量上的准确性,如细胞裂解效率、抑制剂的去除程度、SYBR GreenⅠ的浓度、同源和异源DNA背景、操作流程设计、目标基因的选择以及PCR产物的长度等,因此在操作时需要优化条件,最大化地减小误差[57,58,59,60]。各种qRT-PCR方法都有其自身的优缺点,操作时需要根据实验设计特点选择。对于特定类群微生物也可使用一些功能基因代替16S rRNA基因进行定量,如利用mcr基因定量产甲烷菌[58]。在绝对定量时,要用到标准样品,可以用带有特定基因的质粒,或者利用直接从环境样品中扩增的PCR产物做标准样品。各种实验操作因素(不同反应批次的差异、加液误差等)对qRT-PCR结果影响很大,因此在定量多个环境样品时,最好能用96或384孔的反应板一次完成。
qRT-PCR既可以对微生物群落的总体进行定量分析,也可以对具体的种属进行定量研究。某些种属的16S rRNA基因分辨率较低,可使用一些功能基因进行定量,如使用特异的invA基因研究Salmonella属。Liu等设计了一种新的qRT-PCR方法用于定量分析群落16S rRNA基因的丰度,并分析了rRNA基因拷贝数等对定量的影响[13]。qRT-PCR与其它技术相结合使用可更好地研究群落的结构和多样性,如指纹图谱技术、测序技术等[61]。
2.4 基因芯片技术基因芯片技术的突出特点在于其高度的并行性、多样化、微型化和自动化。基因芯片的测定结果与高通量测序[62]、qRT-PCR[63]的结果有很好的一致性。根据已知的基因序列信息,研究者们设计出了许多基因芯片进行微生物群落结构和功能的研究,包括基因组芯片、功能基因芯片和系统进化芯片等,主要用于评估多样性和鉴定病原菌等。其中系统进化芯片(PhyloChip)是含有与SSU RNA基因序列互补的寡核苷酸探针的阵列,适合于微生物群落结构组成和动态变化分析。PhyloChip已应用于研究人的肠道、口腔以及水体、土壤和植物根系等微生物群落[64,65,66]。利用微生物的功能基因作为探针开发出的功能基因芯片—GeoChip[67],已广泛应用于检测各种环境样品中微生物群落的功能基因[68,69]。基因芯片的信号扫描及数据处理有许多商业软件可供使用,一些开源工具如Bioconductor平台(http://www.bioconductor.org/)[70]和R语言(http://www.r-project.org/)也常用于基因芯片的数据分析中。
在定性分析方面,基因芯片是根据已知的基因序列信息制作的,因此无法检测到未知的基因信息,也可能检测不到那些丰度较低的基因。检测范围较广的基因芯片由于探针数目太多易产生假阳性,设计特异性探针能够克服这类问题,比如近些年来开发出专门用于检测人体微生物相关菌群的HITChip[71]及用于检测口腔微生物的OC Chip[72]等。在定量分析方面,由于某些菌rRNA基因操纵子是多拷贝的,而使测定的信号总量代表的是16S rRNA基因的总拷贝数,只有使用改进的算法才能更精确地进行定量分析[73]。与高通量测序相比,基因芯片方法实验费用低,数据分析过程相对简单,有时在研究特定的菌群和功能基因时,基因芯片技术是一个较好的选择。而高通量测序是一个“开放系统”,可以探测到环境中新的基因信息,信息更加系统、丰富,但需要利用生物信息学方法和生物化学知识对序列数据进行深入挖掘。
2.5 高通量测序技术要全面系统地分析微生物的多样性,首先要获取16S rRNA基因序列,如何快速准确地获取大量的序列信息就显得很重要。传统的Sanger测序方法操作复杂、通量低,难于解决这个问题。2005年,美国454 Life Science公司首先推出了革命性的基于焦磷酸测序法的高通量测序系统,将第二代测序技术推向了市场。此后,Illumina 公司和ABI公司相继推出了Hiseq和SOLiD等测序平台。现在利用高通量测序技术研究环境微生物多样性的报道越来越多,这些系统的主要优点在于通量高,而且利用Barcoded PCR技术使得在一次运行中能同时进行多样本的大规模测序,使测序成本大大降低。基于单分子测序原理的第三代测序技术也在迅速发展,Helicos Biosciences公司推出了单分子DNA测序仪tSMS Performance,PacBio与ZSGenetics公司也在大力研发新一代测序仪[74],第三代测序技术的进步将使测序更加快速准确,且能大大增加读长,而且可以直接对RNA测序。表 2总结了几种最常用的高通量测序仪的主要技术参数。
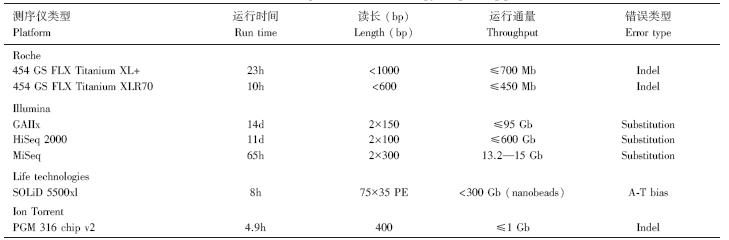
基于测序技术进行微生物多样性研究的方法主要有两种:一种是基于16S rRNA基因的扩增子测序,另一种是基于环境基因组DNA的宏基因组测序,两种方法各有优缺点[75,76]。相比之下,基于16S rRNA基因的高通量测序技术更加常用,并且消除了克隆问题,可以综合研究各个可变区,分析方法也相对成熟,不过在具体的实验分析中也存在着一些问题需要解决,例如PCR扩增的偏差、扩增错误、测序错误等都可能影响群落α-多样性的准确估计[77,78,79]。在16S rRNA基因扩增子测序中,Roche GS FLX+测序平台理论读长最高可以达到1000 bp,一块PTP板可获得超过80 万条序列,而Illumina测序平台具有通量高的优点[80],使得Miseq和Hiseq系列测序仪广泛用于微生物生态学研究中。宏基因组测序无需PCR扩增,既可以研究微生物的群落组成和多样性,也可以反映群落的很多代谢特征,但数据分析相对复杂。
3 16S rRNA基因实验操作过程中的问题 3.1 核酸提取环境基因组总DNA的提取效率影响着对微生物群落组成的准确鉴定和定量分析。核酸提取主要分为细胞破碎、核酸沉淀以及后续纯化三个环节。环境样品DNA提取过程中,不完全的细胞裂解、基质对DNA的吸附、酶抑制剂的共提取以及提取过程中DNA或RNA的降解是主要的一些问题[81],尤其是土壤样品,提取DNA或RNA过程中往往浸提出腐殖酸物质,抑制PCR或反转录反应。商业化的试剂盒(比如MP公司的FastDNA Kit for Soil、Mo Bio公司的PowerSoil DNA Isolation Kit等)能够部分解决此问题,不过价格较贵。其它成本较低的方法包括SDS裂解法、酶解法、玻璃珠破碎法及超声波破碎法等,这些方法提取的DNA往往需要后续再纯化以满足实验需要。对于抑制物含量较高的土壤DNA,可以用水稀释或利用CTAB方法进一步纯化后再扩增。研究表明,初步提取的DNA利用CTAB或/和PVPP可以有效去除大部分抑制剂或杂质[82]。针对不同的环境样品,应该根据文献报道的相关结果对DNA提取方法进行优化。Canto等在研究污泥微生物时使用不同的细胞直接裂解方法,获得了一种实用有效的DNA提取方法[83];Kuczynski等建议在研究复杂微生物群落时应使用多种方法进行细胞裂解[84];Flores等研究了一种新的直接PCR法以简化DNA提取步骤[85]。对于粘性土壤,可以加入skim milk以提高DNA的提取效率[86]。用试剂盒提取的DNA,进行qRT-PCR实验时的平行性往往优于自配试剂的提取方法。在进行样品总RNA提取过程中,要特别注意污染和降解问题[87],一些RNA酶抑制剂可以用于样品运输过程中的保存,以防止RNA降解,如RNA later和Methanol/HEPES溶液[88]等。必须注意的是,要使结果分析重复性和精确性较高,在提取以及后面的操作过程中都要严格控制污染问题,因为相比在测序和分析过程中引入的偏差,实验污染等问题可能对结果影响更大。
3.2 引物的选择16S rRNA基因不同区域的保守度是不一样的,因此扩增区域的选择会影响多样性的分析结果[89]。研究者们从各个方面对引物的选择问题进行了分析,主要有引物长度、扩增长度选择、引物覆盖度等。Cai等发现污泥微生物多样性分析与扩增区域有很大的关系,测序深度会影响低丰度细菌的鉴定[90]。利用27F/338R (V1—V2)引物,人们发现Verrucomicrobia类群在研究的土壤中数量相对较少,但改用515F/806R(V4)引物后,发现土壤中该类群的丰度变大[91]。理想的引物是能够尽量多地将环境样品中的基因扩增出来,同时又要能够区分出不同的种属。为了提高对环境样品DNA扩增的覆盖度,可以设计简并性通用引物,即使这样,也不能覆盖所有的菌群[92],而且,增加位点的非特异性可能会增大扩增偏差的概率。表 3[93,94,95,96,97,98,99,100,101]列出了一些常用的16S rRNA基因的引物,不同的引物对不同种属的覆盖度不一样,某些引物对细菌有很高的覆盖率,某些专门针对古菌,还有些是细菌和古菌通用的引物。
| 适用的菌 Category | 引物名称 Names | 引物序列 Sequences | 覆盖区域 Positions | 参考文献 References |
| Universal | U341F | CCTAYGGGRBGCASCAG | V3—V4 | [93] |
| 细菌和古菌 | U806R | GGACTACNNGGGTATCTAAT | ||
| Universal | U515F | GTGYCAGCMGCCGCGGTA | V4—V5 | [33] |
| 细菌和古菌 | U806R | GGACTACHVGGGTWTCTAAT | ||
| Universal | U515F | GTGYCAGCMGCCGCGGTA | V4—V5 | [94] |
| 细菌和古菌 | U909R | CCCCGYCAATTCMTTTRAGT | ||
| Bacteria细菌 | B8F | AGAGTTTGATCCTGGCTCAG | V1—V3 | [95] |
| B533R | TTACCGCGGCTGCTGGCAC | |||
| Bacteria细菌 | U341F | CCTACGGGRSGCAGCAG | V3—V4 | [96] |
| B785R | TACNVGGGTATCTAATCC | |||
| Bacteria细菌 | U341F | CCTAYGGGRBGCASCAG | V3—V5 | [95] |
| B907R | CCGTCAATTCMTTTGAGTTT | |||
| Bacteria细菌 | B343F | TACGGRAGGCAGCAG | V3 | [97] |
| B534R | ATTACCGCGGCTGCTGGC | |||
| Bacteria细菌 | U347F | GGAGGCAGCAGTRRGGAAT | V3—V4 | [98] |
| U803R | CTACCRGGGTATCTAATCC | |||
| Bacteria细菌 | U519F | CAGCMGCCGCGGTAATWC | V4—V5 | [99] |
| B926R | CCGTCAATTCMTTTRAGTT | |||
| Archaea古菌 | A349F | GYGCASCAGKCGMGAAW | V3—V4 | [100] |
| A806R | GGACTACVSGGGTATCTAAT | |||
| Archaea古菌 | A344F | ACGGGGYGCAGCAGGCGCGA | V3—V5 | [101] |
| A915R | GTGCTCCCCCGCCAATTCCT |
有的学者建议细菌与古菌群落应该分别用专用引物进行分析[102],而其他一些学者则直接使用细菌与古菌通用引物[95,96]。因此,在实验设计时需要考虑到实验目的而有针对性地进行选择,对不同的通用引物的覆盖能力要有个大致的了解。利用454 GS FLX平台,测序长度可以达到800bp,然而PCR产物短时,得到的序列数量多、质量好,所以一般选择400 bp左右的扩增子进行测序。目前看来引物的选择很大程度上还是要根据经验,没有统一的标准,V3—V5区引物应用较多。要根据测序平台的测序长度而选择适当的引物对,如Miseq测序仪使用V2试剂盒时的测序长度在250—300 bp左右,通用引物515F/806R是一个较好的选择[103],但该引物得到的古菌序列数要比通用引物515F/909R低。
3.3 PCR扩增PCR条件的选择对高通量测序结果影响很大。在准备高通量测序用的PCR产物时,最好能用HPLC纯化的引物,以减少非特异性扩增或短片段,现在很多商业公司多用PAGE纯化的引物。PCR扩增时使用的模版浓度、PCR的循环数、不同的聚合酶对微生物多样性结果也有影响[104]。相比其它聚合酶,Finnzymes生产的Phusion High-Fidelity DNA Polymerase保真性高,常用于高通量测序时的PCR扩增;其它酶如Agilent公司的pfuUltraII的持续合成能力较强,产生的扩增产物变异较少,但价格较高。降低扩增循环数(通常不超过30 个循环)及使用高保真聚合酶可以减少扩增偏差。通常对一个样品进行PCR时要做技术重复并进行混合跑电泳回收以减小扩增效率影响。用带有Barcode的高通量测序引物做PCR时,通常会产生一些非特异性的杂带,所以要对每个样品的PCR产物进行切胶纯化,这样才能保证不同barcode的PCR产物混合时定量准确,以使不同样品获得的序列数大致相同。市场上出售的很多胶纯化试剂盒都能满足纯化要求。修补PCR(Reconditioning PCR),即第一轮PCR在20 个循环的扩增后,取少量模板,其它条件不变,再进行5 个循环的修补扩增,由于引物相对模板的浓度较大,可以减少异源双链和嵌合体的产生[105]。
3.4 测序问题样品量少、测序深度要求不高的情况下,传统的16S rRNA克隆文库结合Sanger测序技术可以准确、快捷地产生结果。目前常用的高通量测序法不需构建克隆文库,适用于样品量大或测序深度要求高的情况。如果利用罗氏公司的454 GS FLX+平台,一般400 bp左右的PCR产物测序效率较高,质量较好,也能够满足系统分类的要求。一个454 GS FLX+测序反应可测定多达196 个样品,从而大大降低了单个样品的测序成本。一个反应一般测定100—160 个左右的样品,每个样品理论上可以得到5000—8000 条左右的序列,能满足大多数环境样品的测序深度要求。但是,由于溶液样品转移的误差和一些不明原因,往往有些样品得到的序列数量过多或过少,对序列数过少的样品必需补测。利用Illumina公司的HiSeq或MiSeq测序仪及Ion Torrent的PGM研究微生物群落与最初的454测序方法的过程基本一样。Illumina公司的HiSeq和MiSeq测序仪具有更高的通量,读长则相对较短,新型的MiSeq测序仪可以产生300 bp以上的序列长度,一次可以测定200个以上的扩增子样品,每个样品可以得到2 万条以上的序列数,在微生物多样性研究中具有很大的应用潜力。
测序的精确性对数据的分析结果会产生不可忽略的影响[79],研究者们分别从测序错误对下游数据分析的影响、检测错误的方法、定量控制方法、不同平台的错误类型等方面进行了综合研究。虽然仍存在同聚物测序易出错以及整体错误率相对较高的问题,但随着质量检测方法的改进、数据分析方法的优化及测序技术的进步,高通量测序精度得到了很大的提高[79,106]。利用不同的测序引物从两端测序,以增加重叠区长度也可减少测序错误[107,108],然而,即使这样仍有40%—50%的测序产物不能准确地拼接。Miller等开发了一种算法EMIRGE,可用于拼接Illumina测序仪产生的短序列,从而组装出长的16S rRNA基因片段,他们发现这种方法可重复性好,分析群落变化时准确度较高[109]。
4 高通量测序数据的处理高通量测序产生出了海量的DNA序列数据,如何对这些数据进行生物信息学处理来提取有生物学意义的信息是一个关键过程。通过生物信息学处理,可以得到微生物群落的组成、结构、多样性及其与环境因子的关系等方面的信息。现在已经开发了一些专门针对16S rRNA高通量测序数据处理的生物信息平台。有些平台允许上传数据,利用公共的服务器及相关在线工具进行运算。但对于大容量数据,只有在本地计算机上运算。很多免费软件都是基于Linux操作系统编写的,Perl、Python、R语言在生物信息学中也很常用,所以要求操作者对这些知识有一些基本了解。
4.1 数据前期处理高通量测序数据一般包含序列信息和测序质量数据,数据应该首先进行质量检查,去除质量不好(读长异常、碱基识别模糊等)的序列,然后进行嵌合体检查,如果有叶绿体和线粒体序列的污染,应该先把这部分序列剔除,随后二次随机采集相同数量的序列数,用来进行序列同源比对聚类[110]等,最后根据OTU矩阵和赋予的种属关系进行统计分析(图 3)。

|
| 图 3 16S 利用RDP平台分析环境样品高通量测序数据的技术流程 Fig. 3 Pyrosequencing data analysis pipeline based on RDP platform PCoA: principal coordinate analysis; CCA: canonical correspondence analysis; VPA: variation partition analysis |
每一步运算都有一些软件供选择使用,比如可用来进行序列比对的有PyNAST、SINA、MUSCLE、ClustalW、MAFFT、Blastn等[111,112,113],它们软件的算法各有特色,而且都在不断地得到改进。ARB、BioEdit、DNAstar等软件包常用来进行序列编辑。检测测序错误的算法主要有PyroNoise、DeNoiser和SeqNoise等[114,115]。
由于微生物群落组成复杂,产生的数据量巨大,因此不同的软件会被研究者们选择性地组合成软件包以直接对原始数据进行更加方便系统性的分析,如RDP′s Pyrosequencing Pipeline[21]、QIIME[116]、Mothur[117]、STAP pipeline[75]等,这些软件包各有优缺点,使用时需学习相应的操作命名、文件格式和使用特点,在进行具体实验数据分析比较时也可根据需要合理地进行软件组合,这需要研究者们对软件的算法、计算机处理能力、统计方法等有所了解。如果使用克隆文库分析方法,在16S rRNA基因克隆文库构建完成后,就可以对文库中的克隆进行测序,使用SeqMan、Sequencher等软件可进行序列拼接。BioEdit是一个免费下载软件,可以在Windows下使用,对处理一般序列数据包括高通量测序数据都很有帮助。熟知各种生物信息学软件的特点才能更合理高效地处理测序数据和数据的深度挖掘[78]。
4.2 去除嵌合体高通量测序的数据中会存在一些嵌合体,数据处理时一定要去除这部分序列。以往常用的嵌合体去除方法如RDP、Bellerophon[118]均不适用于高通量测序所产生的大量短序列。近年来发展了一些新算法和程序,例如ChimeraSlayer[119]、Perseus[115]和UCHIME[120]等都可用于嵌合体的预测。嵌合体的识别主要是通过将短读长序列与高质量参考序列进行比对来实现[115,119,120]。UCHIME适用于预测短读长高通量测序数据,其检测效率高、运行速度快,是当前处理高通量测序数据较好的方法。利用UCHIME识别454 GS FLX+测定的土壤16S rRNA序列(400 bp)中的嵌合体,发现大约有1%—18%的序列为嵌合体。在利用计算机软件识别嵌合体时,自然界中16S rRNA基因通过水平转移产生的嵌合体也可能被误认为是实验过程中产生的嵌合体而被去除,PCR过程中产生的异源双链和突变序列也会对检测造成影响,因此应该不断更新数据库信息,优化实验条件和软件算法,尽量减小偏差。
4.3 OTU计算样本中OTU数量和相对丰度代表实际观察到的多样性,因此计算不同样品中OTU的分布,是高通量测序数据处理中一个非常重要的步骤。计算OTU之前,序列要进行比对(alignment)。比对的算法有很多,聚类(clustering)的方法也有多种,不同的软件所选择的算法各有不同,如ESPRIT平台应用成对比对法(pairwise alignment)[121],RDP利用Infernal alignment比对计算距离和完全连锁聚类法(complete linkage cluster)进行OTU聚类,MUSCLE软件利用逐步比对方法(progressive alignment)[122]。Barriuso等比较了各种方法计算多样性的优缺点,发现ESPRIT和RDP能够给出较一致和准确的结果[123]。对于OTU计算分类,Uparse(http://drive5.com/uparse/)是目前较好的方法[124],相比其它OTU分类方法,其计算更快速,结果更准确,可以将该软件组合到QIIME分析流程中,也可以单独使用。 目前来看,OTU计算复杂、运算速度较低并且需要较大的储存空间是一大难题,因此需要对计算方法进一步改进[125,126]。
4.4 系统进化分类常用的系统进化分类数据库有RDP、Greengenes、SILVA和NCBI等,国际著名数据库RDP中的分类系统是最常用的。分类的基本过程是将测定的序列与数据库中已知的序列进行比对,确定其系统进化分类的位置[127,128],这种方法具有效率高、稳定性好的优点。也可以先根据整个测序数据中的各个序列之间的相似性程度进行OTU聚类[117,121],之后根据不同OTU的代表序列使用RDP classifier等工具进行数据库搜索[116,129],对OTU进行种属分类,然后进行后续分析。OTU的划分与分类水平之间的关系是很难准确界定的,通常是将相似性大于97%的序列归为一个OTU,不同类型菌群的相似性阈值也存在差异[130,131];另外使用其它不同的标志基因进行系统分类时OTU阈值的设定也各不同。系统分类研究是进行各种微生物学研究的基础,通过各种方法对原核生物精确分类和确定典型菌株具有重要意义[132],不断更新的LTP (All-Species Living Tree Project)搜集了大量的来自于典型菌株的序列数据并提供了根据已有的SSU rRNA基因序列所重建出的系统进化树作为参考[133],这些数据可被下载到ARB程序包中以方便序列比对、序列编辑等操作。
4.5 进化树构建微生物群落的多样性分析有时要用进化树来显示。构建进化树的主要过程包括获取序列数据、确定进化距离模型、进行多序列比对、根据比对结果提取信息、选择建树算法与参数构建进化树。进化树的构建基于距离的方法有UPGMA (unweighted pair-group method using arithmetic averages)、ME (minimum evolution method,最小进化法)和NJ(neighbor joining,邻接法)等,其它的方法包括MP(maximum parsimony,最大简约法)、ML(maximum likelihood,最大似然法)以及Bayesian推断等方法。一般来讲,如果模型合适,ML的效果较好,但相对耗时。对于相似度很低的序列,NJ往往出现长枝吸引现象。对近缘序列,可选择MP,其用的假设最少,MP一般不用在远缘序列上。基于16S rRNA基因的研究常用的参数模型有Kimura2、Jukes-Cantor等。虽然有研究者对各种进化树构建方法的准确性进行了探讨[134],然而进化树分析相当复杂,很难精确地比较,经常要根据经验选择合适的参数模型和建树方法。有时可用不同的方法构建进化树,如果所得到的进化树结构相似,说明结果较为可靠。表 4列出了常用的与进化树构建相关的软件和特点,其它进化树构建软件可参考网站(http://evolution.genetics.washington.edu/phylip/software.html)。
| 软件 Software | 算法 Algorithms | 特点 Characteristics | 网址 Website |
| ARB | NJ,MP,ML | 多功能软件包,系统进化分析功能齐全,可进行比对、编辑等,多种算法可供选择 | http://www.arb-home.de |
| Fast Tree | ME,ML,NJ | 建树速度较快 | http://www.microbesonline.org/fasttree |
| MAC5 | Bayesian | 基于贝叶斯方法的建树工具,后验概率对先验概率的设置比较敏感 | http://www.agapow.net/software/mac5 |
| Mayas | Bayesian | 可以将核酸序列以及形态学观察结果等整合到数据文件中进行综合分析 | http://mrbayes.csit.fsu.edu |
| MEGA | NJ,MP | 图形化软件,可以通过网络进行序列的比对和数据搜索 | http://www.megasoftware.net |
| PAML | ML | 进化参数估计、进化假说检验、分歧时间估计、正选择估计等 | http://abacus.gene.ucl.ac.uk/software/paml.html |
| PAUP | MP,ML | 通用的构建系统进化树的商业软件 | http://paup.csit.fsu.edu |
| PHASE | ML,Bayesian | 参数模型考虑了rRNA的二级结构 | http://www.bioinf.man.ac.uk/resources/phase |
| PHYLIP | NJ,MP,ML | 命令行格式,功能强大 | http://evolution.genetics.washington.edu/phylip.html |
| PHYML | ML | 最快的ML建树工具 | http://www.atgc-montpellier.fr/phyml |
通常构建完进化树后需要做Bootstrap检验,如果检验值过低,所构建进化树的拓扑结构可能存在问题。对于丰度很高的微生物群落,如果得到的序列数太多,就很难建树,也难以对结果进行图形化显示以及总体分类特点的比较[121],有时即使能够构建出复杂的进化树,也会因为分支太多而无法分析[135],因此图形化显示复杂系统的物种进化关系一直是个难点[136]。VITCOMIC( http://mg.bio.titech.ac.jp/vitcomic/)能够分类显示基于大量16S rRNA基因序列分析基础上的群落组成特征[137],相比其它工具,其最独特的功能是可直观地比较样品间分类组成上的差异。
4.6 微生物群落数据的生态学统计分析传统的基于分类关系的群落数据分析主要有:α-多样性分析(Chao1,Simpson index,Shannon index,rarefaction curves等)、物种丰度差异分析、样品物种分布、β-多样性分析(Cody index,Sorenson index,Bray-Curtis index,Morisita-Horn index)等。结合群落结构和系统进化信息的α-多样性分析有Faith系统发育多样性(Faith′s phylogenetic diversity) 、平均成对系统发育距离(MPD)、平均最近类群距离(MNTD)、物种多样性矩阵、二次熵、 系统发育关联性回归等;β-多样性分析包括了phylogenetic Sorenson index,UniFrac distance metric,群落间MPD和MNTD计算[138,139,140]等。研究环境因子和群落关系的分析方法有稀疏曲线分析、 物种-环境回归分析、多元统计分析等。
多元统计分析方法已广泛应用于多种分子生物学技术的数据分析中,如指纹图谱、基因芯片、高通量测序等[39]。多元统计分析方法中探索性的方法有聚类分析、主成分分析(PCA)、对应分析(CA)、去趋势对应分析(DCA)、非度量多维标度(NMDS)等,NPMANOVA、ANOSIM等可用于检验样品组间的差异显著性;解释性的方法有冗余分析(RDA)、典范对应分析(CCA)、线性判别分析、方差分解分析(VPA)、Mantel test等[141,142]。各种方法在实际研究中都有其使用条件,需根据不同的研究目的、环境因子及实验设计选用合适的方法,例如当环境梯度中OTU类别相差较大时或主成分不能解释大量变异时,PCA可能不适合,可考虑CA或NMDS等其它方法。对于基于距离矩阵的方法来说,距离度量方法的选择有时可能要比排序方法的选择更为重要[143]。在微生物生态学研究中要正确使用这些方法需要熟知方法的原理、特点及输入的数据类型[141]。对群落组成数据进行统计分析时需正确运用统计方法,比如要检验β-多样性形成和维持因素的假说时,若数据不满足多元正态假设就不能使用依赖于多元正态假设的显著性检验,而有时需对数据进行转换以满足正态假设。
在微生物生态学研究中,基于系统进化信息的多样性研究比单纯的分类多样性、功能多样性分析信息量更大,从而得到了更广泛的应用[140,144,145]。基于系统发育信息的数据分析方法中常使用UniFrac分析[146],输入的数据可以是不同序列的存在与否的数据(定性)或不同序列的丰度数据(定量,weighted)[147]。UniFrac方法也在不断地发展,如Fast UniFrac[135]在数据处理的许多方面都进行了优化,加入了很多新功能;VAW-UniFrac在加权方法上进行了改进[148]。在具体的数据分析中需根据目的选择软件和方法,例如要调查微生物群落特征与环境因子的关系,首先要将各环境参数标准化,然后可以计算不同样品间Euclidean距离等,形成相似性系数矩阵。可利用R或PASSaGE软件包中的Partial Mantel tests方法计算UniFrac距离与环境因子参数的关系[149]。利用CCA、RDA等鉴定对微生物组成重要的环境因子,用于方差分解分析,以估算不同环境因子对群落变化的贡献率,这些运算程序可以在vegan程序包(http://vegan.r-forge.r-project.org/)中找到,在R环境中运行。其它还有很多统计分析软件如SONS、Tree Climber、CANOCO等[150,151]以及其它复杂数据的分析方法如偏最小二乘路径模型、网络分析和机器学习[152,153]等,可以根据需要灵活应用。准确的实验设计和数据分析方法对于生态理论的阐述至关重要,因此,在研究微生物生态学领域的理论问题如物种分布格局、多样性时所获取的数据一定要准确合理,统计方法使用得当,这样才能分析出正确的生态学结果。
5 总结与展望微生物生态学的研究领域非常广泛,本文主要讨论了16S rRNA基因在微生物群落生态学领域中的应用,微生物独特的生理生化特点使得微生物生态学领域的数据获取和分析相比其它生态学领域要复杂很多[154]。虽然基于16S rRNA基因的微生物多样性研究已经取得了巨大的进展,不过仍存在一系列问题,如数据库中部分序列数据不够准确,同一基因组中含有多拷贝16S rRNA基因和序列异质性的问题,生态理论模型发展不足,实验操作存在诸多影响因素等,正确分析这些问题才能更好地指导我们进行微生物生态学研究。虽然基于16S rRNA的环境微生物学研究方法最为常用,但是以16S rRNA基因为基础的分子生物学技术并不能完全代替其它的微生物生态学研究方法。综合利用这些技术和方法,更加有助于揭示微生物群落的重要特征,加深我们对难培养微生物功能特点的认识。未来的研究方向可能会集中在以下几个方面,(1)新技术新方法的应用:纵观生物学发展史,许多新技术的产生都给生命科学带来革命性的进步。基于高通量测序技术发展起来的宏基因组和宏转录组技术等为微生物生态学研究提供了强大的手段。对于当前的二代测序技术的应用来说,优化实验步骤仍然是一重点,当然生态模型的研究也不可或缺;(2)各种研究方法的有机结合:微生物生态学研究进入了多学科交叉阶段,要获得较大突破需要许多学科的共同进步,因此应该大力发展交叉学科,特别是生物信息学,并将其成果广泛应用于微生物生态学研究中[155]。自然生态环境的取样研究、定位观测与实验室中的控制实验相结合[154]能更好的进行生态理论上的探索研究;(3)大规模综合性研究:继续开展类似HMP计划[156]、EMP计划[157]等大规模的与微生物多样性有关的综合性研究对于探讨微生物多样性所蕴含的生物学意义相当重要,将微生物群落特征、环境因素和生态学模型等结合起来,借鉴已有的植物和动物生态学理论[158],能为了解微生物群落结构的普遍模式和发展新的微生物生态学理论提供重要的指导思想。
| [1] | Zuckerkandl E, Pauling L. Molecules as documents of evolutionary history. Journal of Theoretical Biology, 1965, 8(2): 357-366. |
| [2] | Woese C R, Fox G E. Phylogenetic structure of the prokaryotic domain: the primary kingdoms. Proceedings of the National Academy of Sciences of the United States of America, 1977, 74(11): 5088-5090. |
| [3] | Rinke C, Schwientek P, Sczyrba A, Ivanova N N, Anderson I J, Cheng J F, Darling A, Malfatti S, Swan B K, Gies E A, Dodsworth J A, Hedlund B P, Tsiamis G, Sievert S M, Liu W T, Eisen J A, Hallam S J, Kyrpides N C, Stepanauskas R, Rubin E M, Hugenholtz P, Woyke T. Insights into the phylogeny and coding potential of microbial dark matter. Nature, 2013, 499(7459): 431-437. |
| [4] | Chakravorty S, Helb D, Burday M, Connell N, Alland D. A detailed analysis of 16S ribosomal RNA gene segments for the diagnosis of pathogenic bacteria. Journal of Microbiological Methods, 2007, 69(2): 330-339. |
| [5] | Pascual J, Macián M C, Arahal D R, Garay E, Pujalte M J. Multilocus sequence analysis of the central clade of the genus Vibrio by using the 16S rRNA, recA, pyrH, rpoD, gyrB, rctB and toxR genes. International Journal of Systematic and Evolutionary Microbiology, 2010, 60(1): 154-165. |
| [6] | Schouls L M, Schot C S, Jacobs J A. Horizontal transfer of segments of the 16S rRNA genes between species of the Streptococcus anginosus group. Journal of Bacteriology, 2003, 185(24): 7241-7246. |
| [7] | Bodilis J, Nsigue-Meilo S, Besaury L, Quillet L. Variable copy number, intra-genomic heterogeneities and lateral transfers of the 16S rRNA gene in Pseudomonas. PloS One, 2012, 7(4): e35647. |
| [8] | Choi I G, Kim S H. Global extent of horizontal gene transfer. Proceedings of the National Academy of Sciences of the United States of America, 2007, 104(11): 4489-4494. |
| [9] | Garcia-Vallve S. HGT-DB: a database of putative horizontally transferred genes in prokaryotic complete genomes. Nucleic Acids Research, 2003, 31(1): 187-189. |
| [10] | Wang Y, Zhang Z, Ramanan N. The actinomycete Thermobispora bispora contains two distinct types of transcriptionally active 16S rRNA genes. Journal of Bacteriology,1997, 179(10): 3270-3276. |
| [11] | Větrovsk y ' T, Baldrian P. The variability of the 16S rRNA gene in bacterial genomes and its consequences for bacterial community analyses. PloS One, 2013, 8(2): e57923. |
| [12] | Pei A Y, Oberdorf W E, Nossa C W, Agarwal A, Chokshi P, Gerz E A, Jin Z, Lee P, Yang L, Poles M, Brown S M, Sotero S, Desantis T, Brodie E, Nelson K, Pei Z. Diversity of 16S rRNA genes within individual prokaryotic genomes. Applied and Environmental Microbiology, 2010, 76(12): 3886-3897. |
| [13] | Liu C M, Aziz M, Kachur S, Hsueh P R, Huang Y T, Keim P, Price L B. BactQuant: an enhanced broad-coverage bacterial quantitative real-time PCR assay. BMC Microbiology, 2012, 12(1): 56-56. |
| [14] | Eardly B, Nour S, Van Berkum P, Selander R. Rhizobial 16S rRNA and dnaK genes: mosaicism and the uncertain phylogenetic placement of Rhizobium galegae. Applied and Environmental Microbiology, 2005, 71(3): 1328-1335. |
| [15] | Case R J, Boucher Y, Dahllöf I, Holmström C, Doolittle W F, Kjelleberg S. Use of 16S rRNA and rpoB genes as molecular markers for microbial ecology studies. Applied and Environmental Microbiology, 2007, 73(1): 278-288. |
| [16] | Iversen C, Waddington M, On S L, Forsythe S. Identification and phylogeny of Enterobacter sakazakii relative to Enterobacter and Citrobacter species. Journal of Clinical Microbiology, 2004, 42(11): 5368-5370. |
| [17] | Cannone J S S, Schnare M, Collett J, D'Souza L, Du Y, Feng B, Lin N, Madabusi L, Müller K. The Comparative RNA Web (CRW) Site: an online database of comparative sequence and structure information for ribosomal, intron, and other RNAs. BMC Bioinformatics, 2002, 3(1): 2-2. |
| [18] | Schloss P D. The effects of alignment quality, distance calculation method, sequence filtering, and region on the analysis of 16S rRNA gene-based studies. PLoS Computational Biology, 2010, 6(7): e1000844. |
| [19] | Chen C Y, Zhao S L, Ben K L. Phylogenetic analysis of the family Thermaceae with an emphasis on signature position and secondary structure of 16S rRNA. FEMS Microbiology Letters, 2003, 221(2): 293-298. |
| [20] | Schloss P D. A high-throughput DNA sequence aligner for microbial ecology studies. PloS One, 2009, 4(12): e8230. |
| [21] | Cole J R, Wang Q, Cardenas E, Fish J, Chai B, Farris R J, Kulam-Syed-Mohideen A S, McGarrell D M, Marsh T, Garrity G M, Tiedje J M. The Ribosomal Database Project: improved alignments and new tools for rRNA analysis. Nucleic Acids Research, 2009, 37(Database issue): D141-D145. |
| [22] | Ludwig W, Strunk O, Westram R, Richter L, Meier H, Yadhukumar, Buchner A, Lai T, Steppi S, Jobb G, Forster W, Brettske I, Gerber S, Ginhart A W, Gross O, Grumann S, Hermann S, Jost R, Konig A, Liss T, Lussmann R, May M, Nonhoff B, Reichel B, Strehlow R, Stamatakis A, Stuckmann N, Vilbig A, Lenke M, Ludwig T, Bode A, Schleifer K H. ARB: a software environment for sequence data. Nucleic Acids Research, 2004, 32(4): 1363-1371. |
| [23] | Schloss P D. Secondary structure improves OTU assignments of 16S rRNA gene sequences. The ISME Journal, 2013, 7(3): 457-460. |
| [24] | Letsch H O, Kuck P, Stocsits R R, Misof B. The impact of rRNA secondary structure consideration in alignment and tree reconstruction: simulated data and a case study on the phylogeny of hexapods. Molecular Biology and Evolution, 2010, 27(11): 2507-2521. |
| [25] | Pruesse E, Quast C, Knittel K, Fuchs B M, Ludwig W, Peplies J, Glockner F O. SILVA: a comprehensive online resource for quality checked and aligned ribosomal RNA sequence data compatible with ARB. Nucleic Acids Research, 2007, 35(21): 7188-7196. |
| [26] | DeSantis T Z, Hugenholtz P, Larsen N, Rojas M, Brodie E L, Keller K, Huber T, Dalevi D, Hu P, Andersen G L. Greengenes, a chimera-checked 16S rRNA gene database and workbench compatible with ARB. Applied and Environmental Microbiology, 2006, 72(7): 5069-5072. |
| [27] | Lee Z M P, Bussema C, Schmidt T M. rrnDB: documenting the number of rRNA and tRNA genes in bacteria and archaea. Nucleic Acids Research, 2009, 37(Database issue): D489-D493. |
| [28] | Woo P C Y, Teng J L L, Yeung J M Y, Tse H, Lau S K P, Yuen K Y. Automated identification of medically important bacteria by 16S rRNA gene sequencing using a novel comprehensive database, 16SpathDB. Journal of Clinical Microbiology, 2011, 49(5): 1799-1809. |
| [29] | Griffen A L, Beall C J, Firestone N D, Gross E L, Difranco J M, Hardman J H, Vriesendorp B, Faust R A, Janies D A, Leys E J. CORE: a phylogenetically-curated 16S rDNA database of the core oral microbiome. PloS One, 2011, 6(4): e19051. |
| [30] | Kim O S, Cho Y J, Lee K, Yoon S H, Kim M, Na H, Park S C, Jeon Y S, Lee J H, Yi H, Won S, Chun J. Introducing EzTaxon-e: a prokaryotic 16S rRNA gene sequence database with phylotypes that represent uncultured species. International Journal of Systematic and Evolutionary Microbiology, 2012, 62(3): 716-721. |
| [31] | Loy A, Maixner F, Wagner M, Horn M. probeBase-an online resource for rRNA-targeted oligonucleotide probes: new features 2007. Nucleic Acids Research, 2007, 35(S1): D800-D804. |
| [32] | Sogin M L, Morrison H G, Huber J A, Welch D M, Huse S M, Neal P R, Arrieta J M, Herndl G J. Microbial diversity in the deep sea and the underexplored "rare biosphere". Proceedings of the National Academy of Sciences of the United States of America, 2006, 103(32): 12115-12120. |
| [33] | Caporaso J G, Lauber C L, Walters W A, Berg-Lyons D, Lozupone C A, Turnbaugh P J, Fierer N, Knight R. Global patterns of 16S rRNA diversity at a depth of millions of sequences per sample. Proceedings of the National Academy of Sciences of the United States of America, 2011, 108(S1): 4516-4522. |
| [34] | Brodie E L, DeSantis T Z, Parker J P M, Zubietta I X, Piceno Y M, Andersen G L. Urban aerosols harbor diverse and dynamic bacterial populations. Proceedings of the National Academy of Sciences of the United States of America, 2007, 104(1): 299-304. |
| [35] | Hazen T C, Dubinsky E A, DeSantis T Z, Andersen G L, Piceno Y M, Singh N, Jansson J K, Probst A, Borglin S E, Fortney J L, Stringfellow W T, Bill M, Conrad M E, Tom L M, Chavarria K L, Alusi T R, Lamendella R, Joyner D C, Spier C, Baelum J, Auer M, Zemla M L, Chakraborty R, Sonnenthal E L, D'haeseleer P, Holman H Y, Osman S, Lu Z, Van Nostrand J D, Deng Y, Zhou J, Mason O U.. Deep-sea oil plume enriches indigenous oil-degrading bacteria. Science, 2010, 330(6001): 204-208. |
| [36] | Fierer N, Lauber C L, Zhou N, McDonald D, Costello E K, Knight R. Forensic identification using skin bacterial communities. Proceedings of the National Academy of Sciences of the United States of America, 2010, 107(14): 6477-6481. |
| [37] | Bouchet V, Huot H, Goldstein R. Molecular genetic basis of ribotyping. Clinical Microbiology Reviews, 2008, 21(2): 262-273. |
| [38] | Wang S Q, He J Z. Separation of fluorescence-labelled terminal restriction fragment DNA on a two-dimensional gel (T-RFs-2D)-an efficient approach for microbial consortium characterization. Environmental Microbiology, 2011, 13(9): 2565-2575. |
| [39] | Schütte U M, Abdo Z, Bent S J, Shyu C, Williams C J, Pierson J D, Forney L J. Advances in the use of terminal restriction fragment length polymorphism (T-RFLP) analysis of 16S rRNA genes to characterize microbial communities. Applied Microbiology and Biotechnology, 2008, 80(3): 365-380. |
| [40] | Grimont F, Grimont P A. Ribosomal ribonucleic acid gene restriction patterns as potential taxonomic tools. Annales de l'Institut Pasteur: Microbiologie, 1986, 137B(2): 165-175. |
| [41] | Maragkoudakis P A, Nardi T, Bovo B, D'Andrea M, Howell K S, Giacomini A, Corich V. Biodiversity, dynamics and ecology of bacterial community during grape marc storage for the production of grappa. International Journal of Food Microbiology, 2013, 162(2): 143-151. |
| [42] | Nocker A, Burr M, Camper A K. Genotypic microbial community profiling: a critical technical review. Microbial Ecology, 2007, 54(2): 276-289. |
| [43] | Needham D M, Chow C E, Cram J A, Sachdeva R, Parada A, Fuhrman J A. Short-term observations of marine bacterial and viral communities: patterns, connections and resilience. The ISME Journal, 2013, 7(7): 1274-1285. |
| [44] | Zeng Y H, Koblizek M, Li Y X, Liu Y P, Feng F Y, Ji J D, Jian J C, Wu Z H. Long PCR-RFLP of 16S-ITS-23S rRNA genes: a high-resolution molecular tool for bacterial genotyping. Journal of Applied Microbiology, 2013, 114(2): 433-447. |
| [45] | Muyzer G, de Waal E C, Uitterlinden A G. Profiling of complex microbial populations by denaturing gradient gel electrophoresis analysis of polymerase chain reaction-amplified genes coding for 16S rRNA. Applied and Environmental Microbiology, 1993, 59(3): 695-700. |
| [46] | Chadalavada D M, Bevilacqua P C. Analyzing RNA and DNA folding using temperature gradient gel electrophoresis (TGGE) with application to in vitro selections. Methods in Enzymology, 2009, 468: 389-408. |
| [47] | Kumari M, Sharma V L, Sodhi M, Mukesh M, Shouche Y, Sobti R C. PCR-SSCP and sequence analysis of three Odontotermes spp. (order: isoptera; family: termitidae) on the basis of partial 16SrRNA gene. Molecular and Cellular Biochemistry, 2009, 330(1/2): 153-162. |
| [48] | Boite M C, Mauricio I L, Miles M A, Cupolillo E. New insights on taxonomy, phylogeny and population genetics of Leishmania (Viannia) parasites based on multilocus sequence analysis. PLoS Neglected Tropical Diseases, 2012, 6(11): e1888. |
| [49] | Richter M, Rosselló-Móra R. Shifting the genomic gold standard for the prokaryotic species definition. Proceedings of the National Academy of Sciences of the United States of America, 2009, 106(45): 19126-19131. |
| [50] | Bertaux J, Gloger U, Schmid M, Hartmann A, Scheu S. Routine fluorescence in situ hybridization in soil. Journal of Microbiological Methods, 2007, 69(3): 451-460. |
| [51] | Matturro B, Aulenta F, Majone M, Papini M P, Tandoi V, Rossetti S. Field distribution and activity of chlorinated solvents degrading bacteria by combining CARD-FISH and real time PCR. New Biotechnology, 2012, 30(1): 23-32. |
| [52] | Watt M, Hugenholtz P, White R, Vinall K. Numbers and locations of native bacteria on field-grown wheat roots quantified by fluorescence in situ hybridization (FISH). Environmental Microbiology, 2006, 8(5): 871-884. |
| [53] | Wagner M, Haider S. New trends in fluorescence in situ hybridization for identification and functional analyses of microbes. Current Opinion in Biotechnology, 2012, 23(1): 96-102. |
| [54] | Okabe S, Oshiki M, Kamagata Y, Yamaguchi N, Toyofuku M, Yawata Y, Tashiro Y, Nomura N, Ohta H, Ohkuma M, Hiraishi A, Minamisawa K. A great leap forward in microbial ecology. Microbes and Environments, 2010, 25(4): 230-240. |
| [55] | Kubota K. CARD-FISH for environmental microorganisms: technical advancement and future applications. Microbes and Environments, 2013, 28(1): 3-12. |
| [56] | Behrens S, Losekann T, Pett-Ridge J, Weber P K, Ng W O, Stevenson B S, Hutcheon I D, Relman D A, Spormann A M. Linking microbial phylogeny to metabolic activity at the single-cell level by using enhanced element labeling-catalyzed reporter deposition fluorescence in situ hybridization (EL-FISH) and NanoSIMS. Applied and Environmental Microbiology, 2008, 74(10): 3143-3150. |
| [57] | Zhang T, Fang H H. Applications of real-time polymerase chain reaction for quantification of microorganisms in environmental samples. Applied Microbiology and Biotechnology, 2006, 70(3): 281-289. |
| [58] | Smith C J, Osborn A M. Advantages and limitations of quantitative PCR (Q-PCR)-based approaches in microbial ecology. FEMS Microbiology Ecology, 2009, 67(1): 6-20. |
| [59] | Nolvak H, Truu M, Truu J. Evaluation of quantitative real-time PCR workflow modifications on 16S rRNA and tetA gene quantification in environmental samples. Science of the Total Environment, 2012, 426: 351-358. |
| [60] | Callbeck C M, Sherry A, Hubert C R, Gray N D, Voordouw G, Head I M. Improving PCR efficiency for accurate quantification of 16S rRNA genes. Journal of Microbiological Methods, 2013, 93(2): 148-152. |
| [61] | Zhang H, Parameswaran P, Badalamenti J, Rittmann B E, Krajmalnik-Brown R. Integrating high-throughput pyrosequencing and quantitative real-time PCR to analyze complex microbial communities. Methods in Molecular Biology, 2011, 733: 107-128. |
| [62] | van den Bogert B, de Vos W M, Zoetendal E G, Kleerebezem M. Microarray analysis and barcoded pyrosequencing provide consistent microbial profiles depending on the source of human intestinal samples. Applied and Environmental Microbiology, 2011, 77(6): 2071-2080. |
| [63] | Paliy O, Kenche H, Abernathy F, Michail S. High-throughput quantitative analysis of the human intestinal microbiota with a phylogenetic microarray. Applied and Environmental Microbiology, 2009, 75(11): 3572-3579. |
| [64] | Wu C H, Sercu B, van de Werfhorst L C, Wong J, DeSantis T Z, Brodie E L, Hazen T C, Holden P A, Andersen G L. Characterization of coastal urban watershed bacterial communities leads to alternative community-based indicators. PloS One, 2010, 5(6): e11285. |
| [65] | DeAngelis K M, Allgaier M, Chavarria Y, Fortney J L, Hugenholtz P, Simmons B, Sublette K, Silver W L, Hazen T C. Characterization of trapped lignin-degrading microbes in tropical forest soil. PloS One, 2011, 6(4): e19306. |
| [66] | Mendes R, Kruijt M, de Bruijn I, Dekkers E, van der Voort M, Schneider J H, Piceno Y M, DeSantis T Z, Andersen G L, Bakker P A, Raaijmakers J M. Deciphering the rhizosphere microbiome for disease-suppressive bacteria. Science, 2011, 332(6033): 1097-1100. |
| [67] | He Z L, Deng Y, van Nostrand J D, Tu Q C, Xu M Y, Hemme C L, Li X Y, Wu L Y, Gentry T J, Yin Y F, Liebich J, Hazen T C, Zhou J Z. GeoChip 3.0 as a high-throughput tool for analyzing microbial community composition, structure and functional activity. The ISME Journal, 2010, 4(9): 1167-1179. |
| [68] | He Z L, van Nostrand J D, Zhou J Z. Applications of functional gene microarrays for profiling microbial communities. Current Opinion in Biotechnology, 2012, 23(3): 460-466. |
| [69] | Wang F, Zhou H, Meng J, Peng X, Jiang L, Sun P, Zhang C, van Nostrand J D, Deng Y, He Z, Wu L, Zhou J, Xiao X. GeoChip-based analysis of metabolic diversity of microbial communities at the Juan de Fuca Ridge hydrothermal vent. Proceedings of the National Academy of Sciences of the United States of America, 2009, 106(12): 4840-4845. |
| [70] | Gentleman R C, Carey V J, Bates D M, Bolstad B, Dettling M, Dudoit S, Ellis B, Gautier L, Ge Y, Gentry J, Hornik K, Hothorn T, Huber W, Iacus S, Irizarry R, Leisch F, Li C, Maechler M, Rossini A J, Sawitzki G, Smith C, Smyth G, Tierney L, Yang J Y, Zhang J. Bioconductor: open software development for computational biology and bioinformatics. Genome Biology, 2004, 5(10): R80-R80. |
| [71] | Rajilic-Stojanovic M, Heilig H G, Molenaar D, Kajander K, Surakka A, Smidt H, de Vos W M. Development and application of the human intestinal tract chip, a phylogenetic microarray: analysis of universally conserved phylotypes in the abundant microbiota of young and elderly adults. Environmental Microbiology, 2009, 11(7): 1736-1751. |
| [72] | Crielaard W, Zaura E, Schuller A A, Huse S M, Montijn R C, Keijser B J. Exploring the oral microbiota of children at various developmental stages of their dentition in the relation to their oral health. BMC Medical Genomics, 2011, 4(1): 22-22. |
| [73] | Rigsbee L, Agans R, Foy B D, Paliy O. Optimizing the analysis of human intestinal microbiota with phylogenetic microarray. FEMS Microbiology Ecology, 2011, 75(2): 332-342. |
| [74] | Ozsolak F. Third-generation sequencing techniques and applications to drug discovery. Expert Opinion on Drug Discovery, 2012, 7(3): 231-243. |
| [75] | Wu D Y, Hartman A, Ward N, Eisen J A. An automated phylogenetic tree-based small subunit rRNA taxonomy and alignment pipeline (STAP). PloS One, 2008, 3(7): e2566. |
| [76] | Eisen J A. Environmental shotgun sequencing: its potential and challenges for studying the hidden world of microbes. PLoS Biology, 2007, 5(3): e82. |
| [77] | Shokralla S, Spall J L, Gibson J F, Hajibabaei M. Next-generation sequencing technologies for environmental DNA research. Molecular Ecology, 2012, 21(8): 1794-1805. |
| [78] | Lynch M D, Bartram A K, Neufeld J D. Targeted recovery of novel phylogenetic diversity from next-generation sequence data. The ISME Journal, 2012, 6(11): 2067-2077. |
| [79] | Kunin V, Engelbrektson A, Ochman H, Hugenholtz P. Wrinkles in the rare biosphere: pyrosequencing errors can lead to artificial inflation of diversity estimates. Environmental Microbiology, 2010, 12(1): 118-123. |
| [80] | Scholz M B, Lo C C, Chain P S. Next generation sequencing and bioinformatic bottlenecks: the current state of metagenomic data analysis. Current Opinion in Biotechnology, 2012, 23(1): 9-15. |
| [81] | Stach J E, Bathe S, Clapp J P, Burns R G. PCR-SSCP comparison of 16S rDNA sequence diversity in soil DNA obtained using different isolation and purification methods. FEMS Microbiology Ecology, 2001, 36(2/3): 139-151. |
| [82] | Zhou J Z, Bruns M A, Tiedje J M. DNA recovery from soils of diverse composition. Applied and Environmental Microbiology, 1996, 62(2): 316-322. |
| [83] | Canto-Canché B, Tzec-Simá M, Vázquez-Loría J I, Espadas-Alvarez H, Chí-Manzanero B H, Rojas-Herrera R, Valdez-Ojeda R, Alzate-Gaviria L. Simple and inexpensive DNA extraction protocol for studying the bacterial composition of sludges used in microbial fuel cells. Genetics and Molecular Research, 2013, 12(1): 282-292. |
| [84] | Kuczynski J, Lauber C L, Walters W A, Parfrey L W, Clemente J C, Gevers D, Knight R. Experimental and analytical tools for studying the human microbiome. Nature Reviews: Genetics, 2012, 13(1): 47-58. |
| [85] | Flores G E, Henley J B, Fierer N. A direct PCR approach to accelerate analyses of human-associated microbial communities. PloS One, 2012, 7(9): e44563. |
| [86] | Yankson K K, Steck T R. Strategy for extracting DNA from clay soil and detecting a specific target sequence via selective enrichment and real-time (quantitative) PCR amplification. Applied and Environmental Microbiology, 2009, 75(18): 6017-6021. |
| [87] | He S, Wurtzel O, Singh K, Froula J L, Yilmaz S, Tringe S G, Wang Z, Chen F, Lindquist E A, Sorek R, Hugenholtz P. Validation of two ribosomal RNA removal methods for microbial metatranscriptomics. Nature Methods, 2010, 7(10): 807-812. |
| [88] | Zoetendal E G, Booijink C C, Klaassens E S, Heilig H G, Kleerebezem M, Smidt H, de Vos W M. Isolation of RNA from bacterial samples of the human gastrointestinal tract. Nature Protocols, 2006, 1(2): 954-959. |
| [89] | Engelbrektson A, Kunin V, Wrighton K C, Zvenigorodsky N, Chen F, Ochman H, Hugenholtz P. Experimental factors affecting PCR-based estimates of microbial species richness and evenness. The ISME Journal, 2010, 4(5): 642-647. |
| [90] | Cai L, Ye L, Tong A H, Lok S, Zhang T. Biased diversity metrics revealed by bacterial 16S pyrotags derived from different primer sets. PloS One, 2013, 8(1): e53649. |
| [91] | Bergmann G T, Bates S T, Eilers K G, Lauber C L, Caporaso J G, Walters W A, Knight R, Fierer N. The under-recognized dominance of Verrucomicrobia in soil bacterial communities. Soil Biology and Biochemistry, 2011, 43(7): 1450-1455. |
| [92] | Hong S, Bunge J, Leslin C, Jeon S, Epstein S S. Polymerase chain reaction primers miss half of rRNA microbial diversity. The ISME Journal, 2009, 3(12): 1365-1373. |
| [93] | Zakrzewski M, Goesmann A, Jaenicke S, Jünemann S, Eikmeyer F, Szczepanowski R, Al-Soud W A, Sørensen S, Pühler A, Schlüter A. Profiling of the metabolically active community from a production-scale biogas plant by means of high-throughput metatranscriptome sequencing. Journal of Biotechnology, 2012, 158(4): 248-258. |
| [94] | Tamaki H, Wright C L, Li X, Lin Q, Hwang C, Wang S, Thimmapuram J, Kamagata Y, Liu W T. Analysis of 16S rRNA amplicon sequencing options on the Roche/454 next-generation titanium sequencing platform. PloS One, 2011, 6(9): e25263. |
| [95] | Wang Y, Qian P Y. Conservative fragments in bacterial 16S rRNA genes and primer design for 16S ribosomal DNA amplicons in metagenomic studies. PloS One, 2009, 4(10): e7401. |
| [96] | Klindworth A, Pruesse E, Schweer T, Peplies J, Quast C, Horn M, Glockner F O. Evaluation of general 16S ribosomal RNA gene PCR primers for classical and next-generation sequencing-based diversity studies. Nucleic Acids Research, 2013, 41(1): e1. |
| [97] | Liu Z, Lozupone C, Hamady M, Bushman F D, Knight R. Short pyrosequencing reads suffice for accurate microbial community analysis. Nucleic Acids Research, 2007, 35(18): e120. |
| [98] | Nossa C W, Oberdorf W E, Yang L, Aas J A, Paster B J, Desantis T Z, Brodie E L, Malamud D, Poles M A, Pei Z. Design of 16S rRNA gene primers for 454 pyrosequencing of the human foregut microbiome. World Journal of Gastroenterology, 2010, 16(33): 4135-4144. |
| [99] | Mao Y, Yannarell A C, Mackie R I. Changes in N-transforming archaea and bacteria in soil during the establishment of bioenergy crops. PloS One, 2011, 6(9): e24750. |
| [100] | Frank K L, Rogers D R, Olins H C, Vidoudez C, Girguis P R. Characterizing the distribution and rates of microbial sulfate reduction at Middle Valley hydrothermal vents. The ISME Journal, 2013, 7(7): 1391-1401. |
| [101] | Teske A, Sorensen K B. Uncultured archaea in deep marine subsurface sediments: have we caught them all? The ISME Journal, 2008, 2(1): 3-18. |
| [102] | Pinto A J, Raskin L. PCR biases distort bacterial and archaeal community structure in pyrosequencing datasets. PloS One, 2012, 7(8): e43093. |
| [103] | Caporaso J G, Lauber C L, Walters W A, Berg-Lyons D, Huntley J, Fierer N, Owens S M, Betley J, Fraser L, Bauer M. Ultra-high-throughput microbial community analysis on the Illumina HiSeq and MiSeq platforms. The ISME Journal, 2012, 6(8): 1621-1624. |
| [104] | Wu J Y, Jiang X T, Jiang Y X, Lu S Y, Zou F, Zhou H W. Effects of polymerase, template dilution and cycle number on PCR based 16 S rRNA diversity analysis using the deep sequencing method. BMC Microbiology, 2010, 10(1): 255-255. |
| [105] | Michu E, Mráčková M, Vyskot B, Žl vová J. Reduction of heteroduplex formation in PCR amplification. Biologia Plantarum, 2010, 54(1): 173-176. |
| [106] | Brockman W, Alvarez P, Young S, Garber M, Giannoukos G, Lee W L, Russ C, Lander E S, Nusbaum C, Jaffe D B. Quality scores and SNP detection in sequencing-by-synthesis systems. Genome Research, 2008, 18(5): 763-770. |
| [107] | Gloor G B, Hummelen R, Macklaim J M, Dickson R J, Fernandes A D, MacPhee R, Reid G. Microbiome profiling by illumina sequencing of combinatorial sequence-tagged PCR products. PloS One, 2010, 5(10): e15406. |
| [108] | Bartram A K, Lynch M D, Stearns J C, Moreno-Hagelsieb G, Neufeld J D. Generation of multimillion-sequence 16S rRNA gene libraries from complex microbial communities by assembling paired-end illumina reads. Applied and Environmental Microbiology, 2011, 77(11): 3846-3852. |
| [109] | Miller C S, Baker B J, Thomas B C, Singer S W, Banfield J F. EMIRGE: reconstruction of full-length ribosomal genes from microbial community short read sequencing data. Genome Biology, 2011, 12(5): R44. |
| [110] | Huse S M, Welch D M, Morrison H G, Sogin M L. Ironing out the wrinkles in the rare biosphere through improved OTU clustering. Environmental Microbiology, 2010, 12(7): 1889-1898. |
| [111] | Pruesse E, Peplies J, Glöckner F O. SINA: Accurate high-throughput multiple sequence alignment of ribosomal RNA genes. Bioinformatics, 2012, 28(14): 1823-1829. |
| [112] | Edgar R C. MUSCLE: a multiple sequence alignment method with reduced time and space complexity. BMC Bioinformatics, 2004, 5(1): 113-113. |
| [113] | Caporaso J G, Bittinger K, Bushman F D, DeSantis T Z, Andersen G L, Knight R. PyNAST: a flexible tool for aligning sequences to a template alignment. Bioinformatics, 2010, 26(2): 266-267. |
| [114] | Reeder J, Knight R. Rapidly denoising pyrosequencing amplicon reads by exploiting rank-abundance distributions. Nature Methods, 2010, 7(9): 668-669. |
| [115] | Quince C, Lanzen A, Davenport R J, Turnbaugh P J. Removing noise from pyrosequenced amplicons. BMC Bioinformatics, 2011, 12(1): 38-38. |
| [116] | Kuczynski J, Stombaugh J, Walters W A, Gonzalez A, Caporaso J G, Knight R. Using QIIME to analyze 16S rRNA gene sequences from microbial communities. Curr Protoc Bioinformatics, 2011, Chapter 10: Unit 10 17, doi: 10.1002/0471250953.bi1007s36.. |
| [117] | Schloss P D, Westcott S L, Ryabin T, Hall J R, Hartmann M, Hollister E B, Lesniewski R A, Oakley B B, Parks D H, Robinson C J, Sahl J W, Stres B, Thallinger G G, Van Horn D J, Weber C F. Introducing mothur: open-source, platform-independent, community-supported software for describing and comparing microbial communities. Applied and Environmental Microbiology, 2009, 75(23): 7537-7541. |
| [118] | Huber T, Faulkner G, Hugenholtz P. Bellerophon: a program to detect chimeric sequences in multiple sequence alignments. Bioinformatics, 2004, 20(14): 2317-2319. |
| [119] | Haas B J, Gevers D, Earl A M, Feldgarden M, Ward D V, Giannoukos G, Ciulla D, Tabbaa D, Highlander S K, Sodergren E, Methe B, DeSantis T Z, Petrosino J F, Knight R, Birren B W. Chimeric 16S rRNA sequence formation and detection in Sanger and 454-pyrosequenced PCR amplicons. Genome Research, 2011, 21(3): 494-504. |
| [120] | Edgar R C, Haas B J, Clemente J C, Quince C, Knight R. UCHIME improves sensitivity and speed of chimera detection. Bioinformatics, 2011, 27(16): 2194-2200. |
| [121] | Sun Y, Cai Y, Liu L, Yu F, Farrell M L, McKendree W, Farmerie W. ESPRIT: estimating species richness using large collections of 16S rRNA pyrosequences. Nucleic Acids Research, 2009, 37(10): e76. |
| [122] | Edgar R C. MUSCLE: multiple sequence alignment with high accuracy and high throughput. Nucleic Acids Research, 2004, 32(5): 1792-1797. |
| [123] | Barriuso J, Valverde J R, Mellado R P. Estimation of bacterial diversity using next generation sequencing of 16S rDNA: a comparison of different workflows. BMC Bioinformatics, 2011, 12: 473-473. |
| [124] | Edgar R C. UPARSE: highly accurate OTU sequences from microbial amplicon reads. Nature Methods, 2013, 10(10): 996-998. |
| [125] | Mizrahi-Man O, Davenport E R, Gilad Y. Taxonomic classification of bacterial 16S rRNA genes using short sequencing reads: evaluation of effective study designs. PloS One, 2013, 8(1): e53608. |
| [126] | Hao X, Jiang R, Chen T. Clustering 16S rRNA for OTU prediction: a method of unsupervised Bayesian clustering. Bioinformatics, 2011, 27(5): 611-618. |
| [127] | Liu Z, DeSantis T Z, Andersen G L, Knight R. Accurate taxonomy assignments from 16S rRNA sequences produced by highly parallel pyrosequencers. Nucleic Acids Research, 2008, 36(18): e120. |
| [128] | Huse S M, Dethlefsen L, Huber J A, Mark Welch D, Relman D A, Sogin M L. Exploring microbial diversity and taxonomy using SSU rRNA hypervariable tag sequencing. PLoS Genetics, 2008, 4(11): e1000255. |
| [129] | Ghosh T S, Gajjalla P, Mohammed M H, Mande S S. C16S-a Hidden Markov Model based algorithm for taxonomic classification of 16S rRNA gene sequences. Genomics, 2012, 99(4): 195-201. |
| [130] | Konstantinidis K T, Ramette A, Tiedje J M. The bacterial species definition in the genomic era. Philosophical Transactions of the Royal Society B: Biological Sciences, 2006, 361(1475): 1929-1940. |
| [131] | Goris J, Konstantinidis K T, Klappenbach J A, Coenye T, Vandamme P, Tiedje J M. DNA-DNA hybridization values and their relationship to whole-genome sequence similarities. International Journal of Systematic and Evolutionary Microbiology, 2007, 57(1): 81-91. |
| [132] | Tindall B J, Rosselló-Móra R, Busse H J, Ludwig W, Kämpfer P. Notes on the characterization of prokaryote strains for taxonomic purposes. International Journal of Systematic and Evolutionary Microbiology, 2010, 60(1): 249-266. |
| [133] | Yarza P, Ludwig W, Euzeby J, Amann R, Schleifer K H, Glockner F O, Rossello-Mora R. Update of the All-Species Living Tree Project based on 16S and 23S rRNA sequence analyses. Systematic and Applied Microbiology, 2010, 33(6): 291-299. |
| [134] | Hall B G. Comparison of the accuracies of several phylogenetic methods using protein and DNA sequences. Molecular Biology and Evolution, 2005, 22(3): 792-802. |
| [135] | Hamady M, Lozupone C, Knight R. Fast UniFrac: facilitating high-throughput phylogenetic analyses of microbial communities including analysis of pyrosequencing and PhyloChip data. The ISME Journal, 2010, 4(1): 17-27. |
| [136] | Page R D. Space, time, form: viewing the Tree of Life. Trends in Ecology & Evolution, 2012, 27(2): 113-120. |
| [137] | Mori H, Maruyama F, Kurokawa K. VITCOMIC: visualization tool for taxonomic compositions of microbial communities based on 16S rRNA gene sequences. BMC Bioinformatics, 2010, 11(1): 332-332. |
| [138] | Flores G E, Henley J B, Fierer N. A direct PCR approach to accelerate analyses of human-associated microbial communities. PloS One, 2012, 7(9): e44563-e44563. |
| [139] | Kembel S W, Cowan P D, Helmus M R, Cornwell W K, Morlon H, Ackerly D D, Blomberg S P, Webb C O. Picante: R tools for integrating phylogenies and ecology. Bioinformatics, 2010, 26(11): 1463-1464. |
| [140] | Lozupone C A, Knight R. Species divergence and the measurement of microbial diversity. FEMS Microbiology Reviews, 2008, 32(4): 557-578. |
| [141] | Ramette A. Multivariate analyses in microbial ecology. FEMS Microbiology Ecology, 2007, 62(2): 142-160. |
| [142] | Lindstrom E S, Kamst-van Agterveld M P, Zwart G. Distribution of typical freshwater bacterial groups is associated with pH, temperature, and lake water retention time. Applied and Environmental Microbiology, 2005, 71(12): 8201-8206. |
| [143] | Kuczynski J, Liu Z, Lozupone C, McDonald D, Fierer N, Knight R. Microbial community resemblance methods differ in their ability to detect biologically relevant patterns. Nature Methods, 2010, 7(10): 813-819. |
| [144] | Bryant J A, Stewart F J, Eppley J M, DeLong E F. Microbial community phylogenetic and trait diversity declines with depth in a marine oxygen minimum zone. Ecology, 2012, 93(7): 1659-1673. |
| [145] | Bryant J A, Lamanna C, Morlon H, Kerkhoff A J, Enquist B J, Green J L. Microbes on mountainsides: contrasting elevational patterns of bacterial and plant diversity. Proceedings of the National Academy of Sciences of the United States of America, 2008, 105(S1): 11505-11511. |
| [146] | Lozupone C, Hamady M, Knight R. UniFrac-an online tool for comparing microbial community diversity in a phylogenetic context. BMC Bioinformatics, 2006, 7(1): 371-371. |
| [147] | Lozupone C A, Hamady M, Kelley S T, Knight R. Quantitative and qualitative β diversity measures lead to different insights into factors that structure microbial communities. Applied and Environmental Microbiology, 2007, 73(5): 1576-1585. |
| [148] | Chang Q, Luan Y, Sun F. Variance adjusted weighted UniFrac: a powerful beta diversity measure for comparing communities based on phylogeny. BMC Bioinformatics, 2011, 12: 118-118. |
| [149] | Rosenberg M S, Anderson C D. PASSaGE: pattern analysis, spatial statistics and geographic exegesis. Version 2. Methods in Ecology and Evolution, 2011, 2(3): 229-232. |
| [150] | Schloss P D, Handelsman J. Introducing SONS, a tool for operational taxonomic unit-based comparisons of microbial community memberships and structures. Applied and Environmental Microbiology, 2006, 72(10): 6773-6779. |
| [151] | Schloss P D, Handelsman J. Introducing TreeClimber, a test to compare microbial community structures. Applied and Environmental Microbiology, 2006, 72(4): 2379-2384. |
| [152] | Deng Y, Jiang Y H, Yang Y, He Z, Luo F, Zhou J. Molecular ecological network analyses. BMC Bioinformatics, 2012, 13(1): 113-113. |
| [153] | Larsen P E, Field D, Gilbert J A. Predicting bacterial community assemblages using an artificial neural network approach. Nature Methods, 2012, 9(6): 621-625. |
| [154] | Pagaling E, Strathdee F, Spears B M, Cates M E, Allen R J, Free A. Community history affects the predictability of microbial ecosystem development. The ISME Journal, 2014, 8(1): 19-30. |
| [155] | Langille M G, Zaneveld J, Caporaso J G, McDonald D, Knights D, Reyes J A, Clemente J C, Burkepile D E, Thurber R L V, Knight R. Predictive functional profiling of microbial communities using 16S rRNA marker gene sequences. Nature Biotechnology, 2013, 31(9): 814-821. |
| [156] | Human Microbiome Project Consortium. Structure, function and diversity of the healthy human microbiome. Nature, 2012, 486(7402): 207-214. |
| [157] | Gilbert J A, Meyer F, Jansson J, Gordon J, Pace N, Tiedje J, Ley R, Fierer N, Field D, Kyrpides N, Glockner F O, Klenk H P, Wommack K E, Glass E, Docherty K, Gallery R, Stevens R, Knight R. The Earth Microbiome Project: Meeting report of the ""1 EMP meeting on sample selection and acquisition"" at Argonne National Laboratory October 6 2010. Standards in Genomic Sciences, 2010, 3(3): 249-253. |
| [158] | Götzenberger L, de Bello F, Bråthen K A, Davison J, Dubuis A, Guisan A, Lepš J, Lindborg R, Moora M, Pärtel M, Pellissier L, Pottier J, Vittoz P, Zobel K, Zobel M. Ecological assembly rules in plant communities-approaches, patterns and prospects. Biological Reviews, 2012, 87(1): 111-127. |