 2015, Vol. 35
文章信息
- 傅煜, 雷渊才, 曾伟生
- FU Yu, LEI Yuancai, ZENG Weisheng
- 单木生物量模型估计区域尺度生物量的不确定性
- Uncertainty analysis for regional-level above-ground biomass estimates based on individual tree biomass model
- 生态学报, 2015, 35(23): 7738-7747
- Acta Ecologica Sinica, 2015, 35(23): 7738-7747
- http://dx.doi.org/10.5846/stxb201405130980
-
文章历史
- 收稿日期: 2014-05-13
- 网络出版日期: 2015-05-19


2. 国家林业局调查规划设计院 北京 100714
2. Academy of Forest Inventory and Planning, State Forestry Administration, Beijing 100714, China
随着联合国政府间气候变化专门委员会(IPCC)指南明确强调所有缔约国有义务按照可监测、可汇报、可核查的“三可”原则(MRV)报告本国森林生物量、碳储量和碳汇能力估计及其不确定性的度量结果和降低措施[1, 2],基于森林资源清查数据的区域尺度森林生物量、碳储量估算成为近年来国内外研究热点[3, 4, 5, 6, 7]。森林资源清查的样地布设通常采用系统抽样方法,基于清查数据估计区域或更大尺度的森林生物量,首先采用单木生物量模型估计每个树种的单株木生物量,然后合计推算样地水平生物量,再通过加权平均等方法估计林分及更大尺度的森林生物量。在整个推算过程中普遍存在着大量不确定性,尤其是单木模型的不确定性会随着尺度的扩大而不断传递累积,最终导致区域尺度森林生物量的估测结果偏离实际情况[8],但是针对该部分不确定性的度量还没有引起足够的重视[4]。
导致单木生物量模型不确定性的来源主要有4个:模型的函数形式定义不当、建模数据的测量误差、模型残差变异性和模型参数变异性。关于函数形式定义不当和测量误差方面已有广泛研究[9, 10, 11],在此不予以讨论。本文基于森林资源连续清查系统抽样体系江西省杉木调查数据和杉木生物量数据,采用Monte Carlo法模拟由单木生物量模型推算区域尺度地上生物量的过程,估计2009年江西省杉木地上总生物量,并以均方根误差和相对均方根误差为度量指标对生物量估计中的不确定性进行估测。基于不同单木生物量建模样本量及决定系数R2,通过Monte Carlo模拟法分别研究单木生物量模型的参数变异性及残差变异性对区域尺度生物量估计及其不确定性度量的影响,为国家温室气体排放报告提供方法学和实践上的支持。
1 数据来源 1.1 调查数据集本文研究区为江西省全域(113°34′—118°29 ′E,24°29—30°05′N),数据源于第七次全国森林资源连续清查系统抽样体系江西省固定样地,总面积固定样地数为2610个,各样地面积为0.067hm2,其中有林样地1673个。全省包括29个树种139783株树,杉木(Cunninghamia lanceolata)为最主要树种,共57351株,约占全树种的40.7%。样地进行每株木检测,起测直径为5cm,杉木调查数据的单木胸径统计如表1所示。
| 含杉木样地数Number of plots including C. lanceolata | 株数Number of C. lanceolata | 胸径 DBH/cm | |||
| 最小值Min. | 最大值Max. | 平均值Mean | 标准差S.D. | ||
| 1113 | 57351 | 5.00 | 47.20 | 10.26 | 3.940 |
建立杉木地上生物量模型所用数据来自我国江西省70株杉木样木的立木地上生物量实测数据,采集时间为2009年6月至9月份。样木数按2、4、6、8、12、16、20、26、32、38cm 以上共10 个径阶均匀分配,每个径阶的样木数按树高级从低到高尽量均匀分配,在大尺度范围内具有广泛的代表性。全部样木都实测胸径、地径和冠幅,将样木伐倒后,测量其树干长度(树高)和活树冠长度(冠长),分干材、干皮、树枝、树叶称鲜重,并分别抽取样品带回实验室,在85℃恒温下烘干至恒重,根据样品鲜重和干重分别推算出样木各部分干重并汇总得到地上部分干重。由于江西省森林资源连续清查数据中没有提供树高实测数据,本文仅采用胸径为唯一自变量建立一元单木生物量估测模型,建模数据统计见表2。为方便理解,后文将以S1、S2分别表示调查数据集和建模数据集。
| 变量Variables | 杉木 C. lanceolata ( N=70株) | |||
| 平均值 Mean | 标准差 SD | 最小值 Min | 最大值 Max | |
| 胸径 DBH/cm | 16.59 | 11.98 | 1.60 | 42.40 |
| 地上生物量 Above ground Biomass/kg | 115.78 | 164.39 | 0.43 | 596.59 |
蒙特卡洛(Monte Carlo)模拟法的基本思想是通过反复模拟某随机事件的发生过程,以这个随机事件出现的频率来估计它的概率特征。应用复杂模型进行区域尺度生物量估计时所产生的不确定性来源复杂且较难度量,而Monte Carlo模拟法在解决这一问题上有显著的优势。本文将采用Monte Carlo模拟法对江西省杉木进行区域尺度地上生物量估计及其不确定性度量,并研究单木生物量模型的参数变异性和残差变异性对区域尺度生物量估计中不确定性的影响。
2.1 基于Monte Carlo模拟法的区域尺度生物量估计及其不确定性度量 2.1.1 区域尺度生物量模型的确定基于回归模型法的单木生物量估计通常采用的单木生物量模型形式为:
式中,Y为因变量,X为自变量,β为单木生物量模型参数,ε为模型残差。本文基于建模数据集S2中70株杉木生物量数据,以单木地上生物量(gi)为因变量、单木胸径(dbhi)为变量,采用普通最小二乘法拟合公式(1)中参数β,建立的单木地上生物量(
 i)估测回归模型:
式中,β0、β1为模型估计参数,εi为模型残差:
式中,
i)估测回归模型:
式中,β0、β1为模型估计参数,εi为模型残差:
式中,
 i=β0·dbhiβ1为生物量的无偏估计。为检验模型的拟合效果,本文引入决定系数
 ,式中,n为S2样本量。通常的R2值越接近1说明自变量对因变量的解释能力越强,模型的拟合效果越好。
2.1.2 Monte Carlo法模拟步骤
,式中,n为S2样本量。通常的R2值越接近1说明自变量对因变量的解释能力越强,模型的拟合效果越好。
2.1.2 Monte Carlo法模拟步骤
步骤一
(i)基于全部建模数据70株杉木,根据公式(2)和公式(3)预测S2内单木生物量的无偏估计值(i)和残差(εi)。
(ii)通常假设残差εi服从均值为零的正态分布εi=N(0,σ2),其中残差标准差σ满足下式,
式中,E[·]表示ln(
 )均值,为σ的样本估计值,γ1、γ2是单木生物量模型参数[10]。本文将随机生成一组服从εβ-N(0,exp(γ1+γ2·ln(dbh)))的数组来模拟新的残差值εβ。
(iii)将生物量估计值i与εβ合并得到g′,并以g′为新的单木地上生物量与S2中的单木dbh重新建立单木生物量模型,即:

步骤二
(i)调查数据中的单木地上生物量估计。将S1调查数据中的单木dbh代入公式(5)估测江西省杉木单木地上生物量,
式中,i为S1中单木号,j为样地号。
(ii)调查数据的样地生物量估计。合计样地内单木生物,得到S1每个样地的生物量:
式中,nj为第j个样地内的样木株数。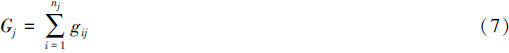
(iii)区域尺度生物量估计。合计样地生物量推算区域尺度生物量均值并推算误差:
式中,nplot为S1样地个数,k表示第k次模拟。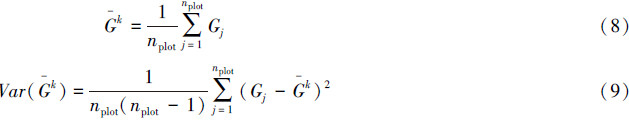
步骤三
重复实施步骤一和二,直至预测结果趋于平稳,并推算S1数据中区域尺度地上生物量及误差,
式中,nk为模拟次数,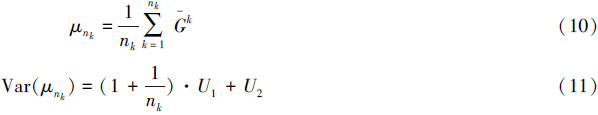
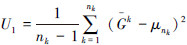 是模拟过程之间的变异性导致的误差,
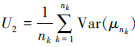 是模拟过程内的误差。
生物量估测中不确定性的度量指标通常采用标准误或均方根误差(RMSE)和相对均方根误差(Relative RMSE)表示[9, 12],公式如下:
2.2 建模样本量对区域尺度生物量估计中不确定性的影响
单木生物量方程作为较复杂的非线性模型,导致不确定性的因素也较为复杂多样,为研究区域尺度森林地上生物量估计中建模样本量差异对模型不确定性的影响,本文采用4种不同样本量水平的建模数据集,即样本大小分别为n=30,n=40,n=50和n=60,分别进行Monte Carlo模拟,将各水平下区域尺度生物量估计及不确定性度量结果进行比较分析。
步骤一
(i)从S2数据集中随机抽取n株杉木数据作为新的建模数据集S2’。
(ii)基于公式(1)形式,以单木地上生物量(g)为因变量、胸径(dbh)为自变量,采用普通最小二乘法建立单木生物量模型
由于n始终小于最大样本量70株,因此每次随机抽取的杉木数据会有所不同,那么建立的单木生物量模型参数φ0、φ1存在差异,这个差异形成了不同建模样本量水平对区域尺度生物量估计不确定性的影响。
步骤二
(i)估计江西省单木水平杉木生物量。将S1调查数据带入公式(13)估测江西省杉木单木地上生物量ij,其中i为S1中单木号,j为样地号。
(ii)采用公式(7)估计江西省样地水平杉木生物量。
(iii)采用公式(8)、(9)估计江西省尺度第k次模拟地上生物量均值和误差。
步骤三
基于n=30,n=40,n=50和n=60分别反复模拟步骤一和二,采用公式(10)、(11)、(12)估计不同建模样本量水平下的江西省区域尺度地上生物量、误差、不确定性和相对不确定性,当μnk值和Var(μnk)值趋于平稳时,模拟过程可以终止。
2.3 残差变异性对区域尺度生物量估计中不确定性的影响残差对生物量估计的影响主要体现在决定系数R2,本文设定了4个水平的R2,即R2=0.99、R2=0.95、R2=0.90和R2=85,在各水平下分别进行Monte Carlo模拟以研究残差变异性对区域尺度生物量估计和不确定性度量的影响。
步骤一:
(i)基于建模数据集S2中杉木全部数据,即70株,以地上生物量g为因变量、胸径dbh为自变量,采用普通最小二乘法建立单木生物量模型,即公式(2)。
(ii)残差项设置。采用公式(2)预测S2内单木生物量的无偏估计值i、残差εi,并基于残差项ε和S2杉木胸径dbh,拟合满足公式(4)的参数γ1、γ2。
(iii)单木生物量模型确定,公式如下:
式中,i为样木号,β0、β1为单木生物量模型参数,ε为满足ε-N(0,exp(γ1+γ2·ln(dbh)))的正态分布数组,λ是为构建决定系数R2=0.99、R2=0.95、R2=0.90和R2=85的修正因子。
步骤二
(i)估计江西省单木水平杉木生物量。将S1调查数据带入公式(14)估测江西省杉木单木地上生物量ij,式中i为S1中单木号,j为样地号。
(ii)采用公式(7)估计江西省样地水平杉木生物量。
(iii)采用公式(8)、(9)估计第k次模拟的江西省区域尺度地上生物量均值和误差。
步骤三
基于决定系数R2=0.99、R2=0.95、R2=0.90和R2=85分别重复模拟步骤一和二,采用公式(10)、(11)、(12)估计不同建模样本量水平下的江西省区域尺度地上生物量、误差、不确定性和相对不确定性,μnk值和Var(μnk)值趋于平稳时,模拟过程可以终止。
文中单木生物量模型参数估计和Monte Carlo模拟的全过程采用R软件实现。模拟过程中,单木地上生物量估测模型调用R软件nls()函数进行非线性回归,拟合β、α等模型参数;调用lm()函数建立残差(ε)与胸径(dbh)的函数关系,估计单位面积生物量(μnk),并以RMSE和Relative RMSE为度量指标推算不确定性。
3 结果分析与讨论 3.1 区域尺度生物量估计 3.1.1 单木生物量模型拟合效果表3为公式(2)的参数估计结果,结合图1和表3的决定系数(R2=0.9716)可知,依据公式(2)建立的生物量估测模型对样本点的回归效果较好,图1数据点较为均匀地分布在直线y=x附近,说明模型预测值能较好地描述实测值。
| 模型形式 Model form | 模型参数β 0Model parameter | 模型参数β 1Model parameter | 决定系数R 2Coefficient of Determination |
|
i=β
0·dbh
iβ
1 |
0.0872 | 2.3468 | 0.9716 |

|
| 图 1 单木生物量估计模型的拟合效果 Fig.1 The quality of fit of the model for AGB estimation |
经对数化处理后,模型(1)残差与树干胸径呈现明显的线性关系,且满足ε—N(0,exp(-3.75+2.048·ln(dbh)))的正态分布。
图2表示依据公式(10)、(12),采用Monte Carlo法对2009年江西省杉木地上生物量和不确定性进行1000次模拟的情况。如图2所示,模拟200次后,区域尺度生物量估计值和不确定性度量值趋于稳定。图3为1000次Monte Carlo法模拟结果的变异系数(均方根误差/生物量均值)的频率直方图,由图3可知:变异系数范围主要集中在0.0398至0.0402之间,变异系数越小说明模型的估计精度越高,因此本文方法在提升模型预测精度方面取得了较好的效果。

|
| 图 2 生物量和不确定性的模拟趋势 Fig.2 Above ground biomass and uncertainty |

|
| 图 3 变异系数的频率直方图 Fig.3 Histogram of coefficeients of variation |
表4为1000次Monte Carlo法模拟计算江西省2009年杉木地上生物量和不确定性的预测值。由表4可知:2009年江西省杉木地上生物量为(19.84±1.27) t/hm2,不确定性占生物量估计值为6.41%。
| 建模数据量Modeling sample size | 生物量Estimates/(t/hm 2) | 均方根误差RMSE/(t/hm 2) | 相对均方根误差Relative RMSE/% |
| 70 | 19.84 | 1.27 | 6.41 |
图4表示基于n=30,n=40,n=50和n=60 4种水平的建模样本量和公式(10)、(12),经过Monte Carlo法1000次的模拟计算的江西省2009年杉木地上生物量和不确定性的模拟变化趋势。由图4可知,区域尺度生物量估计值和不确定性由剧烈波动状态到趋于平稳所需的运算时间随建模样本量的增大而明显缩短,不确定性也随建模样本量n的增大而逐渐减小。

|
| 图 4 基于不同建模样本量n的Monte Carlo模拟趋势 Fig.4 Monte Carlo simulations based on various modeling sample size (n) |
表5是在建模样本量n=30,n=40,n=50和n=60的4种情况下,经1000次Monte Carlo法模拟运算所估计的2009年江西省杉木的地上生物量、不确定性(RMSE)和相对不确定性(Relative RMSE)的结果。由表5可知,2009年江西省杉木的地上生物量随建模样本量n的增大而略有增加,从19.44 t/hm2上升到19.71 t/hm2。而不确定性则由n=30时的2.89 t/hm2下降到n=60时的1.94 t/hm2,不确定性相对估计值的占有率从14.86%下降至9.85%,说明建模样本量可能是导致低估生物量和高估不确定性的原因之一。导致该现象的原因可能是单木生物量模型的协方差和标准误随着建模数据量的减少而增大,从而增加了因单木生物量模型参数的变异性导致的区域尺度生物量估计中的不确定性,该结果与McRoberts等人[13]、Zianis等人[14]的研究结果一致。
| 建模数据量 nModeling sample size | 生物量Estimates/(t/hm 2) | 均方根误差RMSE/(t/hm 2) | 相对均方根误差Relative RMSE/% |
| 60 | 19.71 | 1.94 | 9.85 |
| 50 | 19.63 | 2.12 | 10.79 |
| 40 | 19.47 | 2.48 | 12.77 |
| 30 | 19.44 | 2.89 | 14.86 |
图5表示基于决定系数R2=0.99、R2=0.95、R2=0.90和R2=0.85的4种情况和公式(10)、(12),2000次的Monte Carlo模拟变化趋势。由于4种R2水平下的模拟运算均基于相同的单木生物量模型参数,影响生物量估计值稳定性的主要因素就是模型的残差。由图5可知,随着R2的提高,生物量均值和不确定性值曲线波动的剧烈程度逐渐减弱,模拟结果达到稳定状态所需的运算时间也逐渐缩短。

|
| 图 5 基于不同R2的Monte Carlo模拟趋势 Fig.5 Monte Carlo simulations based on various determination coefficient (R2) |
表6为基于建模样本量为n=70株时,R2=0.99、R2=0.95、R2=0.90和R2=0.85的4种情况下,经2000次Monte Carlo法模拟运算所估计的2009年江西省杉木的地上生物量、不确定性(RMSE)和相对不确定性(Relative RMSE)的结果。由表6可知,2009年江西省杉木的地上生物量和不确定性基本平稳地分别保持在19.79 t/hm2和0.79 t/hm2,不确定性相对于生物量估计值约4%,不确定性随R2的增大而略有降低。残差的变异会影响模型预测结果的波动范围,从而影响估计值的方差,因此残差值的增大会导致模型R2的降低,模型的预测精度受到限制,不确定性随之增加,与McRoberts等人[13]在研究森林蓄积的结果一致。但不确定性随R2升高而降低的幅度非常小,仅0.0012 t/hm2,而不同建模样本量的不确定性变化幅度为0.95 t/hm2,说明建模样本量对区域尺度生物量估计不确定性的影响更大。
| 建模数据量 nModeling sample size | 决定系数 R 2 | 生物量Estimates/(t/hm 2) | 均方根误差RMSE/(t/hm 2) | 相对均方根误差Relative RMSE/% |
| 70 | 0.99 | 19.7870 | 0.7932 | 4.0085 |
| 0.95 | 19.7871 | 0.7935 | 4.0101 | |
| 0.90 | 19.7874 | 0.7940 | 4.0125 | |
| 0.85 | 19.7872 | 0.7944 | 4.0147 |
(1)Monte Carlo模拟法通过大量反复模拟生物量建模和估测过程,能提供稳定可靠的区域尺度生物量估计和不确定性度量值,是一种估计区域尺度生物量及度量不确定性的适用方法,具有很高的应用价值。
(2)建模样本量导致的单木生物量模型参数变异性对区域尺度生物量估计不确定性的影响比较大。采用Monte Carlo模拟法进行区域尺度生物量估计和不确定性度量时,生物量估计值随建模样本量水平的提高逐渐增加,不确定性随之降低,Monte Carlo模拟结果达到稳定所需要的运算时间逐渐缩短。说明建模数据量可能是引起低估生物量和不确定性增大的主要问题。因此,增加建模数据量能有效提高生物量模型的估计精度、准确度以及工作效率,并降低不确定性。
(3)不同决定系数R2所反应的模型残差变异性对生物量估计,尤其是大尺度生物量估计的影响较小,但较高的R2能有效缩短Monte Carlo模拟的运算时间。
(4)由于Monte Carlo模拟法的可靠性和可行性均非常高,本文方法同样适用于森林地上单木各组分生物量(树干、树枝、树皮、树叶等)、地下部分生物量、碳储量、蓄积量的估计和不确定性度量,该部分研究还有待进一步展开。
致谢:感谢姜俊等同学在R软件实现中给予的帮助。
| [1] | Penman J D, Kruger I, Galbally T, Hiraishi B, Nyenzi S. Emmanuel, L. Buendia, R. Hoppaus, T. Martinsen, and J. Meijer. Good practice guidance and uncertainty management in national greenhouse gas inventories. IPCC National Greenhouse Cost Inventories programme, Technical Support Unit, 2000 |
| [2] | IPCC. Guidelines for national greenhouse gas inventories. Institute for Global Environmental Strategies, Japan, 2006 |
| [3] | Lehtonen A, Cienciala E, Tatarinov F, MäkipääR. Uncertainty estimation of biomass expansion factors for Norway spruce in the Czech Republic. Annals of forest science, 2007, 64(2): 133-140. |
| [4] | McRoberts R E, Westfall J A. Effects of uncertainty in model predictions of individual tree volume on large area volume estimates. Forest Science, 2014, 60(1): 34-42. |
| [5] | 李海奎, 雷渊才. 中国森林植被生物量和碳储量评估. 北京: 中国林业出版社, 2010. |
| [6] | Quentin M M, Alfred N, Nestor L E O, Judicaël L, Hugues G, Géraud S M, Joël L, Donald M I, Franck K D, Roland Z K, Karl H B B, Nicaise L, Bertrand M, Nicolas P. How to improve allometric equations to estimate forest biomass stocks? Some hints from a central African forest. Canadian Journal of Forest Research, 2014, 44(7): 685-691. |
| [7] | Li H K, Zhao P X. Improving the accuracy of tree-level aboveground biomass equations with height classification at a large regional scale. Forest Ecology and Management, 2013, 289: 153-163. |
| [8] | Dietze M C, Wolosin M S, Clark J S. Capturing diversity and interspecific variability in allometries: a hierarchical approach. Forest Ecology and Management, 2008, 256(11): 1939-1948. |
| [9] | Chave J, Condit R, Aguilar S, Aguilar S, Hernandez A, Lao S, Perez R. Error propagation and scaling for tropical forest biomass estimates. Philosophical Transactions of the Royal Society of London. Series B: Biological Sciences, 2004, 359(1443): 409-420. |
| [10] | McRoberts R E, Lessard V C. Estimating the uncertainty in diameter growth model predictions and its effects on the uncertainty of annual inventory estimates // Reams G A, McRoberts R E, Van Deusen P C, eds. Proceedings of the Second Annual Forest Inventory and Analysis Symposium. Asheville, NC: U.S. Department of Agriculture, Forest Service, Southern Research Station, 2001. |
| [11] | Cohen R, Kaino J, Okello J A, Bosire J O, Kairo J G, Mencuccini M. Propagating uncertainty to estimates of above-ground biomass for Kenyan mangroves: A scaling procedure from tree to landscape level. Forest Ecology and Management, 2013, 310: 968-982. |
| [12] | Ahmed R, Siqueira P, Hensley S, Bergen K. Uncertainty of forest biomass estimates in north temperate forests due to allometry: implications for remote sensing. Remote Sensing, 2013, 5(6): 3007-3036. |
| [13] | McRoberts R E, Næsset E, Gobakken T. Inference for lidar-assisted estimation of forest growing stock volume. Remote Sensing of Environment, 2013, 128: 268-275. |
| [14] | Zianis D, Muukkonen P, MäkipääR, Mencuccin M. Biomass and stem volume equations for tree species in Europe. The Finnish Society of Forest Science, The Finnish Forest Research Institute, 2005. |