 2015, Vol. 35
文章信息
- 杨伟, 张树文, 姜晓丽
- YANG Wei, ZHANG Shuwen, JIANG Xiaoli
- 基于MODIS时序数据的黑龙江流域火烧迹地提取
- Burned area mapping for Heilongjiang basin based on MODIS time series data
- 生态学报, 2015, 35(17): 5866-5873
- Acta Ecologica Sinica, 2015, 35(17): 5866-5873
- http://dx.doi.org/10.5846/stxb201312313076
-
文章历史
- 收稿日期: 2013-12-31
- 网络出版日期: 2014-11-03


2. 中国科学院东北地理与农业生态研究所, 长春 130102;
3. 太原师范学院城镇与区域发展研究所, 晋中 030619
2. Northeast Institute of Geography and Agroecology, Chinese Academy of Science, Changchun 130102, China;
3. Institute of Urban and District Development, Taiyuan Normal University, Jinzhong 030619, China
火灾是影响众多生态系统(森林、草地等)的一个重要的扰动因素。火灾对于植被的结构和组成具有显著的作用,被认为是一个重要的“地表管理工具”[1]。以森林生态系统为例,火灾是森林生态系统最为重要的干扰之一,全球平均每年约有1%的森林受到火灾的影响[2]。森林生态系统是全球碳循环的重要组成部分,火灾的发生通过改变森林生态系统的格局与过程,进而改变整个生态系统的碳循环以及分配过程[3]。此外,森林火灾对于气候变暖也有着重要的响应[4, 5, 6]。研究表明,北方森林的火灾发生范围对于温度的增加非常敏感,受气候变化的影响较为显著[7]。此外,还有研究认为气候变暖很有可能影响到传统的火灾循环,例如缩短火灾的周期、增大火灾尺度等[8, 9]。
不论是对于碳循环的影响研究,还是森林火灾与气候变暖的相关性研究,火烧迹地的空间信息都是一个重要的基础参数。传统的火烧迹地信息主要来源于统计数据,难以覆盖较大的区域,收集较为困难,且难以将数据进行空间化。遥感技术的发展为解决这一问题提供了很好的手段,特别是随着遥感数据时空分辨率的提高,使得遥感数据能够更为准确的对地表过程进行刻画[10]。
在区域或者全球尺度下,为获取长时间序列的火烧迹地信息,中空间分辨率且具有高时间分辨率的遥感数据被认为是最好的选择。目前,应用最为广泛的为AVHRR(Advanced Very High Resolution Radiometer)数据[11, 12, 13]与MODIS(Moderate-Resolution Imaging Spectroradia-meter) 数据[14, 15]。前者由于发射时间较早,时间序列较长而被使用。但研究表明AVHRR数据提取火烧迹地信息存在一定的潜在误差,主要来源于辐射的不稳定性、云污染以及辐射传输问题等方面[16, 17, 18]。较之AVHRR数据,MODIS数据在这些方面都得到了很大的改善,但其局限在于数据仅从2000年开始。
本文提出了一种基于MODIS时序数据的火烧迹地提取方法,以此为基础对黑龙江流域2000—2011年的火烧迹地信息进行了提取,生成研究区长时间序列火烧迹地分布图,并对其分布特征进行了分析。
1 材料与方法 1.1 研究区研究区选择位于西伯利亚北方森林南部的黑龙江流域(41°45′—53°33′N,115°13′—135°05′E),面积208×104 km2,西起蒙古高原,包括蒙古(东方省、苏赫巴托尔省等)、俄罗斯(阿穆尔州、哈巴罗夫斯克、外贝加尔等)和中国(黑龙江省、吉林省、辽宁省、内蒙古自治区等)的13个省及朝鲜的小部分,研究区植被覆盖度较高(图 1),受森林火灾影响较为严重。流域的东部地区主要属于温带湿润季风气候,这是全球季风气候的最北缘,西部主要受大陆性气候的影响。全年平均气温在-8 ℃到6 ℃之间,但其时空分布差异显著。同时,流域内降水量的时空分布也很不均衡,年平均降水量主要在250—800 mm,大约50%以上的降水量集中在最热的夏季,而近7个月的干季(1—4月,10—12月)降水量仅为25%;在空间上,降水主要集中在沿海地带,向西逐渐递减。

|
| 图1 研究区位置及其土地覆被 Fig.1 Location and land cover of Heilongjiang basin |
研究选择数据为MODIS 8d合成地表反射率数据MOD09Q1(MODIS atmospherically- correct Level 3 8-Day composite Surface Reflectance products,空间分辨率250 m)以及MODIS 8d合成火产品数据MOD14A2(MODIS Level 3 8-Day composite active fire products,空间分辨率1 km)。其中,MODIS火产品数据为MODIS火情监测算法下提取的火点信息[19, 20],其算法依据主要为火灾发生时的热学特性,代表火灾发生时的温度异常。
MOD09Q1与MOD14A2产品均采用Sinusoidal投影系统发布,数据格式为HDF (Hierarchy Data Format)。研究区共涉及6景MODIS标准分幅数据。下载研究区2000—2011年的MODIS产品数据(每年34期×12年×6景)。时间选择为每年的2月末至11月初,这一时间为火灾发生集中的时间段。对数据进行投影转换及裁剪处理。此外,由于数据空间分辨率不一致,需要将MOD14A2产品重采样为250 m分辨率,与MOD09Q1产品相一致。
1.3 火烧迹地提取方法基于遥感的火灾研究主要包括火点(active fire)监测[21, 22]与火烧迹地(burn scars)提取[23, 24]两类,两者均可以产生火烧迹地数据[25]。火点监测主要是基于火灾发生时的温度异常,监测卫星过境时可能发生火灾的像元,对火点进行实时观测。这一过程的主要目的在于捕捉火灾发生的时间以及位置信息,虽然也可以产生火烧迹地信息,但结果并不可靠[26, 27]。火烧迹地提取通过对比火灾发生前后的光谱反射特征或者光谱指数特征变化来识别火烧迹地,从而达到提取火烧迹地的目的[28, 29]。这一方法的缺陷在于,一些与火灾发生具有类似光谱特征的事件较难区分,如洪水、森林砍伐以及农作物收获等导致的光谱特征变化。本文的火烧迹地提取方法以后者为基础,并进行了改进,以消除类似的混淆事件。
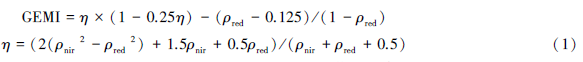
1.3.1 判别指数选取火烧迹地识别方法是通过比较火灾发生前后的光谱特征变化来提取火烧面积。因而需要选取适合的光谱指数来进行表征,如NDVI(Normalized Difference Vegetation Index)、BBFI(Burned Boreal Forest Index)、GEMI(Global Environmental Monitoring Index)以及BAI (Burned Area Index)等。其中,NDVI的应用最为广泛。NDVI能够很好的对植被覆盖进行描述[30, 31],但研究表明NDVI在植被覆盖度较高的地区容易达到饱和[32],且在火烧迹地信息提取中存在较大的潜在误差[33]。因此,选用GEMI作为识别火烧迹地的主要判别指数,其计算公式如下:
为了避免采用单一光谱指数所带来的潜在误差,选择了另一个光谱指数BAI来作进一步的限定,其计算公式如下:

除此之外,在比较火灾发生前后光谱特征变化的同时,为了考虑火灾发生时的热学特性,即温度异常,将MODIS火产品数据作为一个输入波段加入到判别流程,以提高判别精度。
1.3.2 判别流程火烧迹地的识别流程主要分为两个阶段:首先,设定较为严格的判别阈值以提取火烧的核心像元——即火灾最有可能发生的像元。这一阶段的主要目标在于尽可能的减少错判误差,因而需要对火灾发生前后的光谱指数变化设定严格的阈值,并且同时用使用MODIS火灾产品进行筛选,以表示提取像元在相关植被指数变化前曾出现温度异常。这一过程同时考虑了火灾发生前后地表植被的突变以及火灾发生时的温度异常,从而可以与其他造成地表突变的因素相区分。其次,对第一阶段提取的核心像元15公里范围内的光谱指数变化特征进行判别,设定较为宽松的阈值,以尽可能减少漏判误差。判别流程及判别条件如图 2所示。

|
| 图2 算法流程图 Fig.2 Flowchart of algorithm |
第一阶段的提取过程以GEMI、BAI、以及MOD14A2产品为基础,具体的判别条件如下所示:
首先,火灾发生之前的GEMI值必须大于一定的阈值,以确保判别区域为植被覆盖。

火灾发生后,GEMI值必须表现出显著的下降,且这一下降过程必须持续一定的时间,以区分由云污染等造成的GEMI值的短暂下降。这一过程通过以下两个判别条件来实现:


然后,使用BAI指数来对火烧像元做进一步的限定。火灾发生后,BAI值显著增加,其判别条件如下:

最后,使用MODIS 火产品数据来对火烧像元进行掩膜,以保证光谱指数变化前,所提取像元表现出温度异常的特征。

第二阶段的判别过程以第一阶段提取的核心像元为基础,采用较为宽松的阈值来对邻近像元进行判别。在对研究区的火灾发生特征进行分析之后,距离核心像元的最大距离被设定为15 km。第二阶段的火烧迹地信息提取,仅对核心像元15 km范围内像元进行判别,判别条件如下:


最后,将两个阶段的提取结果进行合成。采用一个3×3的变换核,对合成结果进行滤波处理,消除提取过程中产生的小斑块。
2 结果与分析 2.1 精度验证

|
| 图3 黑龙江省火灾发生位置 (2000—2005年) Fig.3 Fire position of Heilongjiang province (2000—2005) |
由于研究区涉及境外地区,验证数据难以获取。考虑到以上提取方法的基础为火烧前后植被指数的变化以及温度的异常,使得该方法对火烧迹地的提取具有普适性,从而可以采用选择典型验证区的方法对算法进行验证。故以黑龙江省为典型研究区,对提取结果进行精度验证。验证数据来源于相关林业部门2000—2005年的火灾统计数据,包括火灾发生的时间、地点、经纬度信息以及过火面积等。
鉴于MODIS产品空间分辨率以及火烧迹地信息提取后进行去除小斑块的滤波处理的需要,对过火面积小于60 hm2(约3×3个像元)的火灾进行剔除,最终得到黑龙江省2000—2005年的火灾验证数据(图 3)。
利用2000年—2005年火灾发生的经纬度信息(图 3)对提取结果进行错判以及漏判分析(表 1)。由于验证数据仅提供了火灾发生的位置,因而不能对提取结果进行空间化(逐像元)的误差分析。以火灾发生的位置信息为参照,对提取结果进行分析,两者一致则认为提取结果正确。如果在标有火灾发生的位置没有提取出火烧迹地信息,被认为是漏判;相反,在没有标出火灾发生的位置,却提取出火烧迹地信息,认为是错判。
| 时间 Time | 2000 | 2001 | 2002 | 2003 | 2004 | 2005 |
| 火灾发生次数Number of fire happened/起 | 88 | 61 | 33 | 62 | 27 | 10 |
| 提取火灾次数Number of fire extracted/起 | 83 | 53 | 36 | 68 | 25 | 13 |
| 漏判Omission error/起 | 21 | 23 | 8 | 11 | 9 | 3 |
| 错判Commission error/起 | 16 | 15 | 11 | 17 | 7 | 6 |
| 提取面积Extracted area/hm2 | 50541.4 | 81837.17 | 45244.2 | 486747 | 155413 | 93757.7 |
| 验证数据Validation area/hm2 | 76613.9 | 128233.9 | 53352.85 | 797247.6 | 185547.2 | 132247.8 |
此外,将提取结果的面积进行汇总与验证数据进行了比较(表 1)。结果显示,2000—2005年每年均有一定的漏判以及错判误差存在,且提取的火烧迹地面积均小于验证数据,总体精度为71%。其中,提取面积精度最高为2002年,达84%;提取面积精度最低为2003年,精度为61%。较之以往的研究[35],精度有所提高。
2.2 黑龙江流域火烧迹地分布特征分析 2.2.1 黑龙江流域火烧迹地信息提取

|
| 图4 黑龙江流域火烧迹地分布 (2000—2011) Fig.4 Distribution of burned area in Heilongjiang basin (2000—2011) |
使用以上所验证的火烧迹地提取方法,以MOD09Q1数据以及MOD14A2数据为基础,对黑龙江流域2000—2011年的火烧迹地信息进行了提取,得到研究区长时间序列火烧迹地分布图(图 4)。
2.2.2 火烧迹地特征分析将黑龙江流域的火烧迹地面积进行逐年汇总,从而得到流域逐年的火烧迹地面积统计数据(图 5)。

|
| 图5 黑龙江流域火烧迹地面积变化 Fig.5 Burned area dynamic in Heilongjiang basin |
黑龙江流域2000—2011年受火灾影响较为严重,年均过火面积达53.21万hm2。火灾发生最严重的年份为2003年,面积为146.79万hm2;而受火灾影响最小的年份为2010年,过火面积仅有18.39万hm2,差距较大。火灾发生较为严重的年份还包括2008年,过火面积也超过了百万公顷,达119.41万hm2。其他年份受火灾影响较为平均,其中2005年相对较为严重,面积为62.41万hm2;其次为2001、2002、2004年以及2011年,火烧迹地面积分别为41.55万hm2、43.83万hm2、43.59万hm2以及43.23万hm2;最后为2000、2006、2007年以及2009年,火烧迹地面积分别为33.08万hm2、38.87万hm2、24.01万公顷以及23.41万hm2。
从火烧迹地的空间特征来看,火烧迹地的分布与森林覆被密切相关,主要分布于黑龙江流域的中、高纬度地区。俄罗斯境内的火烧迹地分布较为均匀,原因在于其高的植被覆盖度。中国境内火烧迹地主要分布于大、小兴安岭以及长白山地区,其中以黑龙江省受影响最为严重。此外,蒙古和朝鲜境内也有少部分火烧迹地分布。
3 结论与讨论长时间序列火烧迹地数据是区域或者全球尺度下森林火灾相关研究的重要基础信息。本文以黑龙江流域为研究区,利用MODIS时序数据对其2000—2011年的火烧迹地信息进行了提取,主要结论如下:
低空间分辨率高时间分辨率的遥感数据是区域或者全球尺度下火烧迹地信息提取的主要数据源,通过建立相应的算法,可以实现长时间序列火烧迹地信息的提取过程。
综合考虑火灾发生前后的植被变化(光谱指数变化)与火灾发生时的热学特征能够更为有效的对火烧迹地信息进行提取,提高提取精度。
黑龙江流域2000—2011年受火灾影响较为严重,年平均产生火烧迹地53.21万hm2,受火灾影响最大年份与最小年份之间的火烧迹地面积差距较大。
本文基于MODIS数据空间分辨率以及提取结果滤波处理的需求,将过火面积大于60 hm2的森林火灾作为验证数据,较之Emilio等使用大于200 hm2的火灾[34]作为验证数据,提高了对算法精度的要求。结果显示主要的漏判误差仍来源于100 hm2左右的森林火灾。证明由于遥感数据空间分辨率的局限,算法对于面积较小的火烧迹地提取具有一定难度。而空间分辨率相对较高的遥感数据,如TM数据,其时间分辨率却难以满足火烧迹地信息提取的要求。遥感数据融合可以较好的解决这一问题,如何采用融合之后的高空间分辨率以及时间分辨率的遥感数据进行更为细致的火烧迹地提取有待深入研究。
| [1] | Dubinin M, Potapov P, Lushchekina A, Radeloff V C. Reconstructing long time series of burned areas in arid grasslands of southern Russia by satellite remote sensing. Remote Sensing of Environment, 2010, 114(8): 1638-1648. |
| [2] | Fraser R H, Li Z. Estimating fire-related parameters in boreal forest using SPOT VEGETATION. Remote Sensing of Environment, 2002, 82(1): 95-110. |
| [3] | 吕爱锋, 田汉勤, 刘永强. 火干扰与生态系统碳循环. 生态学报, 2005, 25(10): 2734-2743. |
| [4] | Amiro B D, Orchansky A L, Barr A G, Black T A, Chambers S D, Chapin III F S, Goulden M L, Litvak M, Liu H P, McCaughey J H, McMillan A, Randerson J T. The effect of post-fire stand age on the boreal forest energy balance. Agricultural and Forest Meteorology, 2006, 140(1/4): 41-50. |
| [5] | Kasischke E S, Turetsky M R. Recent changes in the fire regime across the North American boreal region-Spatial and temporal patterns of burning across Canada and Alaska. Geophysical Research Letters, 2006, 33(9): 1-5. |
| [6] | Morton D C, Collatz G J, Wang D, Randerson J T, Giglio L, Chen Y. Satellite-based assessment of climate controls on US burned area. Biogeosciences, 2013, 10(1): 247-260. |
| [7] | Flannigan M D, Logan K A, Amiro B D, Skinner W R, Stocks B J. Future area burned in Canada. Climatic Change, 2005, 72(1/2): 1-16. |
| [8] | IPCC. Climate Change 2007: The Physical Science Basis. Cambridge: Cambridge University Press, 2007. |
| [9] | Gillet N P, Weaver A J, Zwiers F W, Flannigan M D. Detecting the effect of climate change on Canadian forest fires. Geophysical Research Letters, 2004, 31(18), L18211, doi: 18210.11029/12004GL02 0876. |
| [10] | Mouillot F, Schultz M G, Yue C, Cadule P, Tensey K, Ciais P, Chuvieco E. Ten years of global burned area products from spaceborne remote sensing-A review: Analysis of user needs and recommendations for future developments. International Journal of Applied Earth Observation and Geoinformation, 2014, 26: 64-79. |
| [11] | Vafeidis A T, Drake N A, Wainwright J. A proposed method for modelling the hydrologic response of catchments to burning with the use of remote sensing and GIS. Catena, 2007, 70(3): 396-409. |
| [12] | Pu R L, Li Z Q, Gong P, Csiszar I, Fraser R, Hao W M, Kondragunta S, Weng F Z. Development and analysis of a 12-year daily 1-km forest fire dataset across North America form NOAA/AVHRR data. Remote Sensing of Environment, 2007, 108(2): 198-208. |
| [13] | Sukhinin A I, French N H F, Kasischke E S, Hewson J H, Soja A J, Csiszar I A, Hyer E J, Loboda T, Gonrad S G, Romasko V I, Pavichenko E A, Miskiv S I, Slinkina O A. AVHRR-based mapping of fires in Russia: New products for fire management and carbon cycle studies. Remote Sensing of Environment, 2004, 93(4): 546-564. |
| [14] | Oadilla M, Stehman S V, Litago J, Chuvieco E. Assessing the temporal stability of the accuracy of a time series of burned area products. Remote Sensing, 2014, 6(3): 2050-2068. |
| [15] | Roy D P, Boschetti L, Justice C O, Ju J. The collection 5 MODIS burned area product-Global evaluation by comparison with the MODIS active fire product. Remote Sensing of Environment, 2008, 112(9): 3690-3707. |
| [16] | Barbosa P M, Gregoire J M, Pereira J M C. An algorithm for extracting burned areas from time series of AVHRR GAC data applied at a continental scale. Remote Sensing of Environment, 1999, 69(3): 253-263. |
| [17] | Martin M P, Chuvieco E. Mapping and evaluation of burned land from multi-temporal analysis of AVHRR NDVI images. EARSeL Advances in Remote Sensing, 1995, 4(3): 7-13. |
| [18] | Pereira J M C. A comparative evaluation of NOAA/AVHRR vegetation indexes for burned surface detection and mapping. IEEE Transactions on Geoscience and Remote Sensing, 1999, 37(1): 217-226. |
| [19] | Giglio L, Descloitres J, Justice C O, Kaufman Y J. An enhanced contextual fire detection algorithm for MODIS. Remote Sensing of Environment, 2003, 87(2/3): 273-282. |
| [20] | Dozier J. A method for satellite identification of surface temperature fields of subpixel resolution. Remote Sensing of Environment, 1981, 11: 221-229. |
| [21] | Movaghati S, Samadzadegan F, Azizi A. An agent-based approach for regional forest fire detection using MODIS data. Journal of Applied Sciences, 2009, 9(20): 3672-3681. |
| [22] | 王彩云, 扎西顿珠, 陈涛. EOS/MODIS数据在西藏森林火灾中的应用. 高原山地气象研究, 2010, 30(3): 66-69. |
| [23] | Ruiz J A M, Riano D, Arbelo M, French N H F, Ustin S L, Whiting M L. Burned area mapping time series in Canada (1984-1999) from NOAA-AVHRR LTDR: A comparison with other remote sensing products and fire perimeters. Remote Sensing of Environment, 2012, 117: 407-414. |
| [24] | Giglio L, Loboda T, Roy D P, Quayle B, Justice C O. An active-fire based burned area mapping algorithm for the MODIS sensor. Remote Sensing of Environment, 2009, 113(2): 408-420. |
| [25] | Zhang X Y, Kondragunta S, Quayle B. Estimation of biomass burned areas using multiple-satellite-observed active fires. IEEE Transactions on Geoscience and Remote Sensing, 2011, 49(11): 4469-4482. |
| [26] | Kasischke E S, Hewson J H, Stock B, van der Werf G, Randerson J. The use of ATSR active fire counts for estimating relative patterns of biomass burning-a study from the boreal forest region. Geophysical Research Letters, 2003, 30(18), doi: 10.1029/2003GL017859. |
| [27] | Giglio L, Van der Werf G R, Randerson J T, Collatz G J, Kasibhatla P. Global estimation of burned area using MODIS active fire observations. Atmospheric Chemistry and Physics, 2006, 6(4): 957-974. |
| [28] | Key C H. Ecological and sampling constraints on defining landscape fire severity. Fire Ecology, 2006, 2(2): 34-59. |
| [29] | Roy D P, Jin Y, Lewis P E, Justice C O. Prototyping a golbal algorithm for systematic fire-affected area mapping using MODIS time series data. Remote Sensing of Environment, 2005, 97(2): 137-162. |
| [30] | Fraser R H, Li Z, Cihlar J. Hotspot and NDVI differencing synergy (HANDS): a new technique for burned area mapping over boreal forest. Remote Sensing of Environment, 2000, 74(3): 362-376. |
| [31] | Kucera J, Yasuoka Y, Dye D G. Creating a forest fire database for the Far East Asia using NOAA/AVHRR observation. International Journal of Remote Sensing, 2005, 26(11): 2423-2439. |
| [32] | Cai H Y, Zhang S W, Bu K, Yang J C, Chang L P. Intergrating geographical data and phenological characteristics derived from MODIS data for improving land over mapping. Journal of Geographical Sciences, 2011, 21(4): 705-718. |
| [33] | Chuvieco E, Martín M P, Palacios A. Assessment of different spectral indices in the red-near-infrared spectral domain for burned land discrimination. International Journal of Remote Sensing, 2002, 23(23): 5103-5110. |
| [34] | Chuvieco E, Englefield P, Trishchenko A P, Luo Y. Generation of long time series of burn area maps of the boreal forest from NOAA-AVHRR composite data. Remote Sensing of Environment, 2008, 112(5): 2381-2396. |