 2015, Vol. 35
文章信息
- 李辉东, 关德新, 袁凤辉, 王安志, 吴家兵, 金昌杰
- LI Huidong, GUAN Dexin, YUAN Fenghui, WANG Anzhi, WU Jiabing, JIN Changjie
- BP人工神经网络模拟杨树林冠蒸腾
- Modeling canopy transpiration of young poplar trees (Populus × euramericana cv. N3016) based on Back Propagation Artificial Neural Network
- 生态学报, 2015, 35(12): 4137-4145
- Acta Ecologica Sinica, 2015, 35(12): 4137-4145
- http://dx.doi.org/10.5846/stxb201308262155
-
文章历史
- 收稿日期:2013-08-26
- 网络出版日期:2014-07-02


2. 中国科学院大学, 北京 100049
2. University of Chinese Academy of Sciences, Beijing 100049, China
蒸腾耗水是衡量植被水分利用效率的重要指标[1],也是生态系统能量和水量平衡的重要分量[2]。植被蒸腾的准确估算对探求全球水分循环规律、正确认识陆地生态系统的结构与功能[3, 4, 5]、指导生态系统经营管理以及实现水资源可持续利用等都有重要意义[6]。
获取植物蒸腾资料的最直接方法是进行实际测定,包括称重法[7]、风调室法[8]和液流法[9]等。但植被蒸腾是涉及整个土壤-植被-大气连续体(Soil-Plant-Atmosphere Continum,简称SPAC)的复杂过程,受土壤、植被和大气多个因素的影响,其实际准确测定较为繁琐,同时陆地植被生态系统复杂多样,受人力物力所限,无法在每个生态系统上对其进行长期的实际观测,大规模蒸腾数据的直接获取较为困难。相对于实测法,蒸腾估算法能够利用连续观测的气象、植被和土壤等数据实现蒸腾量的长期估算,方便、快捷,更加容易实现,现已成为评估和预测植被蒸腾的重要途径。
各类蒸腾模型中,基于SPAC 水分传输理论,把植被蒸腾与SPAC其他过程相耦合的过程模型,对蒸腾机理的表达较为完善[10, 11],受到很多学者的关注[12, 13, 14]。但由于该法涉及的物理过程和输入参数较多,且有些参数不易获得或具有较强的地域性特征,使该法在实际应用中受到了一定的局限。传统的微气象方法包括Penman-Monteith(PM)法、Priestley-Taylor(PT)方法、波文比能量平衡法和空气动力学廓线法等,主要针对生态系统的蒸散研究,对植被蒸腾的估算无法直接进行。虽然可以结合土壤蒸发估算,通过蒸散组分分解间接实现[15],但由于涉及蒸散和蒸发两个过程,程序较为繁琐,且不同方法的空间代表性不同,限制了蒸腾的准确估算。结合辐射分解,对传统微气象学方法进行改进也可实现蒸腾的估算。有学者结合比尔定律应用PM公式[16, 17]和PT公式[18]对蒸腾进行估算,也有学者通过Shuttleworth-Wallace(SW)多层冠层理论模型[19]实现了蒸腾估算。但这些方法都涉及净辐射的分解,而受林冠下辐射空间异质性的影响,净辐射分解的准确观测较难,限制了这些方法的估算精度。
20世纪80年代迅速发展起来的人工神经网络(ANN)是一种非线性统计性数据建模工具,常用来对输入与输出间复杂的关系进行建模。它具有独特的分布并行处理、非线性映射和自适应学习能力等优点,为非线性复杂系统过程的模拟和评判提供了一条有效途径[20]。在若干神经网络模型中,BP(Back Propagation)人工神经网络是一种较为成熟的非线性函数逼近方法,实际应用中80%—90%的人工神经网络都是采用BP神经网络或它的变化形式,现已被广泛应用于降水预报[21]、径流预报[22]、蒸散[23]和蒸发[24]模拟等水文气象领域,但应用BP神经网络进行植被蒸腾的模拟研究至今尚未见有报道。开展这方面的研究,是对现有植被蒸腾估算方法的有力补充。
本文利用2008—2010年的液流和气象观测数据,建立适用于杨树林冠蒸腾模拟的BP人工神经网络模型,对其模拟结果进行了检验,并进行了趋势、误差和敏感性分析,以期为植被蒸腾模拟提供新方法和新思路。
1 研究地概况与方法 1.1 研究地概况试验地设在辽宁建平县太平庄镇(41.78°N,119.29°E)。该地区为低山丘陵区,属于北温带半湿润半干旱大陆性季风气候,年平均气温6—8 ℃,年平均降水450 mm,其中6—8月降水占全年的80%以上。土壤主要类型为褐土、草甸土和风沙土,土壤肥力较低,土层较薄。试验点采用杨树-大豆的农林复合经营模式,长宽分别延伸1000和600 m。杨树(Populus×euramericana cv. N3016)种植于2003年,树株行距为3 m × 4 m,2008、2009和2010年3a的平均高度分比别为7、8和9 m,3a的平均胸径分别为106、146和186 mm,3a最大叶面积指数分别为1.2、1.7和2.6。林下大豆最大高度为0.6 m,最大叶面积指数为2.8。
1.2 野外观测 1.2.1 气象要素观测试验点建有14 m高的气象观测塔,大气温湿度传感器(AV-10TH,Avalon Research Corporation,USA)和风速传感器(AV-30WS,Avalon Research Corporation,USA)安装在9 m高度,太阳总辐射传感器(AV-20P,Avalon Research Corporation,USA)安装在12 m高度,土壤层包括3个深度(5,20,50 cm)的土壤湿度传感器(AV-EC5,Avalon Research Corporation,USA)。观测数据采用DT85数据采集器(Pty Ltd,Rowville,Australia)自动记录。
1.2.2 蒸腾观测采用Granier热扩散法[25]观测树木液流,选取生长状况良好的样树6株,在树干西侧距地面40 cm高处安装液流传感器(TDP30,北京鑫源时杰科技发展有限公司)。传感器由两根长30 mm、直径2 mm、相距5 cm的探针组成。两探针间的温差用DT85数据采集器(Pty Ltd,Rowville,Australia)自动记录,频率为0.5 Hz,每10 min进行平均并储存数据。
液流密度根据Granier[25]的经验公式求得:

式中,Js为树干瞬时液流密度(g m-2 s-1);△Tm为探针测定的昼夜最大温差(℃);△T为探针测定的瞬时温差(℃)。
液流密度结合样树的边材面积得到林冠蒸腾量(Tc,mm/s):

式中,ρ为水的密度(103 kg/m3);A为样树的边材面积(m2)。
1.2.3 边材面积观测边材面积利用生长锥取样测定,在观测液流的树木附近取5株近似的树木,于树干的TDP探头安装高度,钻取直径5 mm、深度为直径1/2的样品,根据样品边材与心材的边界确定边材的厚度并计算边材面积,观测频率每10天1次。考虑到杨树的快速生长能力,利用观测结果建立边材面积的季节变化方程[9],对每日的边材面积进行插补。
1.2.4 叶面积指数观测选择相邻2行杨树,以每行树干基部连线为样线,并在2条线之间再设3条样线,组成5条等间距(1 m)平行样线,选择阴天或天空散射均匀的清晨(或傍晚),在每条样线上等间距(0.6 m)设10个样点(观测高度在大豆冠层之上),在塔上9 m高处设对照点,用冠层分析仪(Li-2000,LiCor Inc.,USA)循环观测,计算林分的平均叶面积指数,每次观测重复3次取平均值,观测频率为每周1次。观测结果显示叶面积指数的季节动态表现为5月快速生长,6月到8月缓慢生长增加,9月到10月下降。考虑到叶面积指数显著的季节变化,利用实测数据分别建立3个生长阶段叶面积指数变化曲线的回归方程[9],对每日的叶面积指数进行插补。
1.3 BP人工神经网络原理和方法 1.3.1 BP人工神经网络原理人工神经网络是对某种算法或者函数的逼近,由多层神经元结构(图 1)组成。每一层神经元包含输入x(原始输入或前一层神经元的输出)和输出y,同时每个神经元都包含一个阈值(θ)。输入通过权值(W)进行线性加权运算,得到输入的总效果,即净输入(net):
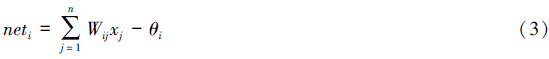
当net超过θ时,神经元处于激发状态,当net小于θ时,神经元处于抑制状态。net通过激活函数(f)变换获得神经元输出y:

激活函数通常为S型函数,常采用可导的sigmoid函数:


|
| 图1 人工神经元模型 Fig.1 Artificial neuron model |
BP人工神经网络是基于误差反向传播算法、由非线性变化单元组成的前馈网络,可以看作是一个从输入到输出的高度非线性映射。它由输入层、输出层和一个或若干个隐含层构成,每一层包含若干神经元,层与层间的神经元通过权值及阈值互连,每层神经元的状态只影响下一层神经元,同层神经元之间没有联系。BP人工神经网络学习算法的实质是求解误差函数的最小值,利用它可以实现多层前馈神经网络权值的调节。学习过程由“信息正向传播”和“误差逆向传播”两个过程组成。在信息正向传播过程中,输入信号从输入层经隐含层传向输出层,如果在输出层不能得到期望输出时,则转入误差逆向传播过程。误差沿原来的连接通路返回,逐层传递并修正各层连接权值和阈值。由“信息正向传播”和“误差逆向传播”的反复交替进行网络的“记忆训练”过程。当全部样本的输出误差小于设定的收敛误差时,网络训练结束。人工神经网络通过对神经元连接权值和阀值的训练和学习,确定最优的权值和阀值大小,并将输入和输出之间的映射规律存储其中,从而对实际问题进行模拟。
1.3.2 误差函数和贡献率计算(1)误差函数
为了对林冠蒸腾的模拟结果进行检验,本文采用绝对误差AE、均方误差MSE、决定系数R2、相对误差绝对值平均MARE和纳什效率系数Nes对BP神经网络的模拟精度进行评价。其中,Nes用来衡量模拟值与观测值之间的拟合度,该值越接近于1,则表明模拟值越接近观测值,模型效率越高,适用性越好。上述误差函数参照文献[26]进行计算。
(2)贡献率
采用Garson[27]提出的方法,利用连接权值对BP神经网络各输入变量对输出变量的贡献率进行计算,计算公式为:
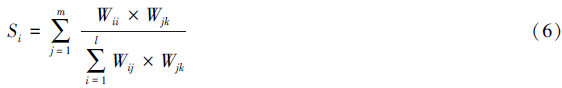
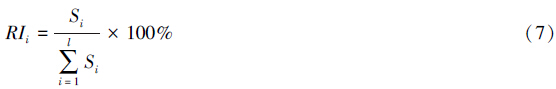
式中,Si和RIi分别表示第i个输入对第k个输出的绝对贡献和相对贡献大小;l、m、n分别表示输入层、隐含层和输出层的神经元个数;i、j、k则分别代表输入层、隐含层和输出层神经元序号。
1.3.3 BP人工神经网络建模人工神经网络建模一般包括训练样本的选择、网络结构和参数的确定、网络训练等过程。
(1)训练样本的选择
应用BP人工神经网络建模进行预测时,需先要确定训练样本。训练样本必须满足两个条件:一是样本足够多,能反映事物的复杂程度;二是样本具有代表性,尽可能包含能代表各类特征的模式。植物蒸腾主要受环境要素(太阳辐射、空气温湿度、风速和土壤湿度)和植被要素(叶面积指数和冠层导度)的共同影响。但之前的研究显示由于研究区风速较小(平均1.25 m/s),同时杨树能利用深层土壤水分,土壤水分胁迫影响较弱,因此风速和地表土壤湿度对蒸腾的影响均不显著[9]。同时根据Jarvis冠层导度模型[28]可知冠层导度受辐射、大气温湿度、土壤湿度和叶面积指数的影响,它本身不是独立变量,可以表达为上述影响因素的函数,由于研究区水分胁迫对导度的影响也不显著[29],因此辐射、大气温湿度和叶面积指数的某种非线性组合可以解释冠层导度的大小,冠层导度也不作为模型的输入。综合考虑以上各方面因素,本文选择太阳辐射(Rg)、气温(Ta)、饱和差(VPD)和叶面积指数(LAI)4个因子作为模型的输入变量,输出变量则采用国际通用的液流法实测的蒸腾数据。2008和2010年生长季(6—9月)观测资料为训练样本(n=227),2009年观测资料为检验样本(n=146)。在网络学习过程中,为便于训练,更好地反映各因素之间的相互关系,要对样本数据进行归一化处理:
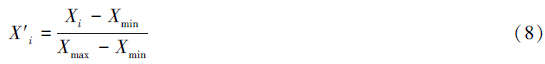
式中,Xi和X′i别代表归一化前后的第i个向量元素,Xmax和Xmin分别代表向量的最大和最小值。
(2)网络结构和参数的确定
BP神经网络结构主要包括网络的层数以及输入、输出和隐含层的神经元个数。BP神经网络具有很强的非线性映射能力,Hecht-Nielsen[30]证明Kolrnogorov定理表明一个3层的BP神经网络能够实现对任意非线性函数进行逼近,因此本文选择采用3层神经网络,即输入层、输出层和隐含层各一个。由于模型包括4个输入和1个输出,因此输入层和输出层的神经元个数分别为4和1。隐含层节点数目取决于输入层和输出层神经元个数以及训练样本中所蕴含规律的复杂程度等多种因素,关于隐含层神经元个数的选择还没有确切的理论方法,往往需要根据设计者的经验,通过多次试验来确定。本文参照经验公式[31]设置初始神经元个数范围为3—12:

式中,a为1—10之间的常数。
采用试错法来确定最佳的隐含层神经元个数。表 1给出了不同隐含层神经元个数下模型训练的表现,包括训练结果的均方误差MSE和决定系数R2。可以看出MSE和R2一开始随着神经元个数的增加而分别增大和减小,但当神经元个数超过9以后,随着其继续增加,MSE和R2表现出相反的趋势。这说明隐含层神经元个数过少时模型会出现拟合不足,容错性差,识别新样本的能力低等问题;隐含层神经元个数过多则会导致模型过度拟合,存储训练样本中的非规律性内容(如干扰、噪声),降低模型的泛化能力,导致模型预测能力下降,这与前人的研究结果一致[32]。因此本文将隐含层神经元个数选为9,BP神经网络的拓扑结构最终确定为4 ∶ 9 ∶ 1。
| 评价指标 Criteria | 隐含层节点数Number of neurons in the hidden layer | |||||||||
| 3 | 4 | 5 | 6 | 7 | 8 | 9 | 10 | 11 | 12 | |
| MSE: 均方误差Mean Square Error; R2: 决定系数Coefficient of Determination | ||||||||||
| MSE | 0.0093 | 0.0072 | 0.0073 | 0.0057 | 0.0054 | 0.0036 | 0.0023 | 0.0031 | 0.0040 | 0.0041 |
| R2 | 0.6724 | 0.7569 | 0.7744 | 0.7921 | 0.8281 | 0.8649 | 0.8836 | 0.8464 | 0.8464 | 0.8464 |
(3) 网络训练
本研究在MATLAB R2008a环境下,利用2008和2010年生长季观测资料为训练样本,调用人工神经网络工具箱中的函数进行网络训练,输入层与隐含层之间的传递函数设为正切S型函数tansig,隐含层与输出层之间的传递函数设定为对数S型函数logsig。同时为了避免传统BP算法存在的收敛速度慢、学习精度低等缺点,训练函数采用Levenberg-Marquard (LM)算法。动态因子设为0.01,最大失败次数设为20,性能函数采用MSE。网络经过49次训练,最大失败次数达到20,收敛误差MSE为0.0023。训练结束后建立了如图 2所示的3层BP神经网络蒸腾模型。

|
| 图2 3层BP人工神经神经网络蒸腾模型结构图 Fig.2 Structure of a three-layer back propagation artificial neural network transpiration model |
为了检验BP人工神经网络模型的模拟能力,利用2009年生长季观测资料对研究区的林冠蒸腾进行了模拟,并与液流观测的蒸腾数据进行了比较。结果发现,尽管存在局部的高估或低估现象,但总体上模拟的林冠蒸腾季节变化趋势与实测值基本相同(图 3),观测和模拟的季节总蒸腾值十分接近,分别为173.0和173.3 mm。回归分析(图 4)显示二者间的回归斜率为0.99,R2为0.85,模型对蒸腾的拟合度较高。误差分析结果表明,模拟的AE最大值和最小值分为0.28和0.003 mm/d,其平均值仅为0.11 mm/d,MARE为9.5%,Nse则较高,为0.83,这说明模型模拟的精度和适用性都较高。但应该指出的是模型模拟的MSE为0.0161,虽然较小,但大于模型训练时的MSE值,说明BP神经网络模型仍然存在一定的过度拟合问题[26]。

|
| 图3 BP人工神经网络模拟和液流法测定的蒸腾季节变化的比较 Fig.3 Seasonal variation comparison between modeled transpiration by BP ANN model and measured transpiration by sap flow |

|
| 图4 BP人工神经网络模拟结果和液流法测定的林冠蒸腾的回归分析 Fig.4 Regression analysis between modeled transpiration by BP ANN model and measured transpiration by sap flow |
人工神经网络不能解释模拟的物理过程,因此大多时候被认为是一种黑箱模型。然而,由于用于建模的数据包含所模拟物理过程的重要信息,人工神经网络可以通过输入变量对输出变量的敏感性分析来对其物理过程进行解释。由于输入变量对于输出变量的相对贡献依赖于连接权重的量级和正负,因此可以通过训练好的神经网络的连接权值来获取。当连接输入层-隐含层和隐含层-输出层的权值的正负相同时,认为输入变量对于输出变量有正的作用。相反,当两者正负号相反时,则有负的影响。利用连接权值评估输入变量对于输出变量敏感性的方法可以解释神经网络能通过有限的模型输入来进行复杂的植被蒸腾模拟的原因。
从表 2中可以看出,辐射和叶面积指数两项对蒸腾的贡献最大,相对贡献率都超过30%,其中总辐射对林冠蒸腾的贡献最大,相对贡献率为33.46%,这主要是因为辐射项是植被蒸腾的最终能量来源,其次为叶面积指数,相对贡献率为30.19%,原因是叶片是植物进行蒸腾的主要器官,其面积大小决定了林冠蒸腾的量级大小。VPD对蒸腾的相对贡献率大于气温,为19.77%,这是因为VPD是植被蒸腾的动力项,同时VPD包含了部分气温信息。气温对蒸腾的贡献最小,相对贡献率为16.58%,因为温度与辐射(r=0.43)和VPD(r=0.37)存在相关性,气温对蒸腾的部分贡献包含在了辐射和VPD对蒸腾的贡献之中。
比较输入变量对蒸腾的相对贡献以及蒸腾与输入变量的相关性发现,前者的大小顺序和后者的一致,都是Rg>LAI>VPD>Ta。这种一致性表明,尽管人工神经网络无法反映林冠蒸腾的物理过程,但由于模型输入数据包含了林冠蒸腾的物理过程信息,且人工神网络能对输入数据和输出数据间的映射关系进行很好的表达,因此该模型可以对林冠蒸腾进行较好的模拟。
| 指标 Criteria | 气温 Air temperature | 饱和差 Vapor pressure deficit | 叶面积指数 Leaf area index | 总辐射 Global radiation |
| **表示在0.01水平上显著相关 | ||||
| 相对贡献Relative contribution/% | 16.58 | 19.77 | 30.19 | 33.46 |
| 相关系数Correlation coefficient | 0.51** | 0.54** | 0.56** | 0.64** |
为了准确估算林冠蒸腾大小,本文利用2008和2010年的气温、饱和差、总辐射和叶面积指数作为模型输入,液流法观测的蒸腾速率作为模型输出,建立了用于杨树林冠蒸腾估算的BP人工神经网络模型,利用2009年的观测数据对模型的模拟能力进行检验。结果表明,该模型可以很好的模拟蒸腾大小和季节变化,应用连接权值分析了输入变量对输出变量的相对贡献,发现输入变量对林冠蒸腾的相对贡献大小顺序为Rg>LAI>VPD>Ta,与林冠蒸腾-输入变量间的相关性大小顺序相同,从而解释了神经网络能通过有限的模型输入来进行复杂的植被蒸腾模拟的原因。
BP人工神经网络可以很好的模拟植被蒸腾,且包含一定的物理信息,是对传统植被蒸腾估算方法的有力补充。在BP神经网络的实际应用中,输入变量的选择至关重要,需要根据研究区的实际情况来确定。本文参考了研究区之前的研究结果,选择气温、饱和差、总辐射和叶面积指数4个变量作为模型输入。但植被蒸腾是SPAC的重要物理过程,涉及大气、植被和土壤的多个物理变量[33, 34],在其他的研究区域,除了上述4个变量外,大气中的风速[35]和表层土壤温湿度[36]都有可能对植被蒸腾模拟产生重要影响,如浅根系植被蒸腾对表层土壤水分的依赖性则较强,在模型输入选择时需要加以考虑[37]。同时为了进一步提高BP神经网络模拟的准确性,在观测数据较为充足的研究区域,稳妥的方法是增加训练样本个数。使用的数据越多越全面,则其中所隐含物理过程规律就越强,神经网络训练的函数关系就越具有普遍性,其模拟也就更准确[38]。但科研实践中观测样本数和观测项目都具有很大的局限性,会给神经网络模型的建立带来较大困难,因此在同一区域相同的样本条件下不同的输入变量组合对于模型表现的影响以及如何利用最少的变量来进行植被蒸腾的模拟都是下一步研究的重点。
近年来,BP人工神经网络理论的研究与应用已引起普遍关注,实践也证明了其解决非线性问题的明显优势。但是BP神经网络自身仍然存在收敛速度慢、容易陷人局部极小和结构无法充分优化等缺陷[39]。本文建立的BP神经网络虽然可以很好的模拟树木蒸腾,但仍然存在过度拟合等问题有待解决。如何改进BP神经网络的训练算法,优化网络结构,提高网络的泛化能力,需更多的研究解决[40]。
| [1] | Kelliher F M, Köstner B M M, Hollinger D Y, Byers J E, McSeveny T M, Meserth R, Weir P L, Schulze E D. Evaporation, xylem sap flow, and tree transpiration in a New Zealand broad-leaved forest. Agricultural and Forest Meteorology, 1992, 62(1/2): 53-73. |
| [2] | Granier A, Biron P, Lemoine D. Water balance, transpiration and canopy conductance in two beech stands. Agricultural and Forest Meteorology, 2000, 100(4): 291-308. |
| [3] | Koster R D, Milly P C D. The interplay between transpiration and runoff formulations in land surface schemes used with atmospheric models. Journal of Climate, 1997, 10(7): 1578-1591. |
| [4] | Brown S. A comparison of the structure, primary productivity, and transpiration of cypress ecosystems in Florida. Ecological Monographs, 1981, 51(4): 403-427. |
| [5] | Simpson R L. Characteristics of turbulent boundary layers at low Reynolds numbers with and without transpiration. Journal of Fluid Mechanics, 1970, 42(4): 769-802. |
| [6] | O'Grady A P, Eamus D, Hutley L B. Transpiration increases during the dry season: patterns of tree water use in eucalypt open-forests of northern Australia. Tree Physiology, 1999, 19(9): 591-597. |
| [7] | Wullschleger S D, Meinzer F, Vertessy R. A review of whole-plant water use studies in tree. Tree Physiology, 1998, 18(8/9): 499-512. |
| [8] | Greenwood E A N, Beresford J D. Evaporation from vegetation in landscapes developing secondary salinity using the ventilated-chamber technique: I. Comparative transpiration from juvenile Eucalyptus above saline groundwater seeps. Journal of Hydrology, 1979, 42(3/4): 369-382. |
| [9] | Guan D X, Zhang X J, Yuan F H, Chen N N, Wang A Z, Wu J B, Jin C J. The relationship between sap flow of intercropped young poplar trees (Populus× euramericana cv. N3016) and environmental factors in a semiarid region of northeastern China. Hydrological Processes, 2012, 26(19): 2925-2937. |
| [10] | Federer C A. A soil-plant-atmosphere model for transpiration and availability of soil water. Water Resources Research, 1979, 15(3): 555-562. |
| [11] | Federer C A. A soil-plant-atmosphere model for transpiration and availability of soil water. Water Resources Research, 1979, 15(3): 555-562. |
| [12] | Leuning R. A critical appraisal of a combined stomatal-photosynthesis model for C3 plants. Plant, Cell & Environment, 1995, 18(4): 339-355. |
| [13] | Williams M, Rastetter E B, Fernandes D N, Goulden M L, Wofsy S C, Shaver G R, Melillo J M, Munger J W, Fan S M, Nadelhoffer K J. Modelling the soil-plant-atmosphere continuum in a Quercus-Acer stand at Harvard Forest: the regulation of stomatal conductance by light, nitrogen and soil/plant hydraulic properties. Plant, Cell & Environment, 1996, 19(8): 911-927. |
| [14] | Yang Y T, Shang S H, Guan H D. Development of a soil-plant-atmosphere continuum model (HDS-SPAC) based on hybrid dual-source approach and its verification in wheat field. Science China Technological Sciences, 2012, 55(10): 2671-2685. |
| [15] | Lawrence D M, Thornton P, Oleson K W, Bonan G B. The partitioning of evapotranspiration into transpiration, soil evaporation, and canopy evaporation in a GCM: Impacts on land-atmosphere interaction. Journal of Hydrometeorology, 2007, 8(4): 862-880. |
| [16] | Whitley R, Medlyn B, Zeppel M, Macinnis-Ng C, Eamus D. Comparing the Penman-Monteith equation and a modified Jarvis-Stewart model with an artificial neural network to estimate stand-scale transpiration and canopy conductance. Journal of Hydrology, 2009, 373(1/2): 256-266. |
| [17] | Morille B, Migeon C, Bournet P E. Is the Penman-Monteith model adapted to predict crop transpiration under greenhouse conditions? Application to a New Guinea Impatiens crop. Scientia Horticulturae, 2013, 152: 80-91. |
| [18] | Pereira A R, Green S R, Nova N A V. Sap flow, leaf area, net radiation and the Priestley-Taylor formula for irrigated orchards and isolated trees. Agricultural Water Management, 2007, 92(1/2): 48-52. |
| [19] | Shuttleworth W J, Wallace J S. Evaporation from sparse crops-an energy combination theory. Quarterly Journal of the Royal Meteorological Society, 1985, 111(469): 839-855. |
| [20] | Deswal S, Pal M. Artificial neural network based modeling of evaporation losses in reservoirs. International Journal of Mathematical, Physical and Engineering Sciences, 2008, 2(4): 177-181. |
| [21] | Valverde Ramírez M C, de Campos Velho H F, Ferreira N J. Artificial neural network technique for rainfall forecasting applied to the Sao Paulo region. Journal of Hydrology, 2005, 301(1/4): 146-162. |
| [22] | Hsu K L, Gupta H V, Sorooshian S. Artificial neural network modeling of the rainfall-runoff process. Water Resources Research, 1995, 31(10): 2517-2530. |
| [23] | Dai X Q, Shi H B, Li, Y S, Zhu O Y, Huo Z L. Artificial neural network models for estimating regional reference evapotranspiration based on climate factors. Hydrological Processes, 2009, 23(3): 442-450. |
| [24] | Lippmann R. An introduction to computing with neural nets. IEEE ASSP Magazine, 1987, 4(2): 4-22. |
| [25] | Granier A. Evaluation of transpiration in a Douglas-fir stand by means of sap flow measurements. Tree Physiology, 1987, 3(4): 309-320. |
| [26] | Jain S K, Nayak P C, Sudheer K P. Models for estimating evapotranspiration using artificial neural networks, and their physical interpretation. Hydrological Processes, 2008, 22(13): 2225-2234. |
| [27] | Garson G D. Interpreting neural-network connection weights. AI Expert, 1991, 6(4): 46-51. |
| [28] | Jarvis P G. The interpretation of the variations in leaf water potential and stomatal conductance found in canopies in the field. Philosophical Transactions of the Royal Society of London B: Biological Sciences, 1976, 273(927): 593-610. |
| [29] | 李峥, 牛丽华, 袁凤辉, 关德新, 王安志, 金昌杰, 吴家兵. 辽西农林复合系统中杨树冠层导度特征. 应用生态学报, 2012, 23(11): 2975-2982. |
| [30] | Hecht-Nielsen R. Kolmogorov's mapping neural network existence theorem // Proceedings of the International Conference on Neural Networks, New York: IEEE Press, 1987. |
| [31] | Mirchandani G, Cao W. On hidden nodes for neural nets. IEEE Transactions on Circuits and Systems, 1989, 36(5): 661-664. |
| [32] | Coulibaly P, Anctil F, Aravena R, Bobée B. Artificial neural network modeling of water table depth fluctuations. Water Resources Research, 2001, 37(4): 885-896. |
| [33] | Collatz G J, Ball J T, Grivet C, Berry J A. Physiological and environmental regulation of stomatal conductance, photosynthesis and transpiration: a model that includes a laminar boundary layer. Agricultural and Forest Meteorology, 1991, 54(2/4): 107-136. |
| [34] | Meinzer F C, Goldstein G, Jackson P, Holbrook N M, Gutiérrez M V, Cavelier J. Environmental and physiological regulation of transpiration in tropical forest gap species: the influence of boundary layer and hydraulic properties. Oecologia, 1995, 101(4): 514-522. |
| [35] | Oren R, Pataki D E. Transpiration in response to variation in microclimate and soil moisture in southeastern deciduous forests. Oecologia, 2001, 127(4): 549-559. |
| [36] | Bréda N, Granier A, Aussenac G. Effects of thinning on soil and tree water relations, transpiration and growth in an oak forest (Quercus petraea (Matt.) Liebl.). Tree physiology, 1995, 15(5): 295-306. |
| [37] | Jipp P H, Nepstad D C, Cassel D K, de Carvalho C R. Deep soil moisture storage and transpiration in forests and pastures of seasonally-dry Amazonia. Climatic Change, 1998, 39(2/3): 395-412. |
| [38] | 蒋林, 陈涛, 屈梁生. 训练样本质量对人工神经网络性能的影响. 中国机械工程, 1997, 8(2): 50-53. |
| [39] | 鲁娟娟, 陈红. BP神经网络的研究进展. 控制工程, 2006, 13(5): 449-451, 456. |
| [40] | 苏高利, 邓芳萍. 论基于MATLAB语言的BP神经网络的改进算法. 科技通报, 2003, 19(2): 130-135. |