 2014, Vol. 34
文章信息
- 夏鹏亮, 王瑞, 王昌军, 林国平, 刘映红
- XIA Pengliang, WANG Rui, WANG Changjun, LIN Guoping, LIU Yinghong
- 恩施烟区无翅桃蚜在烤烟田空间动态的地统计学分析
- Geostatistical analysison spatial dynamics of the apterous Myzus percicae in flue-cured tobacco fields of Enshi tobacco area, China
- 生态学报, 2014, 36(5): 1198-1204
- Acta Ecologica Sinica, 2014, 36(5): 1198-1204
- http://dx.doi.org/10.5846/stxb201303270535
-
文章历史
- 收稿日期:2013-3-27
- 修订日期:2013-10-28


2. 湖北省烟草公司恩施州公司, 恩施 445000;
3. 湖北省烟草科学研究所, 武汉 430030
2. Enshi Prefecture Company of Hubei Provincial Tobacco Corporation, Enshi 445000, China;
3. Tobacco Scientific Institute of Hubei Province, Wuhan 430030, China
桃蚜[Myzus percicae(Sulzer)]属于半翅目,蚜科,是世界性重要害虫之一。桃蚜以口针吸食寄主植物幼嫩组织汁液,并排泄蜜露,诱发煤污病,可传播多种植物病毒,给农业生产造成严重损失[1]。桃蚜在春季迁入烟田,在定殖与迁移过程中,形成复杂的空间结构,研究其种群消长规律、预测未来发展趋势,对指导桃蚜和烟草花叶病毒病的有效防治具有重要意义[2]。不同地区桃蚜发生规律存在较大差异,李厥鲁将我国桃蚜种群消长型划分为单峰型和双峰型两种类型[3]。黄顶成等认为桃蚜种群时间动态可分为发展、剧增、大发生和衰退4个阶段[4]。邓建飞等利用经典统计学方法研究表明,各密度下烟蚜分布型为聚集分布,聚集度对密度具有依赖性[5, 6, 7]。经典生物统计学的研究对象必须是纯随机变量,前提是假设不同位置的样本相互独立。但是,存在于空间中不同位置上的空间现象是相互影响的,具有空间相关性。地统计学承认空间相关性的存在,以半方差函数为主要工具揭示种群空间分布格局,为区域化变量的空间分布分析提供新的理论和方法[8, 9, 10, 11, 12]。闫香慧等将平面坐标分为东西方向和南北方向进行白背飞虱空间格局的地统计学分析,对东西方向和南北方向上的分布特征进行了分别阐述,证明了昆虫空间分布不同方向的差异性[8, 9, 13, 14, 15, 16]。烟区和烟田之间的迁移以有翅蚜为主,田块内部的种群动态和发生规律,无翅桃蚜发挥着更加重要的作用。受寄主生理生化特性影响,不同烟叶生育期,桃蚜空间结构的差异有待进一步验证。目前,在昆虫学研究领域尚未发现从空间四方向同时分析昆虫空间分布格局的报道。本文通过地统计学方法,首次将平面坐标分为4个方向,研究无翅桃蚜在烟叶不同生育期的空间结构和发生动态,以期深入了解其生物特性和发生规律,为桃蚜的有效控制提供理论依据。
1 材料与方法 1.1 调查方法调查田设于湖北省恩施州咸丰县忠堡镇马关屯村(N 29°39′03″,E 109°14′12″),海拔779m,烟叶品种为烤烟型云烟87,烟叶生长全过程,不施用任何农药。施肥、灌溉等按常规管理,调查田四周均为同品种烟叶[8, 9]。在调查田中央,选择长势整齐的烟株100株,10行×10列作为调查点,行距1.1m,株距0.6m。在烟叶苗期(5月10日)、团棵期(6月10日)、旺长期(7月10日)、成熟期(8月10日)分别调查1次,记录每株烟上无翅桃蚜总量及烟株所在的位置。
1.2 半变异函数 1.2.1 方向选择以西—东方向为0°方向,分别按逆时针旋转45°、90°、135°,共设置4个方向。从半变异函数公式(式1)可以看出,同一直线上,半变异函数曲线和模型是一致的。
1.2.2 半变异函数分析半变异函数是指分割距离为h的两位点x和x+h的调查值Z(x)和Z(x+h)之间的变异,用其增量[Z(x)-Z(x+h)]平方的数学期望表示。其计算公式为:
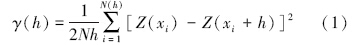
式中,γ(h)为半方差函数,N(h)为间隔距离为h的样本对的数目;h是一个有方向特性和长度特性的向量,从方程式可以看出h的正负不影响γ(h)的大小,即同一直线上半变异函数分析结果是一致的;Z(xi)指在点xi处的调查值;而xi指样本在二维空间中存在的位置参数,是向量点[17, 18, 19, 20, 21]。半方差函数中有3个最重要的参数:块金常数( nugget),基台值( sill)和变程( range),块金常数是指变异函数曲线被延伸到间隔距离为零时的截距,它反映了区域化变量内部随机性的可能程度;基台值是指达到平衡时的变异函数值,它反映了变量变化幅度的大小;变程是当变异函数的值达到平衡时的间隔距离,它反映了区域化变量影响范围的大小。C/(C0+C) 的大小判定系统内变量的空间相关程度,小于0.25的其空间相关性较弱,结构性变异较小,随机性变异较大;介于0.25—0.75之间,有中等程度的空间相关性;大于0.75则具有较强的空间相关性,其结构性变异较大,随机性变异也较小[22, 23, 24]。
1.2.3 半方差函数理论模型的拟合常见的模型有:常数模型、球形模型、指数模型、高斯模型等,地统计学中用来拟合实际变异曲线图的模型还有:球形+球形套合模型、球形+指数套合模型和线性有基台模型等。本文用到的主要函数曲线为线性有基台曲线模型、球形-指数套合模型[25, 26]。
1.3 空间数据插值Kriging插值是一种用来估计观测样点间内插值的地统计学方法,在已知某变量的半变异函数模拟模型条件下,可以利用样点观测值对研究区域上未取样点的区域化变量值进行最小误差估值,任意一点的估计值是通过该点影响范围内的n个有效样本值Z(xi)的线性组合得到,即:

式中,λi 是与样点观察值Z(xi) 有关的加权系数,用来表示各样点值Z(xi)对估计值Zv*的贡献。
本文基础数据统计通过EXCEL(2003)完成,半变异函数分析和克里格插值模拟通过DPS 7.05软件完成。
2 结果与分析 2.1 无翅桃蚜在烟叶不同生育期空间分布数据的统计特征烟叶不同生育期无翅桃蚜田间分布的统计特征见表 1。从表 1可以看出,无翅桃蚜在烟叶苗期密度最小为(5.59±4.07)头/株,烟叶旺长期虫口密度最大为(14.5±9.6)头/株;烟叶不同生育期虫口密度最小值始终为0;虫口密度最大值与平均值的变化趋势完全一致;烟叶不同生育期变异系数(0.6147—0.7281)均较大,表明其空间分布的不均匀性,并随密度的增大而减小,表明种群密度的增大一定程度上提高了种群结构的稳定性;种群密度分布偏度均为右偏(偏度>0),而且偏度越大,峰度也越大。烟叶苗期种群分布曲线峰度明显大于其他时期,表现出更高的聚集性。
|
调查时间
Survey time | 平均值/(头/株)
Mean | 标准差
SD | 最小值
Minimum | 最大值
Maximum | 变异系数
CV | 峰度
Skewness | 偏度
Skewness |
| 苗期 Seedling stage | 5.59 | 4.07 | 0 | 21 | 0.7281 | 1.7652 | 0.9267 |
| 团棵期Rosette stage | 14.5 | 9.6 | 0 | 40 | 0.6621 | -0.3902 | 0.5127 |
| 旺长期Rapid-growth stage | 29.68 | 18.29 | 0 | 78 | 0.6162 | -0.1873 | 0.716 |
| 成熟期 Maturity stage | 24.63 | 15.14 | 0 | 59 | 0.6147 | -0.6585 | 0.5111 |
经过拟合筛选,苗期135°方向和团棵期45°方向为随机模型,苗期0°和45°方向,选择线性有基台模型,其他各时期方向均选择球形-指数套合模型,判断球形+指数套合模型是无翅桃蚜田间分布的主要模型,属于聚集型分布的范畴。半变异函数曲线参数见表 2。
|
调查时间
Survey time | 方向/(°)
Direction | 模型
Model | 块金值
Nugget C0 | 基台值
Still (C0+C) | 随机程度
Random degree (C0/ (C0+C)) | 变程/m
Range a | 决定系数
Model R2 | 分布类型
Pattern |
| 苗期 | 0 | 线性有基台 | 14.2426 | 19.8194 | 0.7186 | 3.24 | 0.9296 | 聚集 |
| Seedling stage | 45 | 线性有基台 | 16.5076 | 24.9373 | 0.6620 | 4.18 | 0.8204 | 聚集 |
| 90 | 球形+指数套合 | 9.2913 | 48.7749 | 0.1905 | 6.03 | 0.8135 | 聚集 | |
| 135 | 随机 | - | - | - | - | - | 随机 | |
| 团棵期 | 0 | 球形+指数套合 | 18.9072 | 309.9212 | 0.0610 | 2.6286 | 0.9067 | 聚集 |
| Rosette stage | 45 | 随机 | - | - | - | - | - | 随机 |
| 90 | 球形+指数套合 | 62.1608 | 1505.1971 | 0.0413 | 10.0547 | 0.9225 | 聚集 | |
| 135 | 球形+指数套合 | 46.4982 | 438.8144 | 0.1060 | 4.3194 | 0.7881 | 聚集 | |
| 旺长期 | 0 | 球形+指数套合 | 590.3683 | 50245.4675 | 0.1175 | 7.3896 | 0.9647 | 聚集 |
| Rapid-growth | 45 | 球形+指数套合 | 79.0901 | 1832.616 | 0.0432 | 6.2867 | 0.9209 | 聚集 |
| stage | 90 | 球形+指数套合 | 46.2484 | 685.6663 | 0.0675 | 4.3380 | 0.8034 | 聚集 |
| 135 | 球形+指数套合 | 136.1009 | 3680.512 | 0.0370 | 7.4980 | 0.9196 | 聚集 | |
| 成熟期 | 0 | 球形+指数套合 | 247.9018 | 21410.6176 | 0.0116 | 6.8754 | 0.9944 | 聚集 |
| Maturity stage | 45 | 球形+指数套合 | 38.2408 | 2024.7399 | 0.0189 | 7.1639 | 0.9743 | 聚集 |
| 90 | 球形+指数套合 | 26.7671 | 165.265 | 0.1620 | 4.1522 | 0.9473 | 聚集 | |
| 135 | 球形+指数套合 | 19.1087 | 1398.355 | 0.0137 | 5.8314 | 0.8759 | 聚集 |
从表 2可以看出,不同时间不同方向的参数值有着自我特性,总体趋势是块金值(4个时间的平均值分别为:13.4771,42.5221,212.9519和83.0046)、基台值(4个时间的平均值分别为:31.1772,751.3109,16111.0655和6249.7443)和变程(4个时间的平均值分别为:4.4833,5.6676,6.3781和6.0057)均随田间虫口密度的增大而增大。苗期的随机程度为0.1905—0.7186,表现较强的随机性,而团棵期、旺长期、成熟期分别为:0.0413—0.1060,0.0370—0.1175和0.0116—0.1620,其随机性均小于0.25,表明由随机性引起的空间变异极小,也即由空间相关性引起的空间变异极大。决定系数均大于0.75,说明整体拟合效果良好[8, 9, 10, 11]。
2.3 无翅桃蚜在烟叶不同生育期空间分布模拟烟叶不同生育期无翅桃蚜田间分布特征模拟结果见图 1,从图 1可以看出,在烟叶苗期桃蚜主要集中在北部中央,团棵期时位置发生较大迁移,而且分布面积扩大。而团棵期到旺长期再到成熟期,空间结构变化较小,相对稳定[3, 8]。

|
| 图1 烟叶不同生育期无翅桃蚜插值分布图 Fig. 1 Kriging maps of spatial pattern of apterous M. percica at different stages of tobacco |
烟叶不同生育期无翅桃蚜田间分布的相关性见表 3,从表 3可以看出,烟叶苗期与团棵期,无翅桃蚜空间分布相关性不显著;团棵期与旺长期,相关性显著;旺长期与成熟期,相关性极显著;表现出空间相关性逐渐增强的趋势。
| 相关系数Correlation coefficients | |||
| 苗期Seedling stage | 团棵期Rosette stage | 旺长期Maturity stage | |
| *P<0.05,**P<0.01,N=100 | |||
| 团棵期 Rosette stage | -0.1900 | ||
| 旺长期 Rapid-growth stage | -0.1800 | 0.20* | |
| 成熟期 Maturity stage | -0.21* | 0.27* * | 0.82* * |
在湖北恩施地区,无翅桃蚜在烟叶苗期密度最小,旺长期密度最大,体现了一般昆虫发生的普遍规律,这与本地区烟叶技术人员长期观察结果是一致的。田间观察还发现,有翅桃蚜的田间增长曲线为双峰型,烟叶苗期和成熟期分别出现发生高峰,其详细分布特征,需要进一步研究探讨。虫口密度最大值与平均值的变化趋势完全一致,表明同一田块桃蚜密度随时间变化的统一性[8, 9, 18]。烟叶不同生育期变异系数(0.6147—0.7281)均较大,说明桃蚜在田间分布的不均匀性,变异系数并随密度的增大而减小,符合统计学的一般规律。烟叶苗期峰度明显大于其他时期,表现出更高的聚集度,间接表现为半变异函数块金值大,随机程度高。田间观察结果显示,烟叶苗期无翅桃蚜集中分布于少数叶片上,并随时间推移逐步扩散。早发现,早预防,消灭苗期少量聚集蚜虫,减少苗期虫口基数,有利于桃蚜种群数量的控制。
随着烟叶生育期的增长,无翅桃蚜的空间结构逐渐稳定和明显,在烟叶旺长期和成熟期各方向均可用球形+指数套合模型进行拟合,说明球形+指数套合模型是无翅桃蚜田间分布的主题模型,属于聚集型分布的范畴。不同方向上模型拟合效果有着显著差异,说明无翅桃蚜的空间分布与空间方向有明显关系,进行昆虫空间分布型分析时,对各方向进行分别阐述,是更加科学合理的。苗期的随机程度为0.1905—0.7186,表现较强的随机性,而团棵期、旺长期、成熟期分别为:0.0413—0.1060,0.0370—0.1175和0.0116—0.1620,其随机性均小于0.25,表现很强的空间相关性,其随机性引起的空间变异极小,进一步说明了无翅桃蚜在烟叶苗期相对于其他时期田间分布的不稳定性[8, 9, 10, 11]。
通过克里格插值得到的无翅桃蚜田间分布模拟图,可以清晰反映出烟叶不同生育期无翅桃蚜的田间分布特性,无翅桃蚜在烟叶苗期至团课期发生明显迁移,分布面积明显扩大,团棵期到旺长期再到成熟期,空间结构变化较小。进一步说明了烟叶苗期无翅桃蚜的聚集性和不稳定性。相关性分析显示,无翅桃蚜的空间分布相关性呈现逐渐增强的趋势,表明无翅桃蚜逐渐定殖,迁移性逐渐减小。扬鹤等人分别通过Moore I 指标、Lloyd m*/x指标、Kuno Ca指标、扩散系数C和负二项分布中的K指标等多种方法验证桃蚜的空间分布型,证明桃蚜在桃园的分布为聚集分布,并阐述其聚集主要是由环境引起的[27],地统计学方法的分析结果验证并补充了经典统计学方法的结论。
本研究首次在原有研究的基础上加入了角度概念,将空间方向以45°为单位划分,更加准确、全面地描述昆虫的空间分布特征。
致谢: 感谢咸丰县烟叶分公司全体成员对本试验给予的帮助
| [1] | Zhu X C, Wang Y T, Wang Z F. The Manual of Chinese Tobacco Diseases and Insects. Beijing: Chinese Agricultural Press, 2002:104-105. |
| [2] | Shang S H, Chen Q Y, Xu M L. The preliminary study of the occurrence regularity and prediction model of Myzus Percicae in Guizhou province. Plant Protection, 2010, 36(5):86-91. |
| [3] | Shi X L, Bi S D, Geng J G, Zhao X J, Zou Y D, Yu K, Ke S B, Ke L. Relationships between main insect pests and their predatory natural enemies in"518"nectarine orchard. Acta Ecologica Sinica, 2011, 31(15): 4372-4384. |
| [4] | Huang D C, Zhang R Z, Wang B. The population dynamics and prevention countermeasures of Myzus percicae in protective area. Plant Protection, 2009, 35(6):108-113. |
| [5] | Deng J H, Li T F, Wu X F. The distribution pattern of Myzus percicae in vertical distribution of tobacco. Zoology Research, 1998, 19(6):446-452. |
| [6] | Zhang Y C, Chen X, He Z L. The research of spatial distribution and sampling technology of Myzus percicae. China Tobacco, 1988, 4(1):1-3. |
| [7] | Fu W F, Zhao P, Tao J C, Zou Y D, Bi S D, Geng J G, Xu Z E. Temporal and spatial relationships among Bemisia tabaci and its natural enemies in tomato fields. Journal of China Agricultural University, 2009, 14(4): 77-83. |
| [8] | Yan X H, Huang Y. Geostatistical analysis on spatial distribution of macropterous whitebacked planthopper, Sogatella furcifera (Horváth). Journal of China West Normal University: Natural Science, 2012, 33(1):1673-5072. |
| [9] | Yan X H, Zhao Z M, Liu H. Geostatistical analysis on spatial distribution of the nymph of whitebacked planthopper, Sogatella furcifera (Horváth). China's Agricultural Science, 2010, 43(3):497-506. |
| [10] | Shi G S, Li D M. Spatial distribution of masson pine caterpillar pupae and its parasitic natural enemy guilds for the overwintering generation in the different pine forests. Acta cologica Sinica, 1997, 17(4): 386-392. |
| [11] | Li Y C, Xia N B, Tu Q H, Luo Y Q, Wen J B. A geostatistical analysis of spatial patterns of Anopiophora glabripennis in poplars. Acta Ecologica Sinica, 1997, 17(4): 393-401. |
| [12] | Zong S X, Luo Y Q, Xu Z C, Wen J B, Jia F Y. Geostatistical analysis on spatial distribution of Holcocerus hippophaecolus eggs and larva. Acta Ecologica Sinica, 2005, 25(4): 831-836. |
| [13] | Wang T, Wen J B, Luo Y Q, Xu Z C, Heliövaara K. Geostatistical study on the spatial pattern of Anoplophora glabripennis in three types of stands.Acta Ecologica Sinica, 2006, 26(9): 3041-3048. |
| [14] | Huang S S, Hu H J, Liang G W. The spatial pattern of diapausing larva of striped rice borer, Chilo supperssalis Walker, with geographics. Acta Ecologica Sinica, 1999, 19(2): 250-253. |
| [15] | Zou Y D, Bi S D, Wang X S, Li G T, Meng Q L, Geng J G, Shen Y. Geostatiscal analysis on spatial patterns of Macrosiphum granarium and Aphidius. Chinese Journal Applied Ecology, 2001, 12(6): 887-891. |
| [16] | Lu Y Y, Liang G W. The spatial pattern of the cotton bollworm eggs with geostatistics. Journal of Huazhong Agricultural University, 2002, 21(1):13-17. |
| [17] | Zhou Q, Zhang R J, Gu D X. Spatial distribution patterns of the white-backed planthopper in rice fields. Acta Entomologica Sinica, 2003, 46(2):171-177. |
| [18] | Williams L, Schotzko D J, McCaffrey J P. Geostatistical description of the spatial distribution of Limonius californicus (Coleoptera: Elateridae) wireworms in the northwestern United States, with comments on sampling. Environmental Entomology, 1992, 21(5): 983-995. |
| [19] | David F N, Moore P G. Notes on contagious distributions in plant populations. Annals of Botany, 1954, 18(1): 47-53. |
| [20] | Arbous A G. Kerrich J E. Accident Statistics and the Concept of Accident-Proneness. Biometrics, 1951, 7(4): 340-432. |
| [21] | Dutta S, Bhattacharya B K, Rajak D R, Chattopadhyay C, Dadhwal V K, Patel N K, Parihar J S, Verma R S. Modelling regional level spatial distribution of aphid (Lipaphis erysimi) growth in Indian mustard using satellite-based remote sensing data. International Journal of Pest Management, 2008, 54(1): 51-62. |
| [22] | Ifoulis A A, Savopoulou-Soultani M. Use of geostatistical analysis to characterize the spatial distribution of Lobesia botrana (Lepidoptera: Tortricidae) larvae in northern Greece. Environmental Entomology, 2006, 35(2): 497-506. |
| [23] | Chen Q, Wu W J, Zhang Z F, Liang G W. Geostatistic analysis of spatial pattern of Fruhstorferiola tonkinensis Will(Orthoptera: Catantopidae) nymphs. Chinese Journal of Applied Ecology, 2007, 18(2): 467-470. |
| [24] | Jiang Y J, Yuan D X, Xie S Y, Li L L. Spatial variability of soil organic matter content in a typical karst watershed: Case study of XiaoJiang watershed, Yunnan Province. Acta Ecologica Sinica, 2007, 27 (5): 2040-2047. |
| [25] | Tang Q Y, Feng G M. Practical Statistical Analysis and DPS Data Processing System. Beijing: science press, 2002:250-281. |
| [26] | Zhou G F, Xu R M. Research on the Biogeostatistics. Beijing: Science Press, 1998: 3-10. |
| [27] | Yang H, Zheng F K. Study on spatial distribution pattern of Myzus persicae (Sulzer) in the suburb of Nanchong. Journal of China West Normal University: Natural Science, 2008, 29 (1): 63-65. |
| [1] | 朱贤朝,王彦亭,王智发. 中国烟草病虫害防治手册. 北京: 中国农业出版社, 2002:104-105. |
| [2] | 商胜华,陈庆园,徐卯林. 贵州烟区烟蚜发生规律及其预测模型的初步研究. 植物保护,2010,36(5):86-91. |
| [3] | 施晓丽,毕守东,耿继光,赵学娟,邹运鼎,禹坤,柯胜兵,柯磊.“518”油桃主要害虫与其捕食性天敌的关系. 生态学报,2011,31 (15):4372-4384. |
| [4] | 黄顶成,张润志,王斌. 保护地桃蚜种群时空动态与防治对策. 植物保护,2009, 35(6):108-113. |
| [5] | 邓建华,李天飞,吴兴富. 烟蚜在烟株上的垂直分布及其分布型. 动物学研究,1998,19(6):446-452. |
| [6] | 张运慈,陈新,贺钟麟,蒋金伟. 烟蚜空间分布与抽样技术研究. 中国烟草,1988,4(1):1-3 |
| [7] | 付文锋,赵鹏,陶金昌,邹运鼎,毕守东,耿继光,徐增恩. 番茄田烟粉虱与其天敌的时空关系. 中国农业大学学报,2009,14(4):77-83. |
| [8] | 闫香慧,黄燕. 白背飞虱长翅型空间格局的地统计学分析. 西华师范大学学报:自然科学版,2012,33(1):54-60. |
| [9] | 闫香慧,赵志模,刘怀. 白背飞虱若虫空间格局的地统计学分析. 中国农业科学,2010,43(3):497-506. |
| [10] | 石根生,李典谟. 不同松林马尾松毛虫蛹及其寄生天敌群子的空间格局分析. 生态学报,1997,17(4): 386-392. |
| [11] | 李友常,夏乃斌,屠泉洪,骆有庆,温俊宝. 杨树光肩星天牛种群空间格局的地统计学研究. 生态学报,1997,17(4): 393-401. |
| [12] | 宗世祥,骆有庆,许志春,温俊宝,贾峰勇. 沙棘木蠹蛾卵和幼虫空间分布的地统计学分析. 生态学报,2005,25(4): 831-836. |
| [13] | 王涛,温俊宝,骆有庆,许志春,Kari Heliövaara. 不同配置模式林分中光肩星天牛空间格局的地统计研究. 生态学报,2006,26(9): 3041-3048. |
| [14] | 黄寿山,胡慧建,梁广文. 二化螟越冬幼虫空间分布图式的地理统计学分析. 生态学报,1999,19(2): 250-253. |
| [15] | 邹运鼎,毕守东,王祥胜,李桂婷,孟庆雷,耿继光,沈阳. 麦长管蚜及蚜茧蜂空间格局的地学统计学研究. 应用生态学报,2001,12(6):887-891. |
| [16] | 陆永跃,梁广文. 棉铃虫卵空间分布的地理统计学分析. 华中农业大学学报,2002,21(1):13-17. |
| [17] | 周强,张润杰,古德祥. 白背飞虱在稻田内空间结构的分析. 昆虫学报,2003,46(2):171-177. |
| [23] | 陈强,吴伟坚,张振飞,梁广文. 越北腹露蝗若虫空间格局的地统计学分析. 应用生态学报,2007,18(2): 467-470. |
| [24] | 蒋勇军,袁道先,谢世友. 典型岩溶流域土壤有机质空间变异——以云南小江流域为例. 生态学报,2007,27(5):2040-2047. |
| [25] | 唐启义,冯明光. 实用统计分析及其DPS数据处理系统. 北京:科学出版社,2002:250-281. |
| [26] | 周国法,徐汝梅. 生物地理统计学. 北京:科学出版社,1998:3-10. |
| [27] | 扬鹤,郑发科. 南充市郊桃园桃蚜的空间分布型研究. 西华师范大学学报:自然科学版,2008,29(1): 63-65. |