 2014, Vol. 34
文章信息
- 马璐, 曹文清, 张文静, 林元烧, 郑连明, 杨位迪, 王宇杰
- MA Lu, CAO Wenqing, ZHANG Wenjing, LIN Yuanshao, ZHENG Lianming, YANG Weidi, WANG Yujie
- 北部湾北部海域夏季微型浮游动物对浮游植物的摄食压力
- An ecological study on zooplankton in the northern Beibu Gulf V: the effects of microzooplankton grazing on phytoplankton in summer
- 生态学报, 2014, 34(3): 546-554
- Acta Ecologica Sinica, 2014, 34(3): 546-554
- http://dx.doi.org/10.5846/stxb201207201034
-
文章历史
- 收稿日期:2012-7-20
- 修订日期:2013-6-21


海洋微型浮游动物(Microzooplankton)是指体长介于2—200 μm的浮游动物,主要由原生动物、异养鞭毛虫、某些后生动物以及无脊椎动物幼体等组成。有研究[1, 2, 3]表明在海洋生态系统中,微型浮游动物的摄食活动可消耗60%—70%的初级生产力。因此,微型浮游动物在初级生产者和后生动物的能量传递中起到连接作用,在海洋生态系统的能量传递和碳流通过程中扮演着重要的角色。
北部湾北部海域位于南海北部季风区内亚热带半封闭海湾的一部份,该海域海洋生物资源丰富,拥有红树林、珊瑚礁和海草床三类最典型的海洋自然生态系统[4, 5]。这种复合型的生态系统其初级生产力通过微型浮游动物向上传递的效率如何?本文利用现场稀释培养法,结合微型浮游动物的空间分布,对北部湾北部微型浮游动物对浮游植物摄食压力进行了研究,旨在评价微型浮游动物在海洋生态系统物流与能流过程中所做的贡献。
1 材料和方法 1.1 研究站位2011年8月6—13日,利用“天龙号”科学考察船在北部湾北部21个站位进行了物理水文、化学和生物的综合调查,其中于HB17、HB19、HB21、HB30和HB32站位进行了微型浮游动物种类组成以及摄食速率的研究(图1)。

|
| 图1 北部湾北部调查站位 Fig. 1 Location of sampling stations in northern of Beibu Gulf |
采集表层水样,经200 μm筛绢过滤,再分别使用20 μm的筛绢、2 μm的Millpore膜和0.7 μm的GF/F膜(Whatman)过滤400 mL水样。将载有浮游植物样品的滤膜装入锡纸包好的10 mL带盖离心管中,放入-20 ℃冰箱中保存。带回实验室后,加入8 mL 90%的丙酮,放入4 ℃冰箱中黑暗萃取24 h,利用Turner Designs 10-AU-005-CE荧光光度计,测定Chl a的浓度[6],同步获得相关站位的主要环境参数如表 1所示。
|
站号
Station | 温度/℃
Temperature | 盐度
Salinity | 硅酸盐SiO-3
/(μmol/L) | 磷酸盐PO-4
/(μmol/L) | 硝酸盐NO-3
/(μmol/L) | 铵盐NH+4
/(μmol/L) | 亚硝酸盐NO-2
/(μmol/L) | 叶绿素aChl a
/(μg/L) |
| HB17 | 31.0 | 30.01 | 1.93 | 0.00 | 0.47 | 0.66 | 0.002 | 0.08 |
| HB19 | 30.8 | 31.78 | 3.73 | 0.03 | 0.00 | 0.48 | 0.001 | 0.47 |
| HB21 | 30.0 | 33.09 | 0.94 | 0.01 | 2.83 | 0.74 | 0.002 | 0.27 |
| HB30 | 30.7 | 31.62 | 0.11 | 0.02 | 0.02 | 2.00 | 0.001 | 1.02 |
| HB32 | 30.7 | 32.36 | 1.75 | 0.11 | 0.53 | 0.73 | 0.021 | 1.50 |
采集表层水样1 L于塑料采样瓶中,加入酸性Lugol′s液,终浓度为2%,带回实验室镜检。水样在阴凉处保存,静止沉降48 h以上,用底端具有20 μm筛绢的虹吸管吸取上清液,浓缩水样至5 mL,保存于8 ℃黑暗环境中,吸取100 μL,至于计数框中,重复6个平行样,倒置显微镜下放大200倍以上进行微型浮游动物的样品的鉴定[7, 8, 9]和计数(纤毛虫和无脊椎动物幼虫(体))。换算成微型浮游动物在自然水体中的丰度,计算公式如下:

式中,CA为微型浮游动物总丰度(个/L);N为镜检得到的总个体数;V1为浓缩水样体积;V2为采集水样的体积;V3为计算水样体积。
1.4 微型浮游动物摄食速率的测定 1.4.1 稀释培养采集表层水样,用200 μm的筛绢过滤得到天然海水,取一部分水样再经过孔径为0.7 μm 的GF/F膜(Whatman)过滤得到稀释海水。将稀释海水和天然海水以25%、50%、75%以及100%的比例混合。 将各稀释比例水样装入4 L的透明培养瓶中(培养瓶使用前经10%盐酸浸泡24 h,用超纯水冲洗干净),再放入培养箱,在甲板上利用自然海水流动循环培养24 h,使得培养条件尽可能接近自然条件。
培养前后,每个培养瓶采集400 mL水样,分别使用20 μm的筛绢和0.7 μm 的GF/F膜(Whatman)以及2 μm Millpore膜过滤,保存以及测定叶绿素a,方法同上。
1.4.2 微型浮游动物的摄食率和生长率计算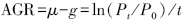
式中,AGR为表观生长率;μ为浮游植物的生长率;g为微型浮游动物的摄食率;Po和Pt分别为培养前后叶绿素a的值;t为培养时间(h)。
将AGR与稀释因子(自然海水占混合海水的比例)进行线性回归,截距是浮游植物的生长率μ(d-1),斜率是微型浮游动物的摄食率g(d-1)。
微型浮游动物摄食对浮游植物现存量Ps以及初级生产力的摄食压力Pp计算公式,表示如下:
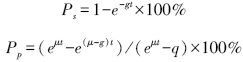
调查站位表层平均水温(30.6±0.4)℃,总体呈现湾顶向外递减的趋势;表层平均盐度31.77±1.14,分布趋势与温度相反,近岸低,远岸高(表 1),其中钦州湾海域以及涠洲岛以南海域为两个最典型的区域,前者高温低盐,后者低温高盐。 调查海域营养盐种类组成,主要以SiO-3和TIN(包括NO-3、NO-2和NH+4)为主。TIN范围为0.48—3.57 μmol/L,平均含量为(1.70±1.17) μmol/L,主要由NO-3以及NH+4组成,分别占TIN总量的45.4%以及54.3%,NO-2盐含量总体偏低,对TIN的贡献仅0.3%。表层PO-4盐含量平均浓度仅为(0.04±0.04) μmol/L,除雷州半岛西侧海域外,均低于0.05 μmol/L,其中钦州湾海域含量低于最低检测值。SiO-3盐含量与TIN相当为(1.69±1.35) μmol/L,除铁山港海区最低(0.11 μmol/L),其余各海区均接近1.00 μmol/L或者超过1.00 μmol/L。营养盐水平分布未出现明显特征,同一海域中各营养盐分配差异性较大,其中以雷州半岛西侧海区相对平均。
北部湾北部海域表层水体中Chl a含量为(0.67±0.58) μg/L,高值区出现在雷州半岛西侧以及铁山港海域,高于1.00 μg/L,低值区则位于钦州湾海域,仅为0.08 μg/L。叶绿素分粒径结果(图2)显示,Nano级(2—20 μm)和Pico级(0.7—2 μm)浮游植物占绝对优势;铁山港和钦州湾海域浮游植物粒径结构相似,以Nano级和Micro级组成,Pico级浮游植物对Chl a浓度贡献非常少,几乎为0,其中Nano级占绝对优势;其余调查海域浮游植物对Chl a浓度的贡献以Nano级和Pico级为主,且Pico级占相对优势。

|
| 图2 0.7—2 μm、2—20 μm以及20—200 μm浮游植物水平分布 Fig. 2 Horizontal profiles of chlorophyll a for phytoplankton in the 20—200 μm,2—20 μm and 0.7—2 μm size fractions |
北部湾北部海域微型浮游动物共鉴定17属,48种,总丰度为(842±322) 个/L,水平分布具有湾顶向外递减的特征。微型浮游动物丰度最高值位于铁山港海域,达1167 个/L,低值区位于离湾顶最远的涠洲岛以南海域,仅为400 个/L(表 2)。
|
种类
Taxa | 站位 Station | ||||
| HB17 | HB19 | HB21 | HB30 | HB32 | |
| 砂壳纤毛虫Aloricate ciliates/(个/L) | 42 | 50 | 167 | 250 | 175 |
| 无壳纤毛虫Loricate ciliates/(个/L) | 575 | 958 | 142 | 708 | 442 |
| 桡足类幼体Copepod nauplii/(个/L) | 192 | 133 | 92 | 208 | 75 |
| 总计 Total | 808 | 1,142 | 400 | 1,167 | 692 |
微型浮游动物类群组成上,以无壳纤毛虫为主(图3),平均丰度(565±304) 个/L,总丰度占微型浮游动物总量的67.1%,最高值出在涠洲岛和北海之间的海域,达942 个/L,最低值出现涠洲岛南部海域,仅142 个/L;种类组成上以急游虫类为主,其中丁丁急游虫(Strombidium tintinnodes)为最优势种类,共出现775 个/L,占无壳纤毛虫总丰度的27.2%。砂壳纤毛虫与桡足类幼体数量相当,丰度分别占总丰度的16.2%和16.6%;前者集中在铁山港以及雷州半岛西侧海域,平均丰度为(137±89) 个/L,种类组成上以拟铃虫属(Tintinnopsis spp.)为主,其总丰度为383 个/L,占砂壳类总丰度的56.1%;后者则主要聚集在湾顶(钦州湾以及铁山港海区),平均丰度为(140±59) 个/L。

|
| 图3 北部湾北部海域不同类群微型浮游动物水平分布 Fig. 3 Horizontal profiles of different group of microzooplankton in northern of Beibu Gulf |
现场稀释实验中,利用培养前后总Chl a以及Nano级Chl a含量变化(表 3),回归分析得到稀释实验结果(图4),其中r2代表表观生长率(AGR)和稀释因子得到回归曲线的相关因子。调查期间,浮游植物平均生长率(μ)为(0.01±1.46) d-1,调查海域之间具有一定差异性,最高值出现在钦州湾海域,其中北海和涠洲岛之间海域出现了生长率的负值;微型浮游动物的平均摄食率(g)摄食率为(0.72±0.46) d-1,最高值同样位于钦州湾海域,生长率出现负值的海区摄食率为最低。微型浮游动物摄食对浮游植物现存量的摄食压力为28.1%—66.0%;对初级生产力的摄食压力为-7.4%—438.4%。此外本研究中铁山港以及雷州半岛西侧海域由于稀释实验r2值比较小,可能由于实验中出现一些操作问题或者光照太强,因此讨论部分并不计入在内。
|
站位
Station | 粒径/μm
Size-fraction | μ
/d-1 | g
/d-1 | g/μ | Ps/% | Pp/% | r2 |
| μ为浮游植物的生长率;g为微型浮游动物摄食率;Ps为微型浮游动物对浮游植物现存量的摄食压力;Pp为微型浮游动物对浮游植物初级生产力的摄食压力;r2为相关性系数 | |||||||
| HB17 | <200 | 1.13 | 1.08 | 0.96 | 66.0 | 97.6 | 0.55 |
| 2—20 | 0.4 | 0.95 | 2.38 | 61.3 | 186.7 | 0.61 | |
| HB19 | <200 | -1.57 | 0.33 | -0.21 | 28.1 | -7.4 | 0.68 |
| 2—20 | -1.15 | 0.75 | -0.65 | 53.0 | -24.5 | 0.66 | |
| HB21 | <200 | 0.11 | 0.61 | 5.55 | 45.7 | 438.4 | 0.97 |
| 2—20 | 0.36 | 1.57 | 4.36 | 79.2 | 264.8 | 0.88 | |
| HB30 | <200 | -0.85 | 0.14 | -0.16 | 12.6 | -9.4 | 0.02 |
| 2—20 | -0.52 | 0.52 | -1.00 | 40.6 | -59.9 | 0.84 | |
| HB32 | <200 | -0.06 | 0.14 | -2.33 | 13.2 | -212.7 | 0.01 |
| 2—20 | -0.3 | 1.87 | -6.23 | 84.5 | -248.9 | 0.64 | |

|
| 图4 北部湾北部海域稀释实验回归分析 Fig. 4 Regression of dilution experiments onboard in northern of Beibu Gulf based on total chlorophyll a |
北部湾北部微型浮游动物主要以纤毛虫为主,一般认为温度和饵料浓度是影响纤毛虫的主要因素[12, 13, 14]。首先,温度升高促进纤毛虫的生长,进而影响水平分布。Nielsen等[12]对4个纤毛虫类群的生长率计算发现,其生长率与表层水温具有相同的季节变化趋势。此外,也有研究[15]发现甲藻在温度较 低的环境中生长率较低,这种温度限制生长的现象 可能也适用与其他微型浮游动物类群,例如纤毛虫[16]。本调查相关性结果显示温度与微型浮游动物丰度存在正相关(r2=0.4568,P<0.01)。其次,饵料丰富促进纤毛虫摄食,也会影响其分布。Gómez[17]等指出砂壳纤毛虫数量主要受到饵料限制,因而分布在Chl a最高值的水层。Setala等[18]1991年对波罗的海纤毛虫调查结果显示其丰度与Chl a具有显著的相关性。但本调查海域结果并未显示微型浮游动物丰度与Chl a含量有显著相关性,这与2007年对南海北部浮游纤毛虫调查结果相同[19],这可能是由于纤毛虫这种小型浮游动物遵循复杂的分布模式,除了Chl a或者初级生产力变化对其分布有影响外[20],捕食作用在控制种群分布上可能还起着非常重要的作用[12]。
3.2 微型浮游动物摄食与浮游植物生长相互作用Calbert[1]基于开阔大洋以及近岸海洋系统中,对于微型浮游动物摄食率以及浮游植物生长率综合分析结果显示浮游植物生长和微型浮游动物摄食存在显著正相关(P<0.001,r2=0.37)。本研究中微型浮游动物摄食率与浮游植物生长率之间也存在相同关系(图5)。微型浮游动物摄食是被动的或者资源分配型[22],总是优先摄食生长快速的物种,获得长期稳定的食物来源,维持其自身生长,微型浮游动物摄食率与浮游植物生长率的高度耦合也促进生态系统的稳定性。

|
| 图5 微型浮游动物摄食率与现存量和浮游植物生长率的关系 Fig. 5 Relationship between phytoplankton standing stock,growth rate with grazing rate |
微型浮游动物对不同粒径浮游植物的选择性摄食在前人的研究中都有提到[23, 24, 25],类似的结果在本研究也有发现:微型浮游动物对Nano级浮游植物的摄食率((0.94±0.57) d-1)高于对总浮游植物的摄食率((0.72±0.46) d-1)。急游虫属(Strombidium sp.)主要为小于30 μm的种类,这类纤毛虫则优先摄食3—7 μm颗粒的浮游植物[26, 27]。拟铃虫属(Tintinnopsis sp.)由于其口径较小(平均口径为38.5 μm)只能摄食Pico以及Nano级浮游植物[28]。本研究海域微型浮游动物优势类群为急游虫属(Strombidium sp.),浮游植物则以Nano级为主,正好是纤毛虫等微型浮游动物的适宜饵料,因此也佐证了微型浮游动物摄食率与叶绿素a含量存在显著负相关的结果(图5)。可见微型浮游动物摄食是该海域浮游植物现存量的主要控制因素,且对浮游植物的生长具有一定的抑制作用。
3.3 微型浮游动物摄食压力评价实验期间,北部湾北部海域浮游植物生长率为-1.57—1.13 d-1,微型浮游动物摄食率为0.33—1.08 d-1,可见北部湾北部海域是高生长率、高周转率的海区,浮游植物类群以小于20 μm的微型藻类占绝大部分,摄食消耗-8.1%—438.4%的初级生产力。参考Calbet[1]等对全世界微型浮游动物稀释法实验比较的结果,以及结合国内其他海区稀释法实验结果[21, 22, 23, 24, 25],表明广西沿岸微型浮游动物摄食压力处于中等水平。
摄食比(g/μ)是衡量浮游植物生长以及微型浮游动物摄食是否平衡的重要指标,由表 3结果显示,只有北海以南海域g/μ>1,说明微型浮游动物摄食一定程度上可以控制浮游植物生长,其对浮游植物初级生产力的平均摄食压力可达176.2%。涠洲岛以南海域摄食率虽然不及钦州湾海域高,但高于浮游植物生长率(0.11 d-1),对初级生产力的摄食压力反而最高,可见当摄食率远高于生长率时,微型浮游动物摄食作用对能量的转换效率最高。此外捕食控制对纤毛虫种群分布具有非常重要的作用,主要为桡足类,浮游桡足类不仅仅摄食大型纤毛虫,对中小型纤毛虫也具有较高的捕食压力;此外一些异养甲藻的摄食作用也会造成纤毛虫的死亡[12]。因此在评价微型浮游动物摄食压力时,捕食作用是不可忽视。而北部湾北部海域是一个集红树林、珊瑚礁和海草床3种典型自然生态系统为一体的复合型生态系统,该生态系统生物资源丰富,具有较高的初级生产力,微型浮游动物摄食活跃,所固定的能量对微食物环内碳循环具有重要作用;但是要提高该生态系统整体碳循环效率,还需要大中型浮游动物的摄食作用。
| [1] | Calbet A, Landry M R. Phytoplankton growth, microzooplankton grazing, and carbon cycling in marine systems. Limnology and Oceanography, 2004, 49(1): 51-57. |
| [2] | Stelfox C E, Burkill P H, Edwards E S, Harrisa R P, Sleighb M A. The structure of zooplankton communities, in the 2 to 2000 μm size range, in the Arabian Sea during and after the SW monsoon, 1994. Deep Sea Research Part II: Topical Studies in Oceanography, 1999, 46(3/4): 815-842. |
| [3] | Suzuki K, Tsuda A, Kiyosawa H, Takeda S, Nishioka J, Saino T, Takahashi M, Wong C S. Grazing impact of microzooplankton on a diatom bloom in a mesocosm as estimated by pigment-specific dilution technique. Journal of Experimental Marine Biology and Ecology, 2002, 271(1): 99-120. |
| [4] | Ma R Y, Li J, Zheng E W, Huang S F. ENSO makes an impact on the storm tide of Guangxi coasting area around the Beibu Gulf. Journal of Guangxi University: Natural Science Edition, 2008, 33(4): 422-425. |
| [5] | Cheng Q Y, Li F H. The marine environmental protection condition and strategy in Guangxi's littoral. Environmental Science and Management, 2008, 33(9): 146-149. |
| [6] | Sun J, Song X X, Yin K D, Liu D Y. Preliminary study of microzooplankton herbivory in Hong Kong in summer. Acta Ecologica Sinica, 2003(23): 712-724. |
| [7] | Xu K D, Hong H S, Song W B, Ke L, Ma H G. Studies on tintinnine ciliates in the Taiwan strait (Ciliophora: Tintinnina). Acta Zootaxonomica Sinica, 2001, 26(4): 454-466. |
| [8] | Warren A. Free-living Ciliates in the Bohai and Yellow Seas, China//Song W B, Hu X K, Trans. Beijing: Science Press, 2009. |
| [9] | Xu D P, Song W B. Tintinnid ciliates from qingdao(Protozoa, Ciliophora, Tintinnida). Acta Zootaxonomica Sincia, 2005, 30(3): 501-508. |
| [10] | Landry M R, Hassett R P. Estimating the grazing impact of marine micro-zooplankton. Marine Biology, 1982, 67(3): 283-288. |
| [11] | Burkill P H, Head E, Fransz G. Grazing by microzooplankton//SCOR/JGOFS Report No. 6; Coremeasurement protocols. Reports of the Core Measurement Working Groups, 1990: 31-37. |
| [12] | Nielsen T G, Kirboe T. Regulation of zooplankton biomass and production in a temperate coastal ecosystem. 2. Ciliate. Limnology and Oceangraphy, 1994, 39(3): 508-519. |
| [13] | Suzanne L S, Erin L M, Olson M B. Microzooplankton grazing in the coastal gulf of Alaska: variations in top-down control of phytoplankton. Limnology and Oceanography, 2007, 52(4): 1480-1494. |
| [14] | Zhang C X, Zhang W C, Zhao N, Xiao T. Distribution of planktonic ciliates in autumn and winter in the shelf areas of the East China Sea. Acta Oceanologica Sinica, 2011, 33(1): 127-137. |
| [15] | Archer S D, Leakey R J G, Burkll P H, Sieigh M A. Microbial dynamics in coastal waters of east Antarctica: herbivory by heterotrophic dinoflagellates. Marine Ecology Progress Series, 1996, 139(1): 239-255. |
| [16] | Rose J M, Caron D A. Does low temperature constrain the growth rates of heterotrophic protists? Evidence and implications for algal blooms in cold waters. Limnology and Oceanography, 2007, 52(2): 886-895. |
| [17] | Gómez F. Trends on the distribution of ciliates in the open Pacific Ocean. Acta Oecologica, 2007, 32(2): 188-202. |
| [18] | Setl O, Kivi K. Planktonic ciliates in the Baltic Sea in summer: distribution, species association and estimated grazing impact. Aquatic Microbial Ecology, 2003, 32(3): 287-297. |
| [19] | Zhang C X, Zhang W C, Xiao T. Ciliate abundance and biomass in northern South China Sea in October 2007. Acta Ecologica Sinica, 2010, 30(4): 0867-0877. |
| [20] | Quevedo M, Viesca L, Andón R, Fernández E. The protistan microzooplankton community in the oligotrophicnorth-eastern Atlantic: large-and mesoscale patterns. Journal of Plankton Research, 2003, 25(5): 551-563. |
| [21] | Zeng X B, Huang B Q. Grazing impact of microzooplankton in Taiwan strait and its contribution to nutrient regeneration. Journal of Xiamen University: Natural Science, 2007, 3(2): 231-235. |
| [22] | Sun J, Feng Y Y, Zhang Y H, Hutchins D A. Fast microzooplankton grazing on fast-growing, low-biomass phytoplankton: A case study in spring in Chesapeake Bay, Delaware Inland Bays and Delaware Bay. Hydrobiology, 2007, 589(1): 127-139. |
| [23] | Zhang J T, Yin K D, Dong L H. Microzooplankton grazing rate of size-fractionated phytoplankton in spring in the Yellow Sea, China. Marine Sciences, 2011, 35(9): 1-7. |
| [24] | Sun J, Dawson J, Liu D Y. Microzooplankton grazing on phytoplankton in summer in the Jiaozhou Bay, China. Chinese Journal of Applied Ecology, 2004, 15(7): 1245-1252. |
| [25] | Huang B Q, Xiang W G, Zeng X B, Chiang K P, Tian H J, Hu J, Lan W L, Hong H S. Phytoplankton growth and microzooplankton grazing in a subtropical coastal upwelling system in the Taiwan Strait. Continental Shelf Research, 2011, 31(6): S38-S56. |
| [26] | Dupuy C, Talarmin A, Hartmann H J, Delmas D, Courties C, Marquis E. Community structure and grazing of the nano-microzooplankton on the continents shelf of the Bay of Biscay. Estuarine, Coastal and Shelf Science, 2011, 95(1): 1-13. |
| [27] | Ichinotsuka D, Ueno H, Nakano S. Relative importance of nanoflagellates and ciliates as consumers of bacteria in a coastal sea area domainated by oligotrichous Strombidium and Stobilidium. Aquatic Microbial Ecology, 2006, 42(2): 139-147. |
| [28] | Gifford D J. Impact of grazing by microzooplankton in the Northwest Arm of Harlifax Harbour, Nova Scotia. Marine Ecology Progress Series, 1988, 47: 679-694. |
| [4] | 麻荣永, 李建, 郑二伟, 黄淑芳. ENSO对北部湾广西沿海风暴潮的影响. 广西大学学报: 自然科学版, 2008, 33(4): 422-425. |
| [5] | 陈群英, 李凤华. 广西沿海地区海洋生态环境保护状况及对策建议. 环境科学与管理, 2008, 33(9): 146-149. |
| [6] | 孙军, 宋秀贤, 殷克东,刘东艳. 香港水域夏季微型浮游动物摄食研究. 生态学报, 2003, 23(4): 712-724. |
| [7] | 徐奎栋, 洪华生, 宋微波, 柯林, 马洪钢. 台湾海峡的砂壳纤毛虫研究 (纤毛动物门: 砂壳亚目). 动物分类学报, 2001, 26(4): 454-466. |
| [8] | Warren A. 中国黄渤海的自由生纤毛虫//宋微波, 胡晓钟, 译. 北京: 科学出版社, 2009. |
| [9] | 徐大鹏, 宋微波. 青岛沿海砂壳纤毛虫 (原生动物, 纤毛门, 砂纤目). 动物分类学报, 2005, 30(3): 501-508. |
| [14] | 张翠霞, 张武昌, 赵楠, 肖天. 秋冬季东海陆架区浮游纤毛虫的生态分布特点. 海洋学报, 2011, 33(1): 127-137. |
| [19] | 张翠霞, 张武昌, 肖天. 2007 年 10 月南海北部浮游纤毛虫的丰度和生物量. 生态学报, 2010, 30(4): 867-877. |
| [21] | 曾祥波, 黄邦钦. 台湾海峡微型浮游动物的摄食压力及其对营养盐再生的贡献. 厦门大学学报: 自然科学版, 2007, 3(2): 231-235. |
| [23] | 张江涛, 殷克东, 董丽华. 春季黄海微型浮游动物对不同粒径浮游植物的摄食速率研究. 海洋科学, 2011, 35(9): 1-7. |
| [24] | 孙军, Dawson J, 刘东艳. 夏季胶州湾微型浮游动物摄食初步研究. 应用生态学报, 2004, 15(7): 1245-1252. |