 2014, Vol. 34
文章信息
- 朱治林, 孙晓敏, 于贵瑞, 温学发
- ZHU Zhilin, SUN Xiaomin, YU Guirui, WEN Xuefa
- 陆地生态系统臭氧通量观测和气孔吸收估算研究进展
- A review of research on ozone flux observation and stomatal uptake estimation over terrestrial ecosystems
- 生态学报, 2014, 34(21): 6029-6038
- Acta Ecologica Sinica, 2014, 34(21): 6029-6038
- http://dx.doi.org/10.5846/stxb201310172512
-
文章历史
- 收稿日期:2013-10-17
- 网络出版日期:2014-3-13


大气中约90%的臭氧(O3)位于平流层,可以保护地球上的动植物和人类免受过量的紫外照射。而近地面大气中的O3却是一种主要污染气体,其主要来源是氮氧化物(NOx)和挥发性有机物等在太阳光照射下发生光化学反应产生,同时大气垂直湍流输送和远距离水平传输也是其重要来源[1]。高浓度O3影响植物生长发育、光合作用和产量形成[2, 3, 4, 5, 6]。长期定位观测表明,全球地面O3浓度每年以0.5%—2%的速度在逐渐增加[7]。随着我国工业化和城市化的迅速发展,各种交通和工业排放的NOx也在快速增加,在适宜条件下产生的高浓度O3已经开始威胁到我国的粮食产量[8, 9]。
O3对植物的影响通常是采用开顶式气室(Open Top Chamber,OTC)等控制实验来研究的,而O3对自然生态系统的影响,则主要是通过观测陆地生态系统上的O3浓度和O3通量等来进行研究的,并提出了一系列基于O3浓度和通量的环境评价指标[10, 11]。O3对植被的伤害是由于其进入植物体内部发生生化反应所引起的,而基于O3浓度的指标没有考虑植被和生态系统状况(如气孔开闭,作物生育期和叶面积大小等),所以,一些科学家认为,基于O3通量(特别是“气孔吸收”)评估指标比基于O3浓度评估指标能更好地评价O3对植被和生态系统的影响[10, 11, 12, 13, 14, 15]。本文介绍了关于O3风险评估指标和评估方法,重点评述了生态系统尺度O3通量观测和气孔吸收估算的主要方法以及在不同生态系统上的研究进展,分析了我国在这方面的研究现状并对未来的研究工作进行了展望。
1 生态系统O3风险评估指标和方法 1.1 基于O3浓度的评估指标O3浓度(Concentration)是指大气中单位体积内O3的含量,一般用相对浓度或混合比(nmol/mol)来表示。基于浓度的评估指标主要有两类:(1)平均浓度(Mean),常用的指标有M7和M12,分别为植物在一定生长期内的白天7h(9:00—16:00)和12h(8:00—20:00)的O3浓度平均值。(2)O3暴露(Exposure)[14],指O3浓度在某个植物生长期内的累计。不同国家和地区的科学家采用不同的指标。欧洲普遍采用AOT40 (Concentration accumulated over a threshold ozone concentration of 40 nmol/mol,超过40 nmol/mol小时平均O3浓度与40 nmol/mol差值的累积)来定量评价O3对植物的影响;而美国环境保护局主要采用SUM06(The sum of all hourly average concentrations ≥ 60 nmol/mol,大于60 nmol/mol的小时平均O3浓度的累积值)和W126(The sigmoidally weighted exposure index,权重修正后的O3浓度累计)作为植物保护标准[11, 12]。
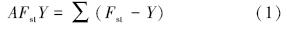
1.2 基于O3通量的评估指标O3通量(O3 Flux,Fo)是指O3在近地层大气的湍流交换强度,即单位时间内通过单位面积的O3数量(nmol/m2s)。根据O3沉积位置的不同,Fo又可简单地分为 (植物的叶、茎等) 气孔吸收通量(Fst)和(土壤和植物表皮,包括化学分解)非气孔吸收通量(Fns)[16, 17]。O3对植物的影响主要与植物的Fst有关,主要评估指标有[16]:(1) 有效气孔吸收(Effective ozone stomatal uptake,FstY),指单位叶投影面积(Projected Leaf Area,PLA)超过阈值Y的气孔吸收通量。(2) O3剂量(Dose)[14],单位面积上一段时间内气孔实际吸收O3数量的累计,即O3气孔吸收通量的时间积分。常用的指标:有效O3剂量(AFstY),即单位投影叶面积某个生长期超过阈值Y的气孔吸收总量(Accumulated stomatal flux of ozone above a flux threshold of Y nmol/m2 PLAs)。有效O3剂量计算方法为:
有效O3剂量还有其他的表述或术语,如CUOX (Cumulated Uptake of Ozone exceed threshold X)[18]或PODY(Phytotoxic Ozone Dose exceed threshold Y)等[19],其物理含义基本同AFstY。
1.3 临界值由于植物对O3存在一定的解毒作用,只有高O3浓度才会影响作物的生长发育和产量,所以在这些指标中大都存在一个临界值(Critical level)。临界值是反映O3对植物产生负作用的一个经验值[3, 15, 20],意味着低于该值的影响可以忽略不计。AOT40中的40 nmol/mol,SUM06中的60 nmol/mol和AFstY中的Y值等都是各指标的临界值。
基于O3浓度的暴露指标虽然缺乏一定的科学基础,但该指标容易观测和计算,所以得到广泛应用。基于O3气孔吸收的评估指标考虑了植物的实际吸收,有充分的科学基础,但该指标难以观测或估算。两类指标都有一些共同缺点[12]:(1)没有充分的数据和实验基础,因为这些指标和模型都是在OTC等环境下得到的,与实际情况是有差别的;(2)临界值分组过于简单,没有考虑不同植物对O3敏感程度的差别;(3)评估模型缺乏大量的野外实验验证。
1.4 生态系统O3风险评估方法从生态学角度研究O3的目的之一是开展O3的风险评估,即利用模型和指标来定量研究O3对植物和生态系统的总体影响(如植物伤害程度,生物量或产量减少等)。两种主要途径可以进行O3风险评估:基于大田控制试验的评估和基于自然生态系统O3浓度和通量观测的评估。由于自然植被和生态系统的损伤受多种环境条件的影响,所以很难直接得到O3对自然生态系统影响的定量评估模型,一般都是通过修订田间控制试验得到的模型来评估O3对生态系统的总体影响。例如,王春乙和白月明[21]在分析O3对小麦产量影响时,认为用OTC试验得到模型高估了O3对实际农田产量的影响,并给出了修订系数。
生态系统O3风险评估需要结合模型和指标才能进行,其中相关的指标需要在自然生态系统上进行实际观测和模拟才能获得。虽然基于O3吸收的生态系统风险评估方法存在较大的不确定性,但它是未来的研究方向[14]。现介绍生态系统O3通量观测和气孔吸收估算的方法和一些研究进展。
2 O3通量观测和气孔吸收估算方法 2.1 O3通量观测方法微气象方法(主要包括梯度法和涡度相关法)是测量生态系统O3通量的主要技术手段[22]。用梯度法测量大气O3通量,需要进行两(多)层的O3浓度、风速和温度梯度观测,再用通量-廓线关系法计算出近地层湍流通量。
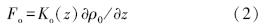
式中,Ko是O3湍流交换系数,∂ρo/∂z是O3浓度随高度z的垂直变化梯度。由于O3的绝对浓度很低,在近地面的浓度梯度也比较小,所以用该方法计算O3通量时需要有高精度的仪器和合适的气象条件。
涡度相关方法是最近几十年快速发展起来的一种新的技术方法,被公认为是目前测量地气交换的最好方法,并在CO2通量和水汽通量测量方面得到广泛应用[23]。但该方法在O3通量的观测应用上不是很成熟,主要瓶颈是测量O3浓度脉动的关键仪器还没有大量的商业生产和应用。大多数仪器都是由科学家和技术人员自行研制和改进,并在有限范围内应用。这类仪器通常是利用O3和乙烯基或芳香物等发生化学反应并产生蓝光的原理来实现对O3浓度变化的快速测量[24, 25]。该类仪器的主要缺点是需要有人经常维护,并且仪器灵敏度会随着反应物的消耗和环境条件变化而发生改变,但通过一定的校正可以满足短期的科学研究需要。假设仪器灵敏度在短时间内的变化忽略不计,且输出信号与绝对浓度成正比,那么可以利用该类仪器测量O3沉积速度Vd(等于O3通量除以O3浓度),再辅助于慢速反应的O3分析仪观测的O3绝对浓度 o,就可以用以下公式计算出O3通量(Fo)[26]:
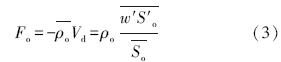
式中,w 垂直风速(m/s),So 是快速响应的O3浓度脉动仪的信号输出,上横线表示时间平均,撇号表示变量的脉动。同其他涡度相关通量计算一样,所得到的O3通量必须要经过一系列的校正(如坐标旋转校正,频谱校正,WPL校正等)和质量控制[27]。
为了弥补涡度相关方法在O3通量观测应用中的不足,一些“准涡度相关”法已经开始在国际上应用,“离散涡度相关法(Disjunct Eddy Covariance,DEC)”就是其中之一[28, 29]。该方法的基本原理可概况为:用中等响应速度(如响应时间1—10 s)的O3浓度仪器配合超声风速仪的垂直风速脉动来估算通量,然后通过谱分析来校正观测的通量。虽然该方法不如标准的涡度相关方法准确,但经过一系列的校正后,仍然可以达到一定的精度。
在用TOC等控制实验研究O3对作物的影响时,O3通量还可以用箱式法来估算[30]。其基本原理是利用动态箱入口和出口O3浓度之差来计算O3通量,即:
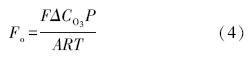
式中,F是体积流量(m3/s),ΔCO3是O3浓度变化 (nmol/mol),P是大气压(Pa),A是动态箱底面积(m2),R是气体常数(J/mol K),T是温度(K)。
2.2 生态系统气孔吸收估算方法生态系统或群体总O3通量可以测量,但进入气孔的O3通量不能直接测量。利用气孔阻抗模型可以将总O3通量分割成气孔吸收和非气孔吸收[17, 31, 32, 33]。近地层O3湍流交换总的阻抗(Rt,s/m)在数值上等于沉积速度的倒数,可以分解为空气动力学阻抗(Ra)、边界层阻抗(Rb)和冠层阻抗(Rc)之间的串联关系,而Rc又可以简单的分解为气孔阻抗(Rst)和非气孔阻抗(Rns)的并联关系。即:
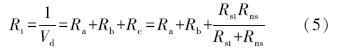
Ra和Rb可以通过微气象方法得到[32]

式中,z是观测高度,u*是摩擦风速,d是零平面位移,k是卡曼常数(0.4),z0是粗糙度,ψh是稳定度校正函数,Sc和Pr分别是施密特数(Schmidt Number,1.07)和普朗特数(Prandtl Number,0.72)[32]。如果通过观测得到了沉积速度或总阻抗,再辅以其他的微气象观测数据,用余项法可计算Rc。如果要继续区分气孔吸收和非气孔吸收通量,必须借助一些假设和模型先估算Rns或Rst。可以利用参数化的方法先估算Rns[34, 35],也可以先估算Rst,再用公式(5)计算Rns。
Rst有许多估算模型,其中连乘模型是最常用的。实际O3气孔导度(Gst,等于Rst的倒数)是Gst最大值(Gmax)与一系列响应函数(数值介于0—1之间)的连乘关系。Feng等[19]给出了我国冬小麦O3气孔导度计算模型:
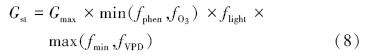
式中,Gmax是在没有光照和饱和差限制条件下开花期间的测量值,fmin是最低气孔导度,fO3,fphen,flight和fVPD分别代表O3、物候、辐射和叶气水汽饱和差(Vapor Pressure Deficit,VPD)响应函数。公式(8)中涉及的参数和函数没有统一的数值和表达式,都是通过观测和经验模拟出来的。
由于O3进入气孔的阻力和气孔的开闭情况有关,而气孔的开闭与CO2吸收或作物蒸腾是密切相关的,所以,如果知道了CO2阻抗(RCO2)或水汽气孔阻抗(RH2O),O3气孔阻抗就可以用Rst=1.51RH2O或Rst=0.97RCO2来估算,其中常数(1.51或0.97)分别是水汽或CO2的分子扩散系数与O3的分子扩散系数之比[36, 37]。
作物群体RCO2可用机理模型或经验模型来估算。在缺乏对机理了解的情况下,经验或半经验模型常常用于描述气孔对环境因子和生理因子的响应。其中最常见的是以Jarvis的阶乘经验模型为基础[38],通过不断改进参数和模型表达式而得到的[19, 39]。这种模型的形式直观,但缺点是机理意义不明确。由于该模型涉及的变量很多,不同的作物有不同的参数和经验表达式,所以在实际应用时要根据具体情况选择应用。RCO2也可以用半经验模型(BB模型)来估算[40],即认为气孔导度与叶面相对湿度、CO2浓度和光合速率有关。该类模型通过改进也可得到不同的表达式[41]。
利用植物群体的蒸腾或蒸散模型(最常用的是Penman-Monteith模型)可以用来反推水汽的气孔阻抗RH2O[36]。由于用涡度相关等方法观测的是实际蒸散量(土壤蒸发+植物蒸腾),所以,在利用上述公式时,要通过其他的方法区分蒸发和蒸腾。该方法比较适合在作物完全覆盖的情况下应用(土壤蒸发可忽略不计)[42]。在获得Rns和Rst后,则可用如下公式来定量估算气孔吸收
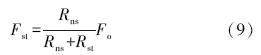
在利用OTC等开展控制试验中,如果不能直接测量O3总通量,可以用模拟方法计算O3的气孔吸收[43]。
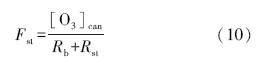
式中,[O3]can 为植株冠层高度处O3浓度,边界层阻抗Rb的可用如下公司估算:
式中,1.3为气孔对O3和热量的扩散率比值,150为边界层对热量的扩散阻力常数,L为叶片的特征尺寸(小麦可取值0.02 m)[16],u为冠层顶部风速(m/s)。Rst可用上面介绍的经验公式估算。
3 不同生态系统O3通量观测、气孔吸收估算及其风险评估欧美国家从20世纪70年代就开始在多种生态系统类型上开展O3通量的观测研究工作,部分研究还利用模型区分了气孔吸收和非气孔吸收[39, 44, 45, 46, 47]。由于沉积速度(Vd)消除O3浓度对通量的影响,所以通常用Vd来研究O3在不同生态系统上的沉积规律。Vd的变化在很大程度上受植被生理活性和气象因素的控制,不同下垫面的Vd存在很大的差异。一方面,有无植被覆盖可以使得Vd产生数量级的差别;另一方面,不同植被状况的平均Vd也有明显的不同,Vd还受环境条件等影响。对于基于O3通量的风险评估,主要集中在研究生物量或产量减少与O3剂量之间的关系上。由于O3通量观测和气孔吸收的估算存在很大的不确定性,基于O3气孔吸收的生态系统评估研究相对较少。现就不同生态系统,分别介绍有关Vd日季变化规律和主要影响因子,气孔吸收比例及其控制因子,以及基于气孔吸收的O3风险评估研究进展。
3.1 森林生态系统森林生态系统上Vd通常表现出明显的昼夜和季节周期的变化特点,其变化可以反映树木的生理反应和树木的物候状况。在北欧森林,冬季低温和休眠植被导致Vd很低且变化平稳 (Vd 为0.1 cm/s)。而在温带森林地区,则表现为中午微弱增强的日变化特点 (Vd 为0.5 cm/s),夏天Vd通常表现为对称的日变化规律(Vd 为0.7—0.9 cm/s)[47, 48]。在英格兰橡树林,夏天Vd的最大值却出现在8:00(Vd 为1.0 cm/s),然后以近似直线的方式降低直到夜间(Vd 为0.1 cm/s)[31]。Rummel 等[39]在亚马逊热带雨林上观测了O3通量的变化,发现Vd在雨季明显高于旱季。Altimir等[49]发现芬兰的欧洲赤松在秋季生理活性与Vd的相关性较差,认为Vd的平缓变化是叶片长期湿润影响的结果。
影响森林植被O3气孔吸收的因子有很多,不同森林生态系统气孔吸收所占比例也不一样。在意大利橡树林,沉积速度全年都很高,干热的气候条件可以显著影响Vd的日变化。该地区非气孔吸收起主导作用,冬季的气孔吸收比例比夏天高[50]。在地中海常绿阔叶林,气孔吸收其主导作用[51],而在美国加州的松林和脐橙园,却是非气孔吸收占主导地位[52, 53]。Turnipseed等[54]在美国科罗拉多亚高山带森林的观测发现,白天81%的O3通量是气孔吸收,光强和水汽饱和差(VPD)是影响O3沉积的主要控制因子,高VPD和温度会导致O3通量的减少。Kurpius等[55]分析了美国加州黄松林O3通量的季节变化规律,结果表明Fo与Vd的关系明显,O3对森林的严重损伤并非发生在O3浓度最高的时期,吸收比例会随着土壤水分状况和物候而改变,通量指标比浓度指标能更好地反应O3对森林的影响。
O3对森林影响的风险评估研究相对有限。Uddling等[13]通过研究O3对桦木的影响发现,生物量的减少与CUO5(高于5 nmol/m2s的O3累计吸收)的相关关系比与O3暴露指数SUM06或AOT40的关系更加显著。Karlsson等[56]用两种指标对欧洲森林进行了风险评估,结果发现AFst1.6比AOT40能更好地解释树木的生物量减少,叶子损伤程度也与气孔吸收的关系更加密切。Emberson等[57]用两种指标(AOT40和AFstY)分别对欧洲的松树、山毛榉和橡树进行了风险评估,结果表明:基于AOT40的模型呈现出明显的南北差异,而基于AFstY模型的地区差异很小。对不同树种则利用AFstY得到的评估模型差别很大,意味着不同品种应该利用不同的响应变量。
3.2 农田生态系统在作物的不同物候阶段,Vd的数值大小和日季变化规律呈现明显的不同特点。例如在意大利小麦和大麦地[58],Vd在白天都呈现上下午对称的日变化规律,在光合作用最强烈的正午,Vd可达0.7 —0.9 cm/s。而在生长后期正午的沉积速度明显降低,导致日最大值出现在上午而使得日变化曲线在上午变得非常陡峭。从季节变化规律看,从开花到灌浆期间Vd达到最大,因为这个时期光合作用最强,气孔的打开进行光合作用的同时,O3也容易进入到气孔。随后由于作物叶片衰老,沉积速度逐渐减小。Michou等[59]在生长旺期的玉米观测了O3通量,Vd也呈现上下午对称的日变化,最高和最低的Vd分别为0.5 cm/s和0.05 cm/s。而在叶片衰老期,上午的Vd只有0.2 cm/s左右。而在大豆地,Vd似乎更低,即使在活跃生长期最大值只有1 cm/s[60]。马铃薯生长旺期Vd表现为不对称的日变化特征,Vd白天在0.5—2 cm/s变化,中值为0.6 cm/s,而夜间Vd只有0.4 cm/s或更低[61]。朱治林等[62]利用涡度相关方法在鲁西北平原观测了夏玉米地O3沉积通量。结果表明白天和夜间的Vd平均值分别为0.29 cm/s 和0.09 cm/s,白天Vd的大小受作物生长期的影响。
不同作物在不同生长期的气孔吸收所占总通量的比例是不同的。在意大利小麦、大麦和洋葱生长旺期,气孔吸收比例也不会高于50%—60%,并且比例在衰老过程中逐步减少[42, 50, 58]。然而在土豆地,生长旺期气孔吸收比例占85%左右,而在成熟期其比例减少到20%左右[61]。Lamaud等[46]观测了玉米地O3通量并用大叶模型区分了气孔吸收和非气孔吸收,NO与O3的化学反应对O3的分解起了很重要的作用,而气孔吸收比例会随着生育期和气象条件而出现很大的变异。朱治林等[62]通过比较白天和晚上Vd的差别,推断白天的气孔吸收是玉米地上大气O3主要的汇。
Pleijel 等[10]比较了欧洲小麦和土豆产量与基于浓度和基于通量指数之间的关系,两种作物的相对产量与CUO5的相关关系都比暴露指标(AOT40)要强,两种农田的非气孔吸收所占比例也非常小。Mills等[6]收集和分析了欧洲17个国家在近20年关于O3对作物和半自然植被影响的文章、报告和区域模拟图等,总体来看,欧洲大部分地区利用基于O3通量的风险预告比基于O3浓度的预告结果要好,也为O3通量的风险评估验证提供了重要的证据。Feng等[19]通过改进欧洲的气孔估算模型得到了中国亚热带冬小麦O3通量—产量响应关系,并得出结论认为改进的响应模型可以更好地应用于该地区的风险评估。佟磊等[43, 63] 利用田间原位OTC设置不同浓度O3处理方法开展了相关研究。通过比较华北地区小麦的O3暴露-产量关系和O3剂量-产量关系,两者都存在很好的相关关系。通过研究我国珠三角地区水稻产量损失与O3暴露指标(AOT40和SUM06)和O3吸收量(AFst2)的关系发现,累积气孔吸收与水稻产量的相关性(R2=0.63)明显高于与O3浓度指标(AOT40和SUM06)的相关性(R2值分别为0.49和0.51),表明基于气孔通量的O3风险评价指标能更好地反映水稻产量的变化。
3.3 其他生态系统草地上的O3通量观测研究比较少,其变化规律和农田很类似。在生长旺期Vd的日变化都是对称的,且上升和下降过程都很平稳。白天平均的Vd可达0.5 cm/s左右,最大可达到1 cm/s,夜间为0.2 cm/s左右且变化平稳。在冬季休眠期和干旱草原生长期,Vd的日变化过程非常不明显,平均的Vd也只有0.2—0.3 cm/s左右[31]。Sorimachi等[64]用梯度法在北京郊区矮草地上观测了O3通量,夏末和冬前的平均Vd分别为(0.2 ± 0.2)cm/s和(0.4 ± 0.3)cm/s。Padro[65]用涡度相关方法得到了葡萄园、棉花地和草地白天的平均Vd分别为0.5、0.8、和0.2 cm/s,夜间平均为0.2 cm/s 左右,草地在枯死阶段或夜间Vd只有0.05 cm/s 左右。草原的非气孔吸收并非一个常数,会受到表面湿润状况,表面温度、太阳辐射和风速的影响,其比例可达到60%左右[31]。在非生物覆盖下垫面,由于没有植物的气孔吸收,Vd的平均值比有植被的下垫面要小很多。例如在裸露的土壤,Vd在0.1—1 cm/s间变化。水体上平均Vd小于0.01 cm/s,而雪面上Vd平均值也只有0.1 cm/s且有很大的变异性[24]。
4 我国的研究现状和展望在田间控制试验方面,我国科学家利用OTC和FACE(Free Air gas Concentration Enrichment)方法研究了高浓度O3对作物组织伤害、对光合作用和产量等的影响,并得到了一些产量损失评估模型[66, 67, 68, 69, 70, 71, 72, 73]。虽然这些模型大都是基于O3暴露指标,也开始建立基于气孔O3通量的评估模型[19, 43, 63, 67]。相对而言,O3对生态系统和区域尺度的风险评估研究还比较薄弱,且大多是基于O3浓度的风险评估[11, 74]。例如,Aunan等研究表明,不断增加的O3浓度可能会持续影响中国的作物产量[9]。Wang等[8]通过调查中国近地层O3浓度分布发现,我国许多地区近地层O3浓度超过了对产量影响的临界值。姚芳芳等[68]利用改进的OTC设备,建立了长江三角洲地区O3与水稻、冬小麦和油菜的产量—AOT40响应函数,并对该地区作物产量损失进行了综合估算。结果表明:3种作物的O3临界水平值不同(冬小麦对O3最敏感),该地区O3水平(2003年)可导致水稻、冬小麦和油菜分别减产3.04%、17.08%和5.92%。朱治林等[75]在鲁西北平原连续观测了冬小麦地O3浓度的变化并分析了其与作物光合作用之间的关系,利用国外的评估模型得到该地区目前的O3浓度水平使得冬小麦产量减少5.2% — 8.8%。
我国在生态系统尺度上O3通量的观测研究方面与欧美一些国家的研究水平存在较大差距,但相关的研究已开始起步[63]。今后,在田间控制试验研究方面,除了继续利用OTC等设备研究O3浓度升高对不同地区和不同作物的影响并建立基于O3浓度的评估模型外,在有条件的情况下,可针对不同地区不同作物更多地开展基于O3通量的评估模型研究,为更科学地评估O3对生态系统的影响提供依据。在生态系统尺度上,应逐步在更多生态系统类型上开展O3浓度和通量的观测以及气孔吸收的模拟估算研究。就O3通量观测方法而言,在缺乏先进的涡度相关仪器的情况下,利用一些“准涡度相关”方法或多层梯度法开展研究是一种切实可行的选择。
| [1] | Crutzen P J, Lawrence M G, Pöschl U. On the background photochemistry of tropospheric ozone. Tellus B, 1999, 51(1): 123-146. |
| [2] | Fuhrer J, Grimm A G, Tschannen W, Shariatmadari H. The response of Spring Wheat (Triticum-Aestivum L.) to ozone at higher elevations 2. changes in yield, yield components and grain quality in response to ozone flux. New Phytologist, 1992, 121(2): 211-219. |
| [3] | Mills G, Buse A, Gimeno B, Bermejo V, Holland M, Emberson L, Pleijel H. A synthesis of AOT40-based response functions and critical levels of ozone for agricultural and horticultural crops. Atmospheric Environment, 2007, 41(12): 2630-2643. |
| [4] | Pleijel H, Danielsson H, Emberson L, Ashmore M R, Mills G. Ozone risk assessment for agricultural crops in Europe: Further development of stomatal flux and flux-response relationships for European wheat and potato. Atmospheric Environment, 2007, 41(14): 3022-3040. |
| [5] | Feng Z, Kobayashi K, Ainsworth E A. Impact of elevated ozone concentration on growth, physiology, and yield of wheat (Triticum aestivum L.): a meta-analysis. Global Change Biology, 2008, 14(11): 2696-2708. |
| [6] | Mills G, Hayes F, Simpson D, Emberson L, Norris D, Harmens H, Büker P. Evidence of widespread effects of ozone on crops and (semi-) natural vegetation in Europe (1990-2006) in relation to AOT40-and flux-based risk maps. Global Change Biology, 2011, 17(1): 592-613. |
| [7] | Vingarzan R. A review of surface ozone background levels and trends. Atmospheric Environment, 2004, 38(21): 3431-3442. |
| [8] | Wang X K, Manning W, Feng Z W, Zhu Y G. Ground-level ozone in China: distribution and effects on crop yields. Environmental Pollution, 2007, 147(2): 394-400. |
| [9] | Aunan K, Berntsen T K, Seip H M. Surface ozone in China and its possible impact on agricultural crop yields. AMBIO: A Journal of the Human Environment, 2000, 29(6): 294-301. |
| [10] | Pleijel H, Danielsson H, Ojanperä K, Temmerman L D, Högy P, Badiani M, Karlsson P E. Relationships between ozone exposure and yield loss in European wheat and potato-a comparison of concentration-and flux-based exposure indices. Atmospheric Environment, 2004, 38(15): 2259-2269. |
| [11] | Liang J, Zeng Q, Zhu J G, Xie Z B, Liu G, Tang H Y. Review of indexes for evaluating plant response to elevated near-surface ozone concentration. Chinese Journal of Eco-Agriculture, 2010, 18(2): 440-445. |
| [12] | Paoletti E, Manning W J. Toward a biologically significant and usable standard for ozone that will also protect plants. Environmental Pollution, 2007, 150(1): 85-95. |
| [13] | Uddling J, Günthardt-Goerg M S, Matyssek R, Oksanen E, Pleijel H, Selldén G, Karlsson P E. Biomass reduction of juvenile birch is more strongly related to stomatal uptake of ozone than to indices based on external exposure. Atmospheric Environment, 2004, 38(28): 4709-4719. |
| [14] | Musselman R, Lefohn A, Massman W, Heath R. A critical review and analysis of the use of exposure-and flux-based ozone indices for predicting vegetation effects. Atmospheric Environment, 2006, 40(10): 1869-1888. |
| [15] | Mills G, Pleijel H, Braun S, Bueker P, Bermejo V, Calvo E, Danielsson H, Emberson L, Gonzalez-Fernandez I, Gruenhage L, Harmens H, Hayes F, Karlsson P, Simpson D. New stomatal flux-based critical levels for ozone effects on vegetation. Atmospheric Environment, 2011, 45(28): 5064-5068. |
| [16] | Mills G. Mapping critical levels for vegetation. In: Mapping Manual 2004, UNECE Convention on Long-Range Transboundary Air Pollution. Berlin, 2004. |
| [17] | Hogg A, Uddling J, Ellsworth D, Carroll M A, Pressley S, Lamb B, Vogel C. Stomatal and non-stomatal fluxes of ozone to a northern mixed hardwood forest. Tellus Series B-Chemical and Physical Meteorology, 2007, 59(3): 514-525. |
| [18] | Danielsson H, Karlsson G P, Karlsson P E, Pleijel H. Ozone uptake modelling and flux-response relationships-an assessment of ozone-induced yield loss in spring wheat. Atmospheric Environment, 2003, 37(4): 475-485. |
| [19] | Feng Z Z, Tang H Y, Uddling J, Pleijel H, Kobayashi K, Zhu J G, Oue H, Guo W S. A stomatal ozone flux-response relationship to assess ozone-induced yield loss of winter wheat in subtropical China. Environmental Pollution, 2012, 164(5): 16-23. |
| [20] | Fuhrer J, Skärby L, Ashmore M R. Critical levels for ozone effects on vegetation in Europe. Environmental Pollution, 1997, 97(1): 91-106. |
| [21] | Wang C Y, Bai Y M. Study on the Impacts of Ozone and Aerosol Concentrations Changes on Crops. Beijing: Chinese Meteorological Press, 2007: 41-42. |
| [22] | Grünhage L, Hänel H D, Jäger H J. The exchange of ozone between vegetation and atmosphere: micrometeorological measurement techniques and models. Environmental Pollution, 2000, 109(3): 373-392. |
| [23] | Baldocchi D. Assessing the eddy covariance technique for evaluating carbon dioxide exchange rates of ecosystems: past, present and future. Global Change Biology, 2003, 9(4): 479-492. |
| [24] | Wesely M L, Hicks B B. A review of the current status of knowledge on dry deposition. Atmospheric Environment, 2000, 34(12): 2261-2282. |
| [25] | Güsten H, Heinrich G, Schmidt R W H, Schurath U. A novel ozone sensor for direct eddy flux measurements. Journal of Atmospheric Chemistry, 1992, 14(1/4): 73-84. |
| [26] | Muller J B A, Percival C J, Gallagher M W, Fowler D, Coyle M, Nemitz E. Sources of uncertainty in eddy covariance ozone flux measurements made by dry chemiluminescence fast response analysers. Atmospheric Measurement Techniques, 2010, 3(1): 163-176. |
| [27] | Baldocchi D D, Hicks B B, Meyers T P. Measuring biosphere-atmosphere exchanges of biologically related gases with micrometeorological methods. Ecology, 1988, 69(5): 1331-40. |
| [28] | Wohlfahrt G, Hörtnagl L, Hammerle A, Graus M, Hansel A. Measuring eddy covariance fluxes of ozone with a slow-response analyser. Atmospheric Environment, 2009, 43(30): 4570-4576. |
| [29] | Hörtnagl L, Clement R, Graus M, Hammerle A, Hansel A, Wohlfahrt G. Dealing with disjunct concentration measurements in eddy covariance applications: A comparison of available approaches. Atmospheric Environment, 2010, 44(16): 2024-2032. |
| [30] | Tong L, Wang X K, Geng C M, Wang W, Lu F, Song W, Liu H J, Yin B H, Sui L H, Wang Q. Diurnal and phenological variations of O3 and CO2 fluxes of rice canopy exposed to different O3 concentrations. Atmospheric Environment, 2011, 45(31): 5621-5631. |
| [31] | Fowler D, Pilegaard K, Sutton M A, Ambus P, Raivonen M, Duyzer J, Simpson D, Fagerli H, Fuzzi S, Schjoerring J K, Granier C, Neftel A, Isaksen I S A, Laj P, Maione M, Monks P S, Burkhardt J, Daemmgen U, Neirynck J, Personne E, Wichink-Kruit R, Butterbach-Bahl K, Flechard C, Tuovinen J P, Coyle M, Gerosa G, Loubet B, Altimir N, Gruenhage L, Ammann C, Cieslik S, Paoletti E, Mikkelsen T N, Ro-Poulsen H, Cellier P, Cape J N, Horvath L, Loreto F, Niinemets U, Palmer P I, Rinne J, Misztal P, Nemitz E, Nilsson D, Pryor S, Gallagher M, W, Vesala T, Skiba U, Brueggemann N, Zechmeister-Boltenstern S, Williams J, O'Dowd C, Facchini M C, de Leeuw G, Flossman A, Chaumerliac N, Erisman J W. Atmospheric composition change: Ecosystems-Atmosphere interactions. Atmospheric Environment, 2009, 43(33): 5193-5267. |
| [32] | Lamaud E, Carrara A, Brunet Y, Lopez A, Druilhet A. Ozone fluxes above and within a pine forest canopy in dry and wet conditions. Atmospheric Environment, 2002, 36(1): 77-88. |
| [33] | Baldocchi D, Hicks B, Camara P. A canopy stomatal resistance model for gaseous deposition to vegetated surfaces. Atmospheric Environment, 1987, 21(1): 91-101. |
| [34] | Erisman J W, Van Pul A, Wyers P. Parametrization of surface resistance for the quantification of atmospheric deposition of acidifying pollutants and ozone. Atmospheric Environment, 1994, 28(16): 2595-2607. |
| [35] | Stella P, Loubet B, Lamaud E, Laville P, Cellier P. Ozone deposition onto bare soil: A new parameterisation. Agricultural and Forest Meteorology, 2011, 151(6): 669-681. |
| [36] | Gerosa G, Derghi F, Cieslik S. Comparison of different algorithms for stomatal ozone flux determination from micrometeorological measurements. Water, Air, and Soil Pollution, 2007, 179(1/4): 309-321. |
| [37] | Massman W J. A review of the molecular diffusivities of H2O, CO2, CH4, CO, O3, SO2, NH3, N2O, NO, and NO2 in air, O2 and N2 near STP. Atmospheric Environment, 1998, 32(6): 1111-1127. |
| [38] | Jarvis P G. The interpretation of the variations in leaf water potential and stomatal conductance found in canopies in the field. Philosophical Transactions of the Royal Society of London B, Biological Sciences, 1976, 273(1): 593-610. |
| [39] | Rummel U, Ammann C, Kirkman G A, Moura M A L, Foken T, Andreae M O, Meixner, F X. Seasonal variation of ozone deposition to a tropical rain forest in southwest Amazonia. Atmospheric Chemistry and Physics, 2007, 7(20): 5415-5435. |
| [40] | Ball J. A model predicting stomatal conductance and its contribution to the control of photosynthesis under different environmental conditions // Progress of Photosynthesis Research. Netherlands: Springer, 1987: 221-224. |
| [41] | Leuning R. A critical-appraisal of a combined stomatal-photosynthesis model for C3 plants. Plant Cell and Environment, 1995, 18(4): 339-355. |
| [42] | Gerosa G, Cieslik S, Ballarin-Denti A. Micrometeorological determination of time-integrated stomatal ozone fluxes over wheat: a case study in Northern Italy. Atmospheric Environment, 2003, 37(6): 777-788. |
| [43] | Tong L, Feng Z W, Sudebilige, Wang Q, Geng C M, Lu F, Wang W, Yin B H, Sui L H, Hou P Q, Wang X K. Stomatal ozone uptake modeling and comparative analysis of flux-response relationships of winter wheat. Acta Ecologica Sinica, 2012, 32(9): 2890-2899. |
| [44] | Wesely M, Eastman J, Cook D, Hicks B. Daytime variations of ozone eddy fluxes to maize. Boundary-Layer Meteorology, 1978, 15(3): 361-373. |
| [45] | Fuentes J D, Gillespie T J, Denhartog G, Neumann H H. Ozone deposition onto a deciduous forest during dry and wet conditions. Agricultural and Forest Meteorology, 1992, 62(1): 1-18. |
| [46] | Lamaud E, Loubet B, Irvine M, Stella P, Personne E, Cellier P. Partitioning of ozone deposition over a developed maize crop between stomatal and non-stomatal uptakes, using eddy-covariance flux measurements and modelling. Agricultural and Forest Meteorology, 2009, 149(9): 1385-1396. |
| [47] | Keronen P, Reissell A, Rannik U, Pohja T, Siivola E, Hiltunen V, Hari P, Kulmala M, Vesala T. Ozone flux measurements over a scots pine forest using eddy covariance method: performance evaluation and comparison with flux-profile method. Boreal Environmental Research, 2003, 8(4): 425-444. |
| [48] | Mikkelsen T N, Ro-Poulsen H, Hovmand M F, Jensen N O, Pilegaard K, Egeløv A H. Five-year measurements of ozone fluxes to a Danish Norway spruce canopy. Atmospheric Environment, 2004, 38(15): 2361-2371. |
| [49] | Altimir N, Kolari P, Tuovinen J P, Vesala T, Back J, Suni T, Kulmala M, Hari P. Foliage surface ozone deposition: a role for surface moisture? Biogeosciences 2006, 3(2): 209-228. |
| [50] | Cieslik S. Ozone fluxes over various plant ecosystems in Italy: a review. Environmental Pollution, 2009, 157(5): 1487-1496. |
| [51] | Gerosa G, Vitale M, Finco A, Manes F, Denti A, Cieslik S. Ozone uptake by an evergreen Mediterranean Forest in Italy. Part I: Micrometeorological flux measurements and flux partitioning. Atmospheric Environment, 2005, 39(18): 3255-3266. |
| [52] | Fares S, McKay M, Holzinger R, Goldstein A H. Ozone fluxes in a Pinus ponderosa ecosystem are dominated by non-stomatal processes: Evidence from long-term continuous measurements. Agricultural and Forest Meteorology, 2010, 150(3): 420-431. |
| [53] | Fares S, Weber R, Park J H, Gentner D, Karlik J, Goldstein A H. Ozone deposition to an orange orchard: Partitioning between stomatal and non-stomatal sinks. Environmental Pollution, 2012, 169(1): 258-266. |
| [54] | Turnipseed A A, Burns S P, Moore D J, Hu J, Guenther A B, Monson R K. Controls over ozone deposition to a high elevation subalpine forest. Agricultural and Forest Meteorology, 2009, 149(9): 1447-1459. |
| [55] | Kurpius M R, McKay M, Goldstein A H. Annual ozone deposition to a Sierra Nevada ponderosa pine plantation. Atmospheric Environment, 2002, 36(28): 4503-4515. |
| [56] | Karlsson P, Braun S, Broadmeadow M, Elvira S, Emberson L, Gimeno B S, Le Thiec D, Novak K, Oksanen E, Schaub M, Uddling J, Wilkinson M. Risk assessments for forest trees: The performance of the ozone flux versus the AOT concepts. Environmental Pollution, 2007, 146(3): 608-616. |
| [57] | Emberson L D, Buker P, Ashmore M R. Assessing the risk caused by ground level ozone to European forest trees: A case study in pine, beech and oak across different climate regions. Environmental Pollution, 2007, 147(3): 454-466. |
| [58] | Gerosa G, Marzuoli R, Cieslik S, Ballarin-Denti A. Stomatal ozone fluxes over a barley field in Italy. "Effective exposure" as a possible link between exposure-and flux-based approaches. Atmospheric Environment, 2004, 38(15): 2421-2432. |
| [59] | Michou M, Laville P, Serça D, Fotiadi A, Bouchou P, Peuch V H. Measured and modeled dry deposition velocities over the ESCOMPTE area. Atmospheric Research, 2005, 74(1): 89-116. |
| [60] | Meyers T P, Finkelstein P, Clarke J, Ellestad T G, Sims P F. A multilayer model for inferring dry deposition using standard meteorological measurements. Journal of Geophysical Research, 1998, 103(D17): 22645-22661. |
| [61] | Coyle M, Nemitz E, Storeton-West R, Fowler D, Cape J N. Measurements of ozone deposition to a potato canopy. Agricultural and Forest Meteorology, 2009, 149(3): 655-666. |
| [62] | Zhu Z L, Sun X M, Dong Y S, Zhao F H, Meixner F X. Diurnal variation of ozone flux over corn field in Northwestern Shandong Plain of China. Science China: Earth Sciences, 2014, 57(3): 503-511. |
| [63] | Tong L, Wang X K, Sudebilige, Wang Q, Geng C M, Wang W, Song W Z, Lu F, Liu H J, Yin B H, Sui L H, Feng Z W. Stomatal ozone uptake modeling and comparative analysis of Flux-response relationships of rice. Journal of Agro-Environment Science, 2011, 30(10): 1930-1938. |
| [64] | Sorimachi A, Sakamoto K, Ishihara H, Fukuyama T, Utiyama M, Wang W, Tang D G, Dong X H, Quan H. Measurements of sulfur dioxide and ozone dry deposition over short vegetation in northern China-A preliminary study. Atmospheric Environment, 2003, 37(22): 3157-3166. |
| [65] | Padro J. Summary of ozone dry deposition velocity measurements and model estimates over vineyard, cotton, grass and deciduous forest in summer. Atmospheric Environment, 1996, 30(13): 2363-2369. |
| [66] | Zheng Y F, Hu C D, Wu R J, Zhao Z, Liu H J, Shi C H. Experiment with effects of increased surface ozone concentration upon winter wheat photosynthesis. Acta Ecologica Sinica, 2010, 30(4): 847-856. |
| [67] | Wu R J, Zheng Y F, Zhao Z, Hu C D, Wang L X. Assessment of loss of accumulated dry matter in winter wheat based on stomatal conductance and ozone uptake model. Acta Ecologica Sinica, 2010, 30(11): 2799-2808. |
| [68] | Yao F F, Wang X K, Chen Z, Feng Z Z, Zheng Q W, Duan X N, Ouyang Z Y, Feng Z W. Response of photosynthesis, growth and yield of field-grown winter wheat to ozone exposure. Chinese Journal of Plant Ecology, 2008, 32(1): 212-219. |
| [69] | Jin M H, Feng Z W, Zhang F Z. Impacts of ozone on the biomass and yield of rice in open-top chambers. Journal of Environmental Sciences, 2001, 13(2): 232-236. |
| [70] | Chen J, Zeng Q, Zhu J G, Liu G, Cao J L, Xie Z B, Tang H Y, Kazuhiko K. Nitrogen supply mitigates the effects of elevated on photosynthesis and yield in wheat. Chinese Journal of Plant Ecology, 2011, 35(5): 523-530. |
| [71] | Feng Z W, Jin M H, Zhang F Z, Huang Y Z. Effects of ground-level ozone (O3) pollution on the yields of rice and winter wheat in the Yangtze River Delta. Journal of Environmental Sciences, 2003, 15(3): 360-362. |
| [72] | Wang X K, Zhang Q Q, Zheng F X, Zheng Q W, Yao F F, Chen Z, Zhang W W, Hou P Q, Feng Z Z, Song W Z, Feng Z W, Lu, F. Effects of elevated O3 concentration on winter wheat and rice yields in the Yangtze River Delta, China. Environmental Pollution, 2012, 171(12): 118-125. |
| [73] | Wang Y X, Wang X Y, Yang L X, Li P L, Zhu J G, Kobayashi K, Wang Y L. Ozone stress increases lodging risk of rice cultivar Liangyoupeijiu: a FACE study. Acta Ecologica Sinica, 2011, 31(20): 6098-6107. |
| [74] | Xu H, Yang J C, Chen S B, Jiang G M, Li Y G. Review of plant responses to ozone pollution. Chinese Journal of Plant Ecology, 2007, 31(6): 1205-1213. |
| [75] | Zhu Z L, Sun X M, Zhao F H, Wen X F, Tang X Z, Yuan G F. Variation of ozone concentration of winter wheat field and mechanistic analysis of its possible effect on wheat yield in Northwest-Shandong Plain of China. Chinese Journal of Plant Ecology, 2012, 36(4): 313-323. |
| [11] | 梁晶, 曾青, 朱建国, 谢祖彬, 刘钢, 唐昊冶. 植物对近地层高浓度臭氧响应的评价指标研究进展. 中国生态农业学报, 2010, 18(2): 440-445. |
| [21] | 王春乙, 白月明. 臭氧和气溶胶浓度变化对农作物的影响研究. 北京: 气象出版社, 2007: 41-42. |
| [43] | 佟磊, 冯宗炜, 苏德·毕力格, 王琼, 耿春梅, 逯非, 王玮, 殷宝辉, 隋立华, 侯培强, 王效科. 冬小麦气孔臭氧通量拟合及通量产量关系的比较分析. 生态学报, 2012, 32(9): 2890-2899. |
| [62] | 朱治林, 孙晓敏, 董云社, 赵风华, Franz X Meixner. 鲁西北平原玉米地涡度相关臭氧通量日变化特征. 中国科学: 地球科学, 2014, 44(2): 292-301. |
| [63] | 佟磊, 王效科, 苏德·毕力格, 王琼, 耿春梅, 王玮, 宋文质, 逯非, 刘红杰, 殷宝辉, 隋立华, 冯宗炜. 水稻气孔臭氧通量拟合及通量与产量关系的比较分析. 农业环境科学学报, 2011, 30(10): 1930-1938. |
| [66] | 郑有飞, 胡程达, 吴荣军, 赵泽, 刘宏举, 石春红. 地表臭氧浓度增加对冬小麦光合作用的影响. 生态学报, 2010, 30(4): 847-856. |
| [67] | 吴荣军, 郑有飞, 赵泽, 胡程达, 王连喜. 基于气孔导度和臭氧吸收模型的冬小麦干物质累积损失评估. 生态学报, 2010, 30(11): 2799-2808. |
| [68] | 姚芳芳, 王效科, 陈展, 冯兆忠, 郑启伟, 段晓男, 欧阳志云, 冯宗炜. 农田冬小麦生长和产量对臭氧动态暴露的响应. 植物生态学报, 2008, 32(1): 212-219. |
| [70] | 陈娟, 曾青, 朱建国, 刘钢, 曹际玲, 谢祖彬, 唐昊冶, 小林和彦. 施氮肥缓解臭氧对小麦光合作用和产量的影响. 植物生态学报, 2011, 35(5): 523-530. |
| [73] | 王云霞, 王晓莹, 杨连新, 李潘林, 朱建国, Kobayashi K, 王余龙. 臭氧胁迫使两优培九倒伏风险增加——FACE研究. 生态学报, 2011, 31(20): 6098-6107. |
| [74] | 许宏, 杨景成, 陈圣宾, 蒋高明, 李永庚. 植物的臭氧污染胁迫效应研究进展. 植物生态学报, 2007, 31(6): 1205-1213. |
| [75] | 朱治林, 孙晓敏, 赵风华, 温学发, 唐新斋, 袁国富. 鲁西北平原冬小麦田臭氧浓度变化特征及对产量的潜在影响和机理分析. 植物生态学报, 2012, 36(4): 313-323. |