 2014, Vol. 34
文章信息
- 单秀娟, 陈云龙, 戴芳群, 金显仕, 杨顶田
- SHAN Xiujuan, CHEN Yunlong, DAI Fangqun, JIN Xianshi, YANG Dingtian
- 黄海中南部不同断面鱼类群落结构及其多样性
- Variations in fish community structure and diversity in the sections of the central and southern Yellow Sea
- 生态学报, 2014, 34(2): 377-389
- Acta Ecologica Sinica, 2014, 34(2): 377-389
- http://dx.doi.org/10.5846/stxb201301110084
-
文章历史
- 收稿日期:2013-1-11
- 修订日期:2013-8-20


2. 中国海洋大学 水产学院, 青岛 266003;
3. 中国科学院南海海洋研究所 热带海洋环境国家重点实验室, 广州 510301
2. College of Fisheries, Ocean University of China, Qingdao 266003, China;
3. State Key Laboratory of Oceanography in the Tropics, South China Sea Institute of Oceanology, Chinese Academy of Sciences, Guangzhou 510301, China
鱼类是渔业生态系统的重要组成部分,也是渔业最基本的生产对象和人类食物的重要来源。在渔业生态系统中,鱼类群落是空间尺度的重要生态单元,一定程度上反映了生态系统的能量流动和物质转换,因此,鱼类群落多样性是维持渔业生态系统平衡和保证渔业持续健康发展的重要基础。目前,世界各海域鱼类群落多样性正遭受到多方面威胁,在国际上已引起广泛关注。如渔业生态环境污染严重[1, 2]、过度捕捞[3, 4, 5, 6]及全球气候变化的加剧均引起渔业生态系统多样性受损并殃及生物多样性水平下降[7, 8, 9]。我国学者对海洋鱼类群落多样性开展了广泛研究,主要集中于河口[10, 11, 12, 13, 14, 15]、海湾[16]及沿岸水域[3, 4, 17]。黄海中南部由于复杂的地形、底质及黄海冷水团、沿岸流、黄海暖流等交互影响,形成了生境差异较大的不同断面,造成了黄海中南部鱼类群落不同的生物地理分布格局[18]。目前,关于这些不同断面鱼类组成差异及其影响因素的相关研究尚未见报道。因此,本研究基于对黄海中南部不同断面渔业调查的基础上,对黄海中南部不同断面的鱼类群落结构、多样性、单位时间的渔获量分布及其相关环境因子进行了初步分析,以期为黄海中南部鱼类多样性保护及资源的科学管理提供基础数据。
1 材料与方法 1.1 材料来源和处理材料取自2006年9月和12月、2007年3月和5月对黄海中南部3个不同断面进行的底拖网调查,调查区域为120.5°—124°E,32°—36.5°N (图 1),其中S1断面位于南黄海北部,S3断面位于黄海中部,S1和S3断面是夏季贯穿黄海冷水团断面,S2断面位于黄海和东海交界处,是黄海和东海物质和能量交换的锋面。“北斗”号渔业调查船的网具参数为:网具网目836目×20 cm,网口周长167.2 m,网具总长度83.2 m,囊网网目2.4 cm,拖速为3 kn。每站拖网1 h,仅对渔获鱼类进行种类鉴定,记录每一种的单位时间的渔获尾数(尾/h)和单位时间的渔获量(kg/h),现场同步用SBE-19 Seacat profiler 型CTD测定了水深、温度和盐度等环境因子的数据。

|
| 图 1 黄海中南部不同断面的调查站位 Fig.1 Sampling stations in the sections of the central and southern Yellow Sea |
用Bray-Curtis相似性指数[19]计算各月份间鱼类组成的差异,分析黄海断面鱼类资源随时间变化的特征。
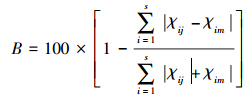
式中,χij,χim分别为第i个种类在第j个月份和第m个月份的单位时间的渔获量(经过2次平方根转换),S为种类数。
1.3 群落多样性本文在研究中采用了如下公式对鱼类群落的多样性进行分析研究:
Shannon-Weaver 多样性指标[20]:

Margalef 种类丰度指标[21]:
D=(S-1)/lnN
Pielou均匀度指标[22]:
J =H′/ lnS
式中,S为种类数,N为渔获总重量,Pi为第i种渔获物重量占总渔获物重量的比例。
1.4 相对重要性指数采用Pianka[23]的相对重要性指数(Index of relative importance,IRI)作为鱼类优势度的指标:
IRI = (N% + W%) × F
式中,N%和W%分别是每种鱼类占所捕总量的个体数量百分比和个体重量百分比,F是出现频率,即某一种出现的站数占所有采样站中百分比。其中IRI值大于1000时为优势种,100—1000为常见种,常见种与优势种一起合称为重要鱼种成分[14]。
1.5 个体长度谱和群落营养结构根据每种鱼类的总重量和总尾数,计算平均个体重量,将个体平均重量(假设W = 0.01L3)转换成平均长度,然后将该种类的每小时网获尾数分配到相应的长度组中[24]。以长度组平均每网每小时渔获总尾数加1修正后的常用对数(log10)作纵坐标(渔获总尾数加1避免了某长度组个体数出现零尾数),以长度组作横坐标,作两者的关系图。
渔获种类营养级分析参照张波[25],然后将该种类的每小时网获尾数分配到相应的营养级组中,以每个营养级组平均每小时渔获总尾数加1修正后的常用对数作纵坐标(渔获总尾数加1避免了某营养级组出现零个体数),以营养级范围作横坐标,作两者关系图。
1.6 数理统计数据作图所采用的软件为Microsoft Excel,多样性参数通过Primer v5[26]完成,鱼类群落结构及多样性参数与环境因子的相关性分析通过SPSS16.0完成。
2 结果 2.1 种类组成2 006年9月到2007年5月黄海中南部各断面调查共捕获鱼类109 种,隶属于16 目、57科、86 属,其中鲈形目鱼类是主要类群,45 种(占40.18%),其次是鲉形目12 种(占10.71%),鲱形目10 种(占8.93%),鲽形目10 种(占8.93%),鲀形目5 种(占4.46%),鳕形目5 种(占4.46%),其他各目种类均小于5 种。2006年9月种类最多,为77种,其次为2007年3月76 种,2006年12月63 种,2007年5月种类最少,仅51 种。
根据鱼类生长和繁殖的适温特性鱼类可划分为暖温种、暖水种、冷温种和冷水种[27],黄海中南部各断面鱼类以暖温种和暖水种为主,仅少量冷温种。其中暖温种主要包括蓝圆鲹Decapterus maruadsi、六丝矛尾虾虎鱼Chaeturichthys hexanema、黄鮟鱇Lophius litulon、小黄鱼Larimichthys polyactis、竹筴鱼Trachurus japonicus等;暖水种主要包括鳀Engraulis japonicus、凤鲚Coilia mystus、黄鲫Setipinna taty、带鱼Trichiurus lepturus、银鲳Pampus argenteus、鳄齿鱼Champsodon capensis、龙头鱼Psenopsis anomala等;冷温种主要包括细纹狮子鱼Liparis tanakai、角木叶鲽Pleuronichthys cornutus等。黄海中南部各生态类型的种类数随断面不同有所变化,如暖温种在S2断面种类数要远大于S1和S3断面,暖水种种类数在S1和S2断面相差不大,但大于S3断面,冷温种在各断面的种类数相对比较均衡(表 1)。
| 年-月 Year-month | 暖温种 Warm temperate species | 暖水种 Warm water species | 冷温种 Cold water species | ||||||
| S1 | S2 | S3 | S1 | S2 | S3 | S1 | S2 | S3 | |
| S:断面 | |||||||||
| 2006-09 | 20 | 34 | 23 | 10 | 11 | 6 | 5 | 4 | 6 |
| 2006-12 | 23 | 27 | 17 | 16 | 10 | 6 | 4 | 7 | 2 |
| 2007-03 | 22 | 21 | 17 | 9 | 9 | 7 | 2 | 8 | 3 |
| 2007-05 | 13 | 21 | 14 | 7 | 9 | 5 | 3 | 2 | 3 |
2006年9月优势种是小黄鱼和鳀,占总渔获量的29.28%,细纹狮子鱼和黄鮟鱇也在总渔获量中占有较大的比重;2006年12月优势种是鳀,占总渔获量的15.22%,黄鮟鱇在总渔获量中占24.94%;2007年3月优势种是黄鲫、尖海龙、鳀,占总渔获量的24.80%,但鲐在总渔获量中的比例高达51.50%;2007年5月优势种为鳀,占总渔获量的72.61%,黄鮟鱇渔获量也较高,占总渔获量的11.91%(表 2)。鳀在四个航次中均占优势地位,但其渔获量在总渔获量中所占的比例变化较大,除鳀、小黄鱼、黄鲫、黄鮟鱇和细纹狮子鱼外,航次间重要鱼种组成变化较大。
根据单位时间的渔获量分析,各航次各断面黄鮟鱇为主要鱼种,黄鲫、鳀、细纹狮子鱼和小黄鱼在各断面分布也比较广泛,其他各种类在各断面的组成随时间变化差异较大,仅在1 个断面作为主要鱼种出现的种类有12 种,占整个主要鱼种种类数的52.17%,在2个断面作为主要鱼种出现的有5种,占整个主要鱼种组成的21.74%。
| 2006-09 | 2006-12 | ||||||||
| 种类 Species | 单位时间 的渔获量 Catch per hour /(kg/h) | 占总渔获量 的比例 Proportion in the total catch/% | 相对重要性 指数 IRI | 种类 Species | 单位时间 的渔获量 Catch per hour /(kg/h) | 占总渔获量 的比例 Proportion in the total catch/% | 相对重要性 指数 IRI | ||
| S:断面 | |||||||||
| 小黄鱼 Larimichthys polyactis | 10.88 | 24.61 | 3714.45 | 鳀 Engraulis japonicus | 1.68 | 15.22 | 1674.49 | ||
| 鳀 Engraulis japonicus | 2.06 | 4.67 | 1515.40 | 黄鲫 Setipinna taty | 0.96 | 8.68 | 985.14 | ||
| 细纹狮子鱼 Liparis tanakai | 8.69 | 19.65 | 800.13 | 黄鮟鱇 Lophius litulon | 2.75 | 24.94 | 976.77 | ||
| 矛尾虾虎鱼 Chaeturichthys stigmatias | 1.39 | 3.15 | 710.51 | 小带鱼 Eupleurogrammus muticus | 0.59 | 5.33 | 588.60 | ||
| 带鱼 Trichiurus lepturus | 3.44 | 7.79 | 641.79 | 龙头鱼 Psenopsis anomala | 0.40 | 3.58 | 409.54 | ||
| 白姑鱼 Argyrosomus argentatus | 1.76 | 3.99 | 640.61 | 细纹狮子鱼 Liparis tanakai | 0.78 | 7.08 | 398.08 | ||
| 黄鮟鱇 Lophius litulon | 3.91 | 8.85 | 358.99 | 小黄鱼 Larimichthys polyactis | 0.53 | 4.78 | 395.49 | ||
| 龙头鱼 Psenopsis anomala | 1.24 | 2.81 | 309.76 | 绿鳍鱼 Chelidonichthys kumu | 0.78 | 7.06 | 334.13 | ||
| 细条天竺鱼 Apogonichthys lineatus | 0.17 | 0.38 | 243.86 | 刀鲚 Coilia ectenes | 0.36 | 3.25 | 211.94 | ||
| 黄鲫 Setipinna taty | 1.05 | 2.38 | 176.42 | 赤鼻棱鳀 Thryssa kammalensis | 0.19 | 1.72 | 196.47 | ||
| 赤鼻棱鳀 Thryssa kammalensis | 0.99 | 2.24 | 160.86 | 黑鳃梅童鱼 Collichthys niveatus | 0.06 | 0.54 | 178.67 | ||
| 鳗鲡 Anguilla japonica | 1.55 | 3.51 | 143.05 | 虻鲉 Erisphex pottii | 0.08 | 0.71 | 153.67 | ||
| 燕尾鲳 Pampus cinereus | 0.82 | 1.86 | 112.05 | 银鲳 Pampus argenteus | 0.31 | 2.77 | 149.28 | ||
| 合计Total | 37.95 | 85.89 | 合计Total | 9.47 | 85.66 | ||||
| 2007-03 | 2007-05 | ||||||||
| 种类 Species | 单位时间 的渔获量 Catch per hour /(kg/h) | 占总渔获量 的比例 Proportion in the total catch/% | 相对重要性 指数 IRI | 种类 Species | 单位时间 的渔获量 Catch per hour /(kg/h) | 占总渔获量 的比例 Proportion in the total catch/% | 相对重要性 指数 IRI | ||
| 黄鲫 Setipinna taty | 4.80 | 17.56 | 3151.37 | 鳀 Engraulis japonicus | 19.41 | 72.61 | 8755.58 | ||
| 尖海龙 Syngnathus acus | 0.30 | 1.08 | 1820.53 | 黄鮟鱇 Lophius litulon | 3.18 | 11.91 | 889.22 | ||
| 鳀 Engraulis japonicus | 1.69 | 6.16 | 1000.27 | 黄鲫 Setipinna taty | 1.55 | 5.79 | 566.23 | ||
| 鲐 Scomber japonicus | 14.09 | 51.50 | 731.98 | 小黄鱼 Larimichthys polyactis | 0.73 | 2.72 | 256.67 | ||
| 小黄鱼 Larimichthys polyactis | 1.02 | 3.73 | 445.76 | 尖海龙 Syngnathus acus | 0.03 | 0.10 | 231.07 | ||
| 凤鲚 Coilia mystus | 0.48 | 1.76 | 349.45 | 绿鳍鱼 Chelidonichthys kumu | 0.22 | 0.83 | 152.29 | ||
| 黄鮟鱇 Lophius litulon | 1.74 | 6.34 | 324.48 | ||||||
| 细纹狮子鱼 Liparis tanakai | 0.62 | 2.26 | 264.76 | ||||||
| 小带鱼 Eupleurogrammus muticus | 0.47 | 1.72 | 213.38 | ||||||
| 合计Total | 25.21 | 92.11 | 合计Total | 25.12 | 93.96 | ||||
各断面前5 位鱼种的渔获量占断面总渔获量的60%以上,有的断面甚至高达98%。2006年12月和2007年5月各断面单位时间的渔获量呈现S1>S2>S3的趋势,2006年9月呈现由中间S2断面向两边逐渐减少的趋势,而2007年3月呈现由中间S2断面向两边逐渐增加的趋势。各航次冷温种在总渔获量中所占的比例保持相对稳定,从2006年9月到2007年3月,暖温种在总渔获量中所占的比例逐渐减少,暖水种在总渔获量所占的比例逐渐增加,但2007年5月主要以暖温种为主,暖水种和冷温种在总渔获量中仅占8.46%,S1断面不同生态型渔获量分布变化趋势也是如此。 2006年9月S2断面渔获量要显著高于其他航次的渔获量,以暖温种和暖水种为主,暖温种和暖水种渔获量变化趋势与S1断面一致,但是在2007年5月暖温种和暖水种在渔获量中均占有较大比重。S3断面与S1断面渔获量分布一致,但各生态类型渔获量所占的比例有所变化(图 2)。

|
| 图 2 黄海中南部不同断面各生态类型单位时间的渔获量及其在总渔获量中的比例 Fig.2 Distribution of the catch per hour and proportion of fish ecotypes and their percentages in the total catch in sections of the central and southern Yellow Sea |
2 006年9月和12月营养级在3.0—3.3和4.2—4.5的渔获物占较高比例,2007年3月和5月渔获物主要分布在营养级3.0—3.3、3.6—3.9和4.2—4.5,除营养级3.6—3.9的渔获物外,2007年3月其他各营养级的渔获物渔获量明显高于2007年5月;S1断面2006年12月、2007年3月和5月渔获物主要分布在营养级3.6—3.9和4.2—4.5;2006年9月渔获物主要分布在营养级3.3—3.6、3.6—3.9和4.2—4.5;S2断面2006年9月和12月、2007年5月渔获物主要分布在营养级3.0—3.3、3.6—3.9、4.2—4.5,2007年3月渔获物主要分布在4.2—4.5;S3断面2006年9月和12月、2007年3月渔获物主要分布在营养级3.6—3.9和4.2—4.5,2007年5月渔获物主要分布在4.2—4.5。从上可以看出,黄海中南部各断面渔获物主要分布在营养级4.2—4.5、3.0—3.3和3.6—3.9(图 3)。

|
| 图 3 黄海中南部不同断面鱼类组成的营养结构 Fig.3 Distribution of trophic structure of fish in sections of the central and southern Yellow Sea |
各航次H′、D和J变化差异不大,2006年9月和2007年3月的H′、D相对高于其他航次。S1断面各航次J变化不大,但2006年12月H′、D最高,其次是2007年3月和5月,2006年9月最小。S2断面各航次J变化不大,2007年5月H′、D显著低于其他航次,并且其他航次的H′、D差异不大。S3断面各航次J变化不大,2006年9月H′、D明显高于其他航次,但其他航次的H′、D差异不大(图 4)。从多样性指数与环境因子的相关关系分析来看(表 3),2006年9月鱼类种类数与表层温度呈正相关(P<0.05),与底层温度呈显著正相关(P<0.01),与深度呈显著负相关(P<0.01),D与底层温度呈显著正相关(P<0.01),而与底层盐度、深度呈显著负相关(P<0.01),而H′与表层温度呈正相关(P<0.05),与深度呈负相关(P<0.05);2006年12月鱼类种数、D和H′分别与表层温度和底层温度呈显著正相关(P<0.01),J与底层温度呈正相关(P<0.05);2007年3月,多样性指数与环境因子不存在相关性,而2007年5月鱼类种类数与底层温度、D与底层温度呈正相关(P<0.05),D与底层盐度呈负相关(P<0.05)。
2.5 鱼类的长度谱2006年9月到2007年5月,鱼类长度谱主要集中在3—24 cm(图 5),2006年9、12月和2007年3月36—42 cm的个体也较多,2006年12月大于48 cm的个体较多,而2007年5月小于3 cm的个体也占较高比重。S1断面,2006年9月鱼类长度谱主要分布在6—9 cm和12—33 cm,2006年12月鱼类长度谱主要分布在3—27 cm、39—42 cm和35—48 cm,2007年3月鱼类长度谱主要分布在3—15 cm、18—24 cm和36—39 cm,2007年5月长度谱主要分布在6—18 cm、21—27 cm和45—48 cm。S2断面长度谱主要分布在3—18 cm,另外,2006年9月长度谱在21—24 cm、27—30 cm和36—39 cm的个体也占较高比重。S3断面长度谱主要分布在3—24 cm,在2007年3月小于3 cm的个体也较多,2006年9月24—30 cm个体也占很高比重。各主要种类平均体长分布随调查时间和断面的变化而有所差异见表 4。

|
| 图 4 黄海中南部不同断面的鱼类多样性 Fig.4 Fish species diversity in the sections of the central and southern Yellow Sea |
| 日期 Date | 因子Factors | ||||||||
| 鱼类种 类数 Number of fish species | 丰富度 指数 Richness index D | 多样性 指数 Diversity index H′ | 均匀度 指数 Evenness index J | 表层 温度 Sea surface temperature | 表层 盐度 Sea surface salinity | 底层 温度 Sea bottom temperature | 底层 盐度 Sea bottom salinity | ||
| * P<0.05;** P<0.01 | |||||||||
| 2006-09 | 鱼类种类数Number of fish species | ||||||||
| 丰富度指数Richness index D | 0.935** | ||||||||
| 多样性指数Diversity index H′ | 0.340 | 0.352 | |||||||
| 均匀度指数Evenness index J | 0.710** | 0.695** | 0.899** | ||||||
| 表层温度Sea surface temperature | 0.461* | 0.286 | 0.435 | 0.528* | |||||
| 表层盐度Sea surface salinity | 0.313 | 0.137 | 0.138 | 0.225 | 0.491* | ||||
| 底层温度Sea bottom temperature | 0.783** | 0.750** | 0.060 | 0.385 | 0.421 | 0.528* | |||
| 底层盐度Sea bottom salinity | -0.428 | -0.569* | -0.139 | -0.286 | 0.034 | 0.196 | -0.484* | ||
| 深度Water depth | -0.679** | -0.731** | -0.237 | -0.466* | -0.273 | -0.344 | -0.829** | 0.811** | |
| 2006-12 | 鱼类种类数Number of fish species | ||||||||
| 丰富度指数Richness index D | 0.994** | ||||||||
| 多样性指数Diversity index H′ | 0.547* | 0.549* | |||||||
| 均匀度指数Evenness index J | 0.961** | 0.965** | 0.694** | ||||||
| 表层温度Sea surface temperature | 0.739** | 0.699** | 0.479 | 0.646** | |||||
| 表层盐度Sea surface salinity | 0.557* | 0.507 | 0.138 | 0.413 | 0.781** | ||||
| 底层温度Sea bottom temperature | 0.775** | 0.731** | 0.622* | 0.709** | 0.919** | 0.693** | |||
| 底层盐度Sea bottom salinity | 0.253 | 0.202 | -0.233 | 0.099 | 0.527* | 0.832** | 0.309 | ||
| 深度Water depth | -0.076 | -0.118 | -0.417 | -0.161 | 0.147 | 0.350 | -0.033 | 0.747** | |
| 2007-03 | 鱼类种类数Number of fish species | ||||||||
| 丰富度指数Richness index D | 0.899** | ||||||||
| 多样性指数Diversity index H′ | 0.128 | 0.480 | |||||||
| 均匀度指数Evenness index J | 0.391 | 0.688** | 0.962** | ||||||
| 表层温度Sea surface temperature | 0.317 | 0.183 | 0.041 | 0.132 | |||||
| 表层盐度Sea surface salinity | 0.220 | 0.042 | -0.084 | -0.010 | 0.631* | ||||
| 底层温度Sea bottom temperature | 0.458 | 0.216 | -0.189 | -0.047 | 0.921** | 0.669** | |||
| 底层盐度Sea bottom salinity | 0.479 | 0.207 | -0.339 | -0.190 | 0.409 | 0.647** | 0.654** | ||
| 深度Water depth | 0.159 | -0.090 | -0.441 | -0.365 | 0.178 | 0.776** | 0.381 | 0.619* | |
| 2007-05 | 鱼类种类数Number of fish species | ||||||||
| 丰富度指数Richness index D | 0.969** | ||||||||
| 多样性指数Diversity index H′ | 0.358 | 0.471 | |||||||
| 均匀度指数Evenness index J | 0.772** | 0.846** | 0.837** | ||||||
| 表层温度Sea surface temperature | 0.375 | 0.303 | -0.026 | 0.074 | |||||
| 表层盐度Sea surface salinity | -0.290 | -0.235 | 0.164 | 0.068 | -0.840** | ||||
| 底层温度Sea bottom temperature | 0.629* | 0.620* | 0.298 | 0.437 | 0.815** | -0.702** | |||
| 底层盐度Sea bottom salinity | -0.469 | -0.538* | -0.365 | -0.447 | -0.501 | 0.546* | -0.749** | ||
| 深度Water depth | -0.179 | -0.200 | -0.030 | -0.038 | -0.570* | 0.803** | -0.634* | 0.819** | |

|
| 图 5 黄海中南部不同断面鱼类长度谱 Fig.5 Size spectra of fish in the sections of the central and southern Yellow Sea |
| 日期Date | 黄鮟鱇/cm Lophius litulon | 小黄鱼/cm Larimichthys polyactis | 鳀/cm Engraulis japonicus | 细纹狮子鱼/cm Liparis tanakai | 黄鲫/cm Setipinna taty | |
| 2006-09 | S1 | 32.41 | 15.01 | 7.61 | 27.94 | 13.39 |
| S2 | / | 13.08 | 6.02 | / | 10.15 | |
| S3 | 24.73 | 12.90 | 5.77 | 28.34 | / | |
| 2006-12 | S1 | 48.66 | 15.42 | 10.96 | 40.95 | 8.92 |
| S2 | 58.96 | 14.11 | 5.21 | 44.81 | 11.72 | |
| S3 | 53.86 | 16.00 | 8.55 | 40.51 | / | |
| 2007-03 | S1 | 37.78 | 14.91 | 8.78 | 10.37 | 14.97 |
| S2 | 42.73 | 12.68 | 6.81 | 54.91 | 8.42 | |
| S3 | 39.57 | 15.44 | 10.82 | 6.07 | 9.93 | |
| 2007-05 | S1 | 46.35 | 15.59 | 11.55 | 11.29 | 9.20 |
| S2 | 10.62 | 5.20 | 5.60 | 4.64 | 9.28 | |
| S3 | 38.89 | 14.91 | 10.85 | 8.96 | 6.78 | |
黄海中南部各断面鱼类种类以鲈形目最多,并且暖温种和暖水种占主要成分,仅少量冷温种,这与整个黄海水域[3]及黄海中南部[4]种类组成一致。各断面鱼类种类组成存在明显的季节变化,这与鱼类季节间产卵、索饵及越冬洄游有关[3]。各断面重要鱼种除小黄鱼、带鱼、银鲳等鱼类外,以小型中上层鱼类(鳀、黄鲫等)和底层经济价值较低的种类(黄鮟鱇、细纹狮子鱼等)为主,优势种的渔获量在各断面均占总渔获量的50%以上,重要鱼种渔获量在总渔获量中均占85%以上,充分体现了目前黄海中南部各断面能量流动和生态位主要由少数主要种类控制,这在黄海中南部主要种类的生态位分析中也有体现[28],类似的研究结果在其他的研究海域如渤海[29]、东海[30]、长江口[11, 14, 15]也得到证实。黄海中南部不同断面鱼类资源结构与黄海大面调查历史资料相比有较大变化,1959年,整个黄海水域优势种以小黄鱼、带鱼、鲆鲽类经济价值较高的种类为主[3],到1990年代末,黄鮟鱇和细纹狮子鱼等低值鱼类逐渐成为优势种[31],与之相适应的是我国近海捕捞产量的60%以上由小型中上层鱼类、底层低值鱼类及经济鱼类的幼体组成[3]。这与一些地区性种类,如鲽形目、鲶形目种类和软骨鱼类因过度捕捞和环境污染直接导致种类数减少、分布范围改变及资源量下降,有的甚至枯竭密切相关[18]。
3.2 渔获量时空分布暖水种和暖温种的渔获量在各断面总渔获量中所占的比例随时间不同而有所差异,如2007年3月各断面暖水种占主要成分,而2006年9月暖温种占主要成分,在S3断面,冷温种渔获量也占较大的比例,这与各断面主要鱼种的变化密切相关,2006年9月S3断面冷温种渔获量主要是由于细纹狮子鱼大量分布引起,而S1和S2断面有大量的小黄鱼、黄鮟鱇等暖温种类的分布,与其他研究中相近时间各种类的分布范围类似[32, 33]。2006年12月和2007年5月各断面渔获量呈现S1>S2>S3的趋势,2006年9月渔获量呈现由中间S2断面向两边逐渐减少的趋势,而2007年3月渔获量呈现由中间S2断面向两边逐渐增加的趋势,这与各断面优势种小黄鱼、黄鮟鱇、细纹狮子鱼、鳀和黄鲫等种类的渔获量变化及分布有关。2007年5月各优势种渔获量与1950年代以来黄海大面调查各优势种渔获量有较大变化,如小黄鱼渔获量在总渔获量中占的比例显著降低,而黄鮟鱇在总渔获量中所占的比例有所增加,黄鲫、鳀在总渔获量中所占的比例从1980年代开始有所增加,但单位时间的渔获量下降[3]。
3.3 营养结构与长度谱黄海中南部各断面渔获物的营养级主要分布在4.2—4.5、3.0—3.3和3.6—3.9,各断面各营养级的渔获量存在差异,相同断面各营养级的渔获量随时间不同也存在差异,这与各断面鱼类资源结构有关,同时,也与各种鱼类饵料的季节和空间分布变化有关,虽然黄海中南部各断面的鱼类主要以浮游动物食性为主,但除太平洋磷虾外,其余各浮游动物种类均存在显著的季节和空间差异[34];另外,也与黄海鱼类的生长繁殖周期有关,黄海鱼类的产卵盛期是5—8月[35],因此,5月调查中食浮游动物的幼鱼占主要成分(这在鱼类长度谱分布中也有证实,图 5),9月随着鱼体的生长,逐渐转变成成鱼的摄食习性,随之造成营养级的改变。黄海中南部各断面渔获物平均营养级与20世纪初平均营养级3.4[36]差异不大,说明近年来黄海生态系统中鱼类资源的结构和食物利用方式保持相对稳定,这在黄海中南部断面鱼类食物网分析[31]和黄海主要优势种摄食组成长期变化[34]中也得到证实。食物网结构和能量流动是生态系统结构和功能变化的指示因子[37],黄海近十年来鱼类资源结构和能量流动方式的相对稳定反映了黄海生态系统的相对稳定,也从侧面彰显了我国近年来的采取的一些渔业资源和水域环境管理保护措施的积极作用。
鱼类长度谱在一定程度上反映了生物群落的能量结构及其对外界压力的响应[38, 39],即各鱼类种群资源结构稳态,黄海中南部各断面鱼类长度谱集中在3—24 cm,S2断面长度谱分布更集中,并且小于S1和S3断面,黄海中南部水域各断面总体由南向北鱼类长度谱逐渐增大的趋势,这与各断面的种类组成有关,如北部断面主要以黄鮟鱇、鳀、细纹狮子鱼、大头鳕、小黄鱼为主,南部的断面以鳀、黄鲫、龙头鱼为主,在黄、东海鱼类的研究中也有类似发现[30]。另外,各断面鱼类长度谱存在时空差异,如2006年12月大于48 cm的个体也较多,2007年5月小于3 cm的个体也占较高比重,这与鱼类的产卵、索饵和越冬等生理洄游过程及各关键洄游区分布有直接的关系,5月是多数鱼类的产卵期,补充群体在渔获量中占较高比重,而12月主要是越冬群体,这在黄鮟鱇、细纹狮子鱼、鳀、小黄鱼和黄鲫等体长分布中均有体现(表 3);其次,各断面鱼类群落结构的差异也造成了其长度谱的不同。另外,有的种类因雌雄体长及其分布的差异也会造成各个断面长度谱的差异,如黄鮟鱇9月主要分布在黄海;11月到翌年1月扩展分布至东海,达到性成熟体长的雌雄个体分布特征不同,雄性主要分布在东海,而雌性只分布在黄海;2月到5月未成熟个体分布在黄海和东海,产卵群体均分布在东海和日本九州岛沿岸,黄海中无性成熟个体,并且雌雄个体平均体长存在明显差异,通常雌性个体大于雄性个体[40],这在黄海中南部黄鮟鱇的研究中也有类似发现[41]。
3.4 群落结构多样性黄海中南部各断面群落多样性指数总体差异不大,并且各航次各断面的鱼类主要分为两个类群,S2断面和S3断面具有较高的相似性。鱼类群落的这种多样性变化与生境结构、饵料资源状况及鱼类生理活动密切相关,鱼类洄游造成其时空分布的差异,从而引起鱼类群落结构和多样性的变化[3, 15],甚至鱼类昼夜移动及种间关系的改变,也会造成其多样性的变化[42]。另外,本研究中2007年5月鱼类多样性指数(1.46)与1959年(2.37)、1981年(3.30)和1986年(1.81)黄海大面调查中鱼类多样性指数有所降低,这在渤海[43]、长江口[15]、东海[44]鱼类多样性的年际变化中均有发现,并且研究证实这种长时间尺度的鱼类多样性的降低主要是由于高强度的捕捞和环境污染引起[7, 15, 21]。鱼类群落的多样性指数与可利用的生态位和生境大小有关系,并且因环境因素的多变性鱼类群落结构在空间上表现出较大的空间异质性[45]。2006年9月,多样性指数J、D与深度呈明显的负相关关系,其他月份关系不显著。2006年9月和2006年12月,多样性指数J、D和海水温度有明显的正相关关系,而在2007年3月和2007年5月其关系不明显。在黄、东海冬季底层鱼类群落多样性分析中也发现鱼类的各多样性指数与深度、底层温度和底层盐度呈显著正相关,黄、东海秋冬季节逐渐形成和强势的海表温度锋面影响着鱼类的摄食和洄游等行为[46],可能是造成与鱼类群落的多样性指数关系密切的原因,而随着春季海水温度的回升,锋面的逐渐消失使得这种关系变的不显著。对大西洋大尺度范围的物种丰富度的研究也表明,海水温度是众多环境因子中对底层物种分布模式具有重要影响作用的因素[47]。费鸿年等研究南海北部大陆架底栖鱼类时发现,物种多样性与温度及水深有比较明显的关系[48]。此外,环境因子例如水温、盐度和地形等因素以及鱼类本身的洄游活动等叠加作用也可能使多样性指数与单一环境因子的关系不显著。另外,一些中上层种类如鳀对外界环境变化非常敏感[49],而鳀作为黄海生态系统食物网中的关键种,曾被超过60%的鱼类摄食[50],目前,因过度捕捞导致其资源量的下降[43],对黄海鱼类群落结构及其多样性造成了一定影响,并且黄海部分鱼类转向摄食脊腹褐虾 Crangon affinis[34, 35]。
致谢:
感谢中国水产科学研究院黄海水产研究所资源室成员及“北斗”号全体船员在室内实验和野外调查取样过程中给予的帮助。
| [1] | Lotze H K, Lenihan H S, Bourque B J. Depletion, degradation, and recovery potential of estuaries and coastal seas. Science, 2006, 312(5781): 1806-1809. |
| [2] | Stramma L, Johnson G C, Sprintall J, Mohrholz V. Expanding oxygen-minimum zones in the tropical oceans. Science, 2008, 320(5876): 655-658. |
| [3] | Jin X S, Tang Q S. Changes in fish species diversity and dominant species composition in the Yellow Sea. Fisheries Research, 1996, 26(3/4): 337-352. |
| [4] | Xu B D, Jin X S. Variations in fish community structure during winter in the southern Yellow Sea over the period 1985—2002. Fisheries Research, 2005, 71(1): 79-91. |
| [5] | Baum J K, Worm B. Cascading top-down effects of changing oceanic predator abundances. Journal of Animal Ecology, 2009, 24(5): 254-262. |
| [6] | Boudreau S A, Anderson S C, Worm B. Top-down interactions and temperature control of snow crab abundance in the northwest Atlantic Ocean. Marine Ecology Progress Series, 2011, 429: 169-183. |
| [7] | Worm B, Barbier E B, Beaumont N. Impacts of biodiversity loss on ocean ecosystem services. Science, 2006, 314(5800): 787-790. |
| [8] | Tittensor D P, Mora C, Jetz W. Global patterns and predictors of marine biodiversity across taxa. Nature, 2010, 466(7310): 1098-1101. |
| [9] | Cheung W W L, Lam V W Y, Sarmiento J L, Kearney K, Watson R, Pauly D. Projecting global marine biodiversity impacts under climate change scenarios. Fish and Fisheries, 2009, 10(3): 235-251. |
| [10] | Jin X S, Deng J Y. Variations in community structure of fishery resources and biodiversity in the Laizhou Bay Shandong. Biodiversity Science, 2000, 8(1): 65-72. |
| [11] | Jin X S, Shan X J, Guo X W, Li X S. Community structure of fishery biology in the Yangtze River estuary and its adjacent waters. Acta Ecologica Sinica, 2009, 29(9): 4761-4772. |
| [12] | Shan X J, Jin X S, Yuan W. Taxonomic diversity of fish assemblages in the Changjiang Estuary and its adjacent waters. Acta Oceanologica Sinica, 2010, 29(2): 70-80. |
| [13] | Shan X J, Jin X S, Yuan W. Fish assemblage structure in the hypoxic zone in the Changjiang Yangtze River estuary and its adjacent waters. Chinese Journal of Oceanology and Limnology, 2010, 28(3): 459-469. |
| [14] | Shan X J, Jin X S. Diversity of fish community structure in the spring-time offshore waters at the Yangtze River estuary. Oceanologia et Limnologia Sinica, 2011, 42(1): 32-40. |
| [15] | Li J S, Li S F, Ding F Y, Cheng J H. Analysis on annual change of fish diversity in Yangtze estuary offshore water area. Journal of Fishery Sciences of China, 2007, 14(2): 637-643. |
| [16] | Xu Z L, Shen A L. Spatial and temporal distribution on fish diversity in the Xinghua Bay. Journal of Fishery Sciences of China, 2011, 18(2): 416-426. |
| [17] | Lü Z B, Li F, Xu B Q, Wang B. Fish community diversity during spring and autumn in the Yellow Sea off the coast of Shandong. Biodiversity Science, 2012, 20(2): 207-214. |
| [18] | Chen D G. Fishery Ecology of the Bohai Sea and the Yellow Sea. Beijing: Ocean Press, 1991: 1-18. |
| [19] | Bray T R, Curtis J T. An ordination of the upland forest communities of southern Wisconsin. Ecological Monographs, 1975, 27(4): 325-349. |
| [20] | Shannon C E, Weaver W. The Mathematical Theory of Communication. Urbana: University of Illinois Press, 1949. |
| [21] | Margalef R. Information theory in ecology. General System, 1958, 3: 36-71. |
| [22] | Pielou E C. Ecological Diversity. New York: Wiley, 1975. |
| [23] | Pianka E R. Ecology of the Agamid lizard amphiboluns isolepis in Western Austria. Copeia, 1971: 527-536. |
| [24] | Bianchi G, Gislason H, Graham K, Hill L, Jin X, Koranteng K, Manickchand-Heileman S, Payá I, Sainsbury K, Sanchez F, Zwanenburg K. Impact of fishing on size composition and diversity of demersal fish community. ICES Journal of Marine Science, 2000, 57(3): 558-571. |
| [25] | Zhang B. Preliminary Studies on Marine Food Web and Trophodynamics in China Coastal Seas [D]. Qingdao: Ocean University of China, 2005. |
| [26] | Clarke K R, Gorley R N. PRIMER v5: User, Manual/Tutorial. Plymouth: PRIMER-E Ltd., 2001. |
| [27] | Jin X S, Zhao X Y, Meng T X, Cui Y. Living resources and environment in the Yellow Sea and Bohai Sea. Beijing: Science Press, 2005: 110-112. |
| [28] | Yu Z H, Jin X S, Li X S. Analysis of ecological niche for major fish species in the central and southern Yellow Sea. Progress in Fishery Sciences, 2010, 31(6): 1-8. |
| [29] | Jin X S. The dynamics of major fishery resources in the Bohai Sea. Journal of Fishery Sciences of China, 2001, 7(4): 22-26. |
| [30] | Liu Y, Li S F, Cheng J H. A study on seasonal changes of the fish communities in the East China Sea and the Huanghai Sea. Acta Oceanologica Sinica, 2006, 28(4): 108-114. |
| [31] | Zhang B, Tang Q S, Jin X S. Functional groups of communities and their major species at high trophic level in the Yellow Sea ecosystem. Acta Ecologica Sinica, 2009, 29(3): 1099-1111. |
| [32] | Li Z L. Interannual Changes in Biological Characteristics and Population Dynamics of Cmall Yellow Croaker Larimichthys polyactis, Pacific Cod Gadus macrocephalus and Anglerfish Lophius litulon in the Yellow Sea [D]. Qingdao: Oceanology of Institute, Chinese Academy of Sciences, 2011. |
| [33] | Zhou Z P, Jin X S, Shan X J, Li Z L, Dai F Q. Seasonal variations in distribution and biological characteristics of snailfish Liparis tanakae in the central and southern Yellow Sea. Acta Ecologica, 2012, 32(17): 5550-5561. |
| [34] | Zhang B, Jin X S. Seasonal variations of the functional groups of fish community and their consumption of zooplankton in the Yellow Sea. Journal of Fisheries of China, 2010, 34(4): 548-558. |
| [35] | Wan R J, Jiang Y W. Studies on the ecology of eggs and larvae of Osteichthyes in the Yellow Sea. Marine Fisheries Research, 1998, 19(1): 60-73. |
| [36] | Zhang B, Tang Q S. Study on trophic levels of important resource species at high troph levels in the Bohai Sea, Yellow Sea and East China Sea. Advances in Marine Science, 2004, 22(4): 393-404. |
| [37] | Jin X S, Zhang B, Xue Y. The response of the diets of four carnivorous fishes to variations in the Yellow Sea ecosystem. Deep Sea Research II: Topical Studies in Oceanography, 2010, 57(11/12): 996-1000. |
| [38] | Blanchard J L, Dulvy N K, Jennings S. Do climate and fishing influence size-based indicators of Celtic Sea fish community structure?. ICES Journal of Marine Science, 2005, 62(3): 405-411. |
| [39] | Marquet P A, Quifiones R A, Abades S, Labra F, Tognelli M, Arim M, Marcelo R M. Scaling and power-laws in ecological systems. Journal of Experimental Biology, 2005, 208(9): 1749-1769. |
| [40] | Yoneda M, Tokimura M, Fujita H. Reproductive cycle, fecundity, and seasonal distribution of the anglerfish Lophius litulon in the East China and Yellow Seas. Fish Bulletin, 2001, 99(2): 356-370. |
| [41] | Zhang X J, Shen W, Li J S, Cheng J H. Distribution pattern of Lophius litulon and its′ relationship with environmental factors in the south Yellow Sea and north East China Sea. Marine Fisheries, 2010, 32(1): 59-65. |
| [42] | Jin X. Fishery biodiversity and community structure in the Yellow and Bohai Seas. American Fisheries Society Symposium, 2003, 38: 643-650. |
| [43] | Jin X S, Hamre J, Zhao X Y, Li F G. Study on the quota management of anchovy (Engraulis japonicus) in the Yellow Sea. Journal of Fishery Sciences of China, 2001, 8(3): 27-30. |
| [44] | Cheng J H, Ding F Y, Li S F, Yan L P, Li J S, Liang Z L. Changes of fish community structure in the coastal zone of the northern part of East China Sea in summer. Journal of Natural Resources, 2006, 21(5): 775-781. |
| [45] | Selleslagh J, Aiilara R. Environmental factors structuring fish composition and assemblages in a small macrotidal estuary (eastern English Channel). Estuarine, Coastal and Shelf Science, 2008, 79(3): 507-517. |
| [46] | Hickox R, Belkin I M, Cornillon P, Shan Z Q. Climatology and seasonal variability of ocean fronts in the East China, Yellow and Bohai seas from satellite SST data. Geophysical Research Letters, 2000, 27(18): 2945-2948. |
| [47] | Macpherson E. Large-scale species-richness gradients in the Atlantic Ocean. Proceedings of the Royal Society B: Biological Sciences, 2002, 269(1501): 1715-1720. |
| [48] | Fei H N, He B Q, Chen G M. The regional and seasonal variations of diversity and dominant species of demersal fish communities in continental shelf of northern Nan Hai. Journal of Fisheries of China. Journal of Fisheries of China, 1981, 5(1): 1-20. |
| [49] | Tang Q S, Ye M Z. The exploitation and conservation of nearshore fisheries resources off Shandong. Beijing: China Agriculture Press, 1990: 117-119. |
| [50] | Iversen S A, Zhu D, Johannessen A, Toresen R. Stock size, distribution and biology of anchovy in the Yellow Sea and East China Sea. Fisheries Research, 1993, 16(2): 147-163. |
| [10] | 金显仕, 邓景耀. 莱州湾渔业资源群落结构和生物多样性的变化. 生物多样性, 2000, 8(1): 65-72. |
| [11] | 金显仕, 单秀娟, 郭学武, 李显森. 长江口及其邻近海域渔业生物的群落结构特征. 生态学报, 2009, 29(9): 4761-4772. |
| [14] | 单秀娟, 金显仕. 长江口近海春季鱼类群落结构的多样性研究. 海洋与湖沼, 2011, 42(1): 32-40. |
| [15] | 李建生, 李圣法, 丁峰元, 程家骅. 长江口近海鱼类多样性的年际变化. 中国水产科学, 2007, 14(2): 637-643. |
| [16] | 徐兆礼, 沈盎绿. 兴化湾海域鱼类多样性的时空变化. 中国水产科学, 2011, 18(2): 416-426. |
| [17] | 吕振波, 李凡, 徐炳庆, 王波. 黄海山东海域春、秋季鱼类群落多样性. 生物多样性, 2012, 20(2): 207-214. |
| [18] | 陈大刚. 黄渤海渔业生态学. 北京: 海洋出版社, 1991: 1-18. |
| [25] | 张波. 中国近海食物网及鱼类营养动力学关键过程的初步研究 [D]. 青岛: 中国海洋大学, 2005. |
| [27] | 金显仕, 赵宪勇, 孟田湘, 崔毅. 海生物资源与栖息环境. 北京: 科学出版社, 2005: 110-112. |
| [28] | 于振海, 金显仕, 李显森. 黄海中南部主要鱼种的生态位分析. 渔业科学进展, 2010, 31(6): 1-8. |
| [29] | 金显仕. 渤海主要渔业生物资源变动的研究. 中国水产科学, 2001, 7(4): 22-26. |
| [30] | 刘勇, 李圣法, 程家骅. 东海、黄海鱼类群落结构的季节变化研究. 海洋学报, 2006, 28(4): 108-114. |
| [31] | 张波, 唐启升, 金显仕. 黄海生态系统高营养层次生物群落功能群及其主要种类. 生态学报, 2009, 29(3): 1099-1111. |
| [32] | 李忠炉. 黄渤海小黄鱼、大头鳕和黄鮟鱇种群生物学特征的年际变化 [D]. 青岛: 中国科学院海洋所, 2011. |
| [33] | 周志鹏, 金显仕, 单秀娟, 李忠炉, 戴芳群. 黄海中南部细纹狮子鱼的生物学特征及资源分布的季节变化. 生态学报, 2012, 32(17): 5550-5561. |
| [34] | 张波, 金显仕. 黄海鱼类功能群及其对浮游动物捕食的季节变化. 水产学报, 2010, 34(4): 548-558. |
| [35] | 万瑞景, 姜言伟. 黄海硬骨鱼类鱼卵、仔稚鱼及其生态调查研究. 海洋水产研究, 1998, 19(1): 60-73. |
| [36] | 张波, 唐启升. 渤、黄、东海高营养层次重要生物资源种类的营养级研究. 海洋科学进展, 2004, 22(4): 393-404. |
| [41] | 张学健, 沈伟, 李建生, 程家骅. 黄海南部和东海中北部黄鮟鱇数量分布及其与环境的关系. 海洋渔业, 2010, 32(1): 59-65. |
| [43] | 金显仕, Hamre J, 赵宪勇, 李富国. 黄海鳀鱼限额捕捞的研究. 中国水产科学, 2001, 8(3): 27-30. |
| [44] | 程家骅, 丁峰元, 李圣法, 严利平, 李建生, 梁振林. 夏季东海北部近海鱼类群落结构变化. 自然资源学报, 2006, 21(5): 775-781. |
| [48] | 费鸿年, 何宝全, 陈国铭. 南海北部大陆架底栖鱼群聚的多样度以及优势种区域和季节变化. 水产学报, 1981, 5(1): 1-20. |
| [49] | 唐启升, 叶懋中. 山东近海渔业资源开发与保护. 北京: 中国农业出版社, 1990: 117-119. |