 2014, Vol. 34
文章信息
- 赵姹, 李志, 刘文兆, 王小静
- ZHAO Cha, LI Zhi, LIU Wenzhao, WANG Xiaojing
- 泾河流域潜在蒸散量的时空变异
- Spatiotemporal characteristics of potential evapotranspiration during current and future period in the Jinghe watershed
- 生态学报, 2014, 34(19): 5600-5608
- Acta Ecologica Sinica, 2014, 34(19): 5600-5608
- http://dx.doi.org/10.5846/stxb201306101623
-
文章历史
- 收稿日期:2013-6-10
- 修订日期:2014-7-13


2. 西北农林科技大学水土保持研究所 黄土高原土壤侵蚀与旱地农业国家重点实验室, 杨凌 712100
2. State Key Laboratory of Soil Erosion and Dryland Farming of Loess Plateau, Institute of Soil and Water Conservation, Northwest Agriculture and Forestry University, Yangling 712100, China
潜在蒸散量(ET0)是实际蒸散量的理论上限,也是计算实际蒸散量的基础[1],在气候干湿状况分析、水资源合理利用评价、农业作物需水与生产管理、生态环境变化等研究中得到广泛应用[2, 3]。分析ET0的时空变异对研究气候变化的水文效应、植被耗水长期演变等具有重要意义。全球气候变化背景下,处于半湿润向半干旱气候过渡地带的泾河流域过去几十年暖干化趋势显著[4],降水减少、温度升高及极端降水事件增多[5, 6, 7],年径流量减少,枯水出现年份周期缩短[8, 9],这都与蒸散的变化密切相关。泾河流域作为生态环境脆弱区及气候变化敏感区之一,ET0的变化直接关系着流域的干湿状况、水资源演变和植物需水。
部分研究通过计算或蒸发皿数据对泾河流域蒸散量进行了分析。杨小利等利用泾河流域上游4个站点1965—2010年的气象数据,发现ET0在1个站点显著增加,而其他站点变化不显著[10];王佩等通过泾河流域14个气象站点1957—2002年器皿蒸发数据,发现蒸发量降低[11];张淑兰等利用水文模型SWIM对1997—2003年泾河上游流域的实际蒸散量及其各组分进行了估算[12],并进行了气候变化敏感性分析,发现降水变化将导致蒸散具有相同的变化方向[13]。可见,由于站点和时段选择等原因,目前针对泾河流域蒸散的研究尚不充分,特别是针对未来气候变化下的ET0分析薄弱。全球气候变化背景下,黄土高原进入21世纪以后,降水增加,气候由暖干趋向暖湿[14],与政府间气候变化专门委员会(IPCC,Intergovernmental Panel on Climate Change)第四次评估报告中对21世纪末关于降水减少的预测有所不同。因此,在分析泾河流域ET0当前特征的基础上预测其未来变化显得尤为重要。
未来气候变化预测多基于大气环流模式(GCM,General Circulation Model)进行,但由于GCM分辨率较低,输出的数据基于网格尺度(HadCM3(Hadley Centre Coupled Model,version 3)的网格,经度×纬度=2.5°×3.75°),不能考虑小尺度的区域差异,在模拟分析区域尺度的气候变化方面尚不理想[15]。因此,非常有必要对GCM数据进行降尺度以获得更加准确的气候变化信息[16, 17]。降尺度有动力学和统计学降尺度两种方法[18],其中,统计方法通过建立GCM与实测数据之间的统计关系预测未来气候变化,由于容易实现并可按照当地条件进行校准而被广泛应用。但降尺度预测目前多应用于温度及降水的预测[17],蒸散预测的应用相对较少。
本研究以泾河流域为研究区,在计算和分析当前时期ET0变化的基础上,对HadCM3输出的A2和B2情景数据进行降尺度预测ET0,建立21世纪20年代,50年代和80年代未来3个时期的ET0变化情景,分析该区21世纪 ET0变化趋势,旨在为合理利用水资源,应对气候变化提供科学决策依据。
1 数据与方法 1.1 研究区域与数据来源泾河流域地处黄土高原中部(图 1),流经陕甘宁3省(区)31个县(市),流域面积45421 km2,水土流失面积41375 km2。流域处于半湿润-半干旱过渡地带,为典型的温带大陆性气候。气温和雨量由东南向西北逐渐递减,年均气温8—13 ℃,年均降水量390—560 mm。冬春干旱少雨,夏季多暴雨,旱灾较频繁。泾河流域地形复杂多样,是世界上水土流失最严重的地区之一,80%以上的土地面临着水土流失。

|
| 图 1 泾河流域位置及气象站点分布图 Fig. 1 The location of the Jinghe watershed and the meterological stations |
研究使用的数据包括3部分:实测数据、NCEP(National Centers for Environmental Prediction)再分析数据和GCM预测数据。实测数据来源于泾河流域内部15个气象站点(图 1)1961—2005年日序列数据,包括降水、温度、相对湿度、风速和日照时数等,用于计算当前时段的ET0。研究中需要借助反映实际气候状况的再分析资料,由美国环境预报中心(NCEP)和国家大气研究中心(NCAR,the National Center for Atmospheric Research)联合提供,时段为1961—2000年,包括平均海平面气压、地表平均气温、比湿、相对湿度等。有研究表明,英国Hadley中心的海气耦合模式(HadCM3)对东亚地区模拟效果较好[19],因此本研究在GCM模式上选择HadCM3,同时基于泾河流域快速发展的趋势,选择IPCC在2000年温室气体排放情景(SRES)[18]中提出的A2(高温室气体排放情景)和B2(低温室气体排放情景)两种情景。HadCM3在A2和B2排放情景下的数据,包括两个时段:1961—2000年和2011—2099年,其中1961—2000年的ET0、NCEP数据用于当前时段统计关系的建立,而2011—2099年的HadCM3数据用来基于建立的统计关系预测21世纪的ET0变化。
1.2 ET0计算与预测采用联合国粮农组织(FAO,Food and Agriculture Organization)推荐的Penman-Monteith公式[20]计算ET0。基于15个气象站点的日数据计算日序列ET0,然后合并计算得到月值和年值。将计算所得的泾河流域1961—2005年ET0数据与实测蒸发皿数据进行对比(图 2),可以看出利用P-M公式计算出的ET0与蒸发皿数据吻合程度较好。

|
| 图 2 1961—2005年泾河流域蒸发皿蒸发量同ET0的比较 Fig. 2 Comparison of annual pan evaporation and ET0 from 1961 to 2005 |
基于SDSM (Statistical Downscaling Model,version 4.2)预测未来ET0。具体操作主要包括3个步骤:
(1)预报因子选择 选择ET0作为预报量,从26个大气环流变量中选择预报因子,通过偏相关系数、校准和验证效果等选择最佳预报因子组合。
(2)模型率定与验证 将1961—2000年的3类数据分成1961—1980年和1981—2000年2个时段,分别用于模型的率定与验证。使用1961—1980年数据,基于选定的预报因子与预报变量,建立实测数据与NCEP再分析数据的统计关系,完成模型校准。将建立的统计关系,应用于1981—2000年的NCEP再分析数据,生成预报量在该时段的日序列,对比分析模拟序列与实测序列间的吻合程度。
(3)预测未来ET0 针对未来3个时段(21世纪20年代,50年代,80年代),将HadCM3输出的大气环流因子输入SDSM建立的统计模型中,生成各个站点的未来日序列数据,分析未来ET0变化趋势。
按上述步骤对每个站点进行重复操作,即可得到全流域的ET0变化趋势预测结果。
运用决定系数D[20]和模型效率系数E[21]对SDSM降尺度效果进行评估,其中:
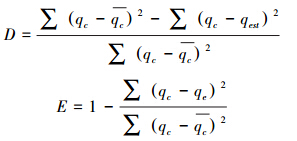
运用反距离权重插值法分析当前和未来ET0的空间分布。运用Mann-Kendall方法对ET0年际变化进行单调趋势和突变分析。使用t检验分析未来ET0变化的显著性,比较其与基准期ET0差异的显著程度,使用0.05的显著性水平。上述操作,均使用各站点数据进行。

|
| 图 3 1961—2005年泾河流域ET0的空间分布 Fig. 3 The spatial distribution of annual average ET0 in the Jinghe watershed during 1961—2005 |
1961—2005年泾河流域ET0年均值为934.6 mm。由1961—2005年ET0的空间分布(图 3)可以看出,流域大部分地区的年均ET0 > 910 mm/a,低值出现在流域西南部(< 870 mm/a),高值则出现在东南及北部少部分地区(> 970 mm/a)。
泾河流域ET0在1961—2005年间不断波动,最小值和最大值分别出现在1964年和1995年,总体上仅具有一个不显著的上升趋势(图 4)。利用Mann-Kendall法对流域15个站点的年ET0进行趋势检验,得出15个气象站点中5个站点具有上升趋势,10个站点具有下降趋势,但具有显著上升和显著下降趋势的站点均只有1个。从突变检验的结果(图 4)来看,ET0在1978年发生减少的突变,而进入20世纪90年代以后又呈不断增加的趋势。

|
| 图 4 1961—2005年泾河流域年ET0的变化趋势及突变情况 Fig. 4 The temporal trend and abrupt change of Annual ET0 in the Jinghe watershed during 1961—2005 |
泾河流域1961—2005年ET0的年内分布随月份变化呈单峰曲线变化。ET0自1月开始快速上升在6月达到最大,之后逐渐减小,12月出现最小值。ET0的季节分布为夏季>春季>秋季>冬季。春夏秋冬ET0分别占多年平均ET0的30.7%、41.8%、17.5%和9.8%。高温低湿,强辐射,长日照,与夏季ET0高值的形成密切相关。
2.2 2011—2099年的ET0趋势预测 2.2.1 SDSM降尺度效果评估由于降尺度的各环节中存在一些不确定性,故非常必要对统计降尺度模型的效果进行评估,从而为未来ET0预测的可靠性提供参考。由泾河流域ET0计算值与模拟值的日序列散点图(图 5),可以看出,线性回归的斜率和决定系数均接近1;率定期和验证期的模型效率系数分别为0.76和0.82。因此,根据决定系数和模型效率系数对模拟精度的评定标准,认为SDSM对流域ET0的降尺度效果较好,且在泾河流域具有较好的适用性,可用于该流域未来ET0的降尺度预测,预测结果具有一定的可靠性。

|
| 图 5 泾河流域率定期及验证期日ET0计算与模拟值比较 Fig. 5 Comparison of daily ET0 between calculated and downscaled series of Jinghe watershed during calibration and validation period |
未来3个时期泾河流域ET0的空间分布在A2和B2情景下基本相似,故仅给出ET0在21世纪80年代时期B2情景下变化的空间分布(图 6)。可以看出,未来流域内ET0将普遍增大,但增幅存在空间变异;东部区域增幅最大,到21世纪80年代ET0将普遍增加12%以上;西部ET0增幅相对较小,特别是西南部地区增幅最小(<3%)。1961—2005年流域北部属于ET0高值区,而此区未来ET0增幅较小,将导致高值区逐渐集中到流域的东南部。因此,泾河流域21世纪ET0的空间分布将基本保持现有模式,但区域差异将随时间的推移不断增大。

|
| 图 6 B2情景下21世纪80年代泾河流域ET0变化的空间分布 Fig. 6 The spatial distribution of potential evapotranspiration change of Jinghe watershed in 2080s under the B2 scenario |
21世纪泾河流域ET0总体上在两种排放情景下均显著上升,2049年开始呈现显著上升趋势,2061年发生突变(图 7),但A2情景下ET0的变化速度较B2情景大,分别为1.9 mm/a和0.9 mm/a。同时趋势检验结果表明,13个站点(总数15个)的ET0在A2和B2情景下未来3个时期均显著增加,1个站点(甘肃平凉)不显著,1个站点(甘肃环县)A2情景下变化显著而B2情景下不显著。可见,泾河流域21世纪ET0的上升趋势具有普遍性。

|
| 图 7 泾河流域2011—2099年A2、B2情景下的年ET0变化及B2情景下未来ET0的突变情况 Fig. 7 Temporal change of annual ET0 under the two emission scenarios A2 and B2 from 2011 to 2099 and the abrupt of future ET0 under B2 scenario in the Jinghe watershed |
从泾河流域未来3个时期(21世纪20,50,80年代)各月ET0较基准期的变化(图 8),可以看出,不论是A2还是B2情景下,增幅最高的月份均为8月。而对于增幅最低月份,A2情景下为12月,B2情景下则为2月。除A2情景下的21世纪20年代和B2情景下的21世纪20年代,80年代增幅最大的季节为春季外,B2情景下21世纪50年代及A2情景下的21世纪50年代和21世纪80年代为夏季增幅最大,也就是说,泾河流域21世纪的ET0增加与夏季ET0的贡献密切相关。

|
| 图 8 泾河流域未来3个时期的月ET0相较于基准期的变化情景 Fig. 8 Scenarios in the change of potential evapotranspiration in the Jinghe watershed in the 3 future periods compared with reference period (percentage difference) |
基于2000年以前数据的相关研究发现全国绝大多数流域和西北地区的蒸发量均呈减少趋势[1, 21, 22, 23, 24],但Liu等基于1961—2006年和李志基于1961—2009年的ET0数据发现黄土高原多数站点的ET0显著增大[25, 26] 。此种差异可能主要由研究时段的选择导致。本研究1961—2005年泾河流域ET0的变化趋势与基于最新数据进行分析的黄土高原的结果[26]相似。上述结果表明,尽管由于数据可得性,本研究仅使用1961—2005年的数据对当前时段ET0进行分析,但相关研究结果是可信的。21世纪泾河流域ET0的变化趋势与黄土高原[27]及渭河流域[28]的相关研究结果一致。
预测的ET0具有广泛的用途,例如结合降水使用干旱指数(Aridity index,AI= ET0/P),可以评估区域的干湿状况。基于降尺度预测的ET0和同时预测的降水变化(结果未给出),发现泾河流域21世纪干旱指数在A2和B2情景下都呈显著的增大趋势(图 9),表明泾河流域21世纪可能受干旱威胁更加严重,且21世纪后半叶干旱最为严重。按照干旱指数对干湿状态的界定(湿润:0.375≤AI<0.75;半湿润: 0.75≤AI<2;半干旱:2≤AI<5;干旱:5≤AI<12)[29],1961—2005年泾河流域虽属于半湿润半干旱的过渡区域,但大部区域是半湿润地区(图 10);然而即使是估算比较保守的B2情景下,泾河流域21世纪80年代已经基本全部变为半干旱区。可见,泾河流域21世纪的干旱状况会随时间加剧,同时受影响区域会不断扩展,这必然会影响该区的农业生产和生态建设,需提前采取措施减缓这些不利影响。

|
| 图 9 SDSM降尺度预测下泾河流域21世纪的干旱指数 Fig. 9 The aridity index of 21st century in the Jinghe watershed using statistical downscaling projection |

|
| 图 10 泾河流域1961—2005年干旱指数及B2情景下21世纪80年代干旱指数的空间分布 Fig. 10 The distribution of aridity index in current period (1961—2005) and 2080s under B2 scenario in the Jinghe watershed |
为降低气候预测的不确定性,通常使用多个GCM在多种排放情景下的数据进行相关研究。由于数据可得性,本研究只采用了HadCM3这一模式,但相关研究表明HadCM3在中国具有较好的适用性[30, 31, 32],因此可在一定程度上降低GCM带来的不确定性。降尺度方法也是不确定性的重要来源,特别是使用SDSM进行降水预测时效果往往较差,但研究表明SDSM在温度和蒸散发等方面的降尺度效果较好[27, 31],这从本研究中的降尺度效果评估也能反映出来。基于上述不确定性,需在其他GCM预报因子能够获取时继续开展深入研究,对本研究结果进行验证。
4 结论本研究在分析泾河流域1961—2005年ET0的时空特征的基础上,应用SDSM统计降尺度模型基于HadCM3在A2、B2情景下的数据对泾河流域21世纪的ET0进行了预测。结果表明,1961—2005年泾河流域ET0年均值为934.6 mm;空间分布上,ET0自东部向西南方向递减;时间变化上,呈不显著的上升趋势。21世纪泾河流域ET0将普遍增长,空间分布将基本保持现有模式,但区域差异将随时间推移不断增大;ET0总体上处于显著上升趋势。ET0的变化将加剧泾河流域的干旱状况,导致水资源短缺,威胁该区的农业生产和生态建设,因此,需提前采取应对措施。
| [1] | Yu D P, Zhang X, He Y. Temporal-spatial variations of reference crop evapotranspiration in eastern plateau agricultural region of Qinghai province. Transactions of the Chinese Society of Agriculture Engineering, 2012, 28(2): 66-71. |
| [2] | Chen S Y, Zhang K L, Xing X B, Dong A X. Climatic change of sunshine duration in Northwest China during the last 47 years. Journal of Natural Resources, 2010, 25(7): 1142-1152. |
| [3] | Lu A G, Xiong Y C. Systematic change in air humidity in China over last 50 years under global climate change. Research of Soil and Water Conservation, 2013, 20(1): 141-143. |
| [4] | Ma Z G, Ren X B. Drying trend over China from 1951 to 2006. Advances in Climate Change Research, 2007, 3(4): 195-201. |
| [5] | Ren Z X, Yang D Y. Trend and characteristics of climatic change in arid region of Northwest China in resent 50 years. Journal of Earth Sciences and Environment, 2007, 29(1): 99-102. |
| [6] | Zhang Q, Zhang C J, Bai H Z, Li L, Sun L D, Wang J S, Zhao H Y. New development of climate change in Northwest China and its impact on arid environment. Journal of Arid Meteorology, 2010, 28(1): 1-7. |
| [7] | Kang S Z, Xu D, Li W H. Water problem to sustainable agriculture development in dryland of northwest China in the 21st century and the way to deal with it. Science Foundation in China, 2002, 16(5): 20-24. |
| [8] | Yao Y B, Xiao G J, Wang R Y, Zhang X Y. Climatic changes of semi-arid region over the northwest China in recent 50a. Arid Land Geography, 2009, 32(2): 159-165. |
| [9] | Du X L, Wei L, Huang S P, Liu W Y. Calculation of evaporation and its application on evaluating water resources of Agriculture in Jiangxi Province. Chinese Journal of Agrometeorology, 2005, 26(3): 161-164. |
| [10] | Liu Y, Wang Y, Yang X G. Trends in reference crop evapotranspiration and possible climatic factors in the North China Plain. Acta Ecologica Sinica, 2010, 30(4): 923-932. |
| [11] | Yin Q F, Cai H J, Wang J. Experimental study on winter wheat field evaporation. Journal of Irrigation and Drainage, 2000, (4): 1-4. |
| [12] | Liu X Y, Li Y Z, Hao W P. Trend and causes of water requirement of main crops in North China in recent 50 years. Transactions of the Chinese Society of Agriculture Engineering, 2005, 19(10): 155-159. |
| [13] | Wang Y, Zhao C Y, Tian F X, Wang C. Spatial variation of water requirement for spring wheat in the middle reaches of Heihe River basin. Acta Ecologica Sinica, 2011, 31(9): 2374-2382. |
| [14] | Zhang B, Zhang D F. Responses of reference crop evapotranspiration in Loess Plateau of Northwest China to climate change in 1961—2010 and estimation of future trend. Chinese Journal of Ecology, 2013, 32(3): 733-740. |
| [15] | Zhang J P, Wang C Y, Yang X G, Zhao Y X, Liu Z J, Wang J, Chen Y Y. Impact forecast of future climate change on maize water requirement in three provinces of Northeast China. Transactions of the Chinese Societyof Agriculture Engineering, 2009, 25(7): 50-55. |
| [16] | Ma J H, Liu Y, Yang X G, Wang W F, Xue C Y, Zhang X Y. Characteristics of climate resources under global climate change in the North China Plain. Acta Ecologica Sinica, 2010, 30(14): 3818-3827. |
| [17] | Zhang F M, Shen S H. Spatial distribution and temporal trend of reference crop evapotranspiration in China. Journal of Nanjing Institute of Meteorology, 2007, 30(5): 705-709. |
| [18] | Gao G, Chen D L, Ren G Y, Chen Y, Liao Y M. Trend of potential evapotranspiration over China during 1956 to 2000. Geographical Research, 2006, 25(3): 378-387. |
| [19] | Pu Z C, Zhang S Q, Li J L, Huang X, Sun Y Q, Apaer. Change characteristics of reference crop evapotranspiration in Urumqi River Basin. Desert and Oasis Meteorology, 2008, 2(1): 41-45. |
| [20] | Ni G H, Li X H, Cong Z T, Sun F B, Liu Y. Temporal and spatial characteristics of reference evapotranspiration in China. Transactions of the Chinese Society of Agriculture Engineering, 2006, 22(5): 1-4. |
| [21] | Wang Y Q, Fan J, Shao M A, Bai YR. Analysis of effects of climate change on reference evapotranspiration on the Loess Plateau in recent 50 years. Transactions of the Chinese Society of Agriculture Engineering, 2008, 24(9): 6-10. |
| [22] | Sun X Z, Feng Z M, Yang Y Z. Change Tendency of reference crop evapotranspiration in Xiliaohe Basin. Resources Science, 2009, 31(3): 479-484. |
| [23] | Li Z. Spatiotemporal variations in the reference crop evapotranspiration on the Loess Plateau during 1961—2009. Acta Ecologica Sinica, 2012, 32(13): 4139-4145. |
| [24] | Solomon S, Qin M M, Chen M M, Averyt K B, Tignor M, Miller H L. Climate Change 2007: The Physical Science Basis. Cambridge: Cambridge University Press, 2007. |
| [25] | Li Z, Zhao X N. Spatiotemporal analysis of meteorological elements on the Loess Plateau during 1961—2009. Journal of Natural Resources, 2013, 28(2): 287-299. |
| [26] | Cao W, Shen S H, Duan C F. Temporal-spatial variations of potential evapotranspiration and quantification of the causes in Northwest China. Acta Ecologica Sinica, 2012, 32(11): 3394-3403. |
| [27] | Duan C F, Miu Q L, Cao W. Changing characteristics of reference crop evapotranspiration and main causes in the Northwest China. Transactions of the Chinese Society of Agricultural Engineering, 2011, 27(8): 77-83. |
| [28] | Yin Y H, Wu S H, Dai E F. Determining factors in potential evapotranspiration changes over China in the period 1971—2008. Chinese Science Bulletin, 2010, 55(29): 3329-3337. |
| [29] | Du J Q, Shu J M, Liu C C, Wang L X, Guo Y, Zhang L B. Variation characteristics of reference crop evapotranspiration and its responses to climate change in upstream areas of Yellow River basin. Transactions of the Chinese Society of Agricultural Engineering, 2012, 28(12): 92-100. |
| [30] | Liu C M, Zhang D. Temporal and spatial change analysis of the sensitivity of potential evapotranspiration to meteorological influencing factors in China. Acta Geographica Sinica, 2011, 66(5): 579-588. |
| [31] | Tong L, Kang S Z, Su X L. Impacts of climate change on reference crop evapotranspiration in Shiyang River basin. Transactions of the Chinese Society of Agriculture Engineering, 2004, 20(2): 15-18. |
| [32] | Liu Q, Yan C R, Mei X R, Zhang Y Q, Yang J Y, Liang Y S. Spatial evolution of reference crop evapotranspiration in arid area of Northwest China. Chinese Journal of Agrometeorology, 2012, 33(1): 48-53. |
| [33] | Cao W, Shen S H, Duan C F. Quantification of the causes for reference crop evapotranspiration Changes in Growing Season in Northwest China. Acta Ecologica Sinica, 2011, 66(3): 407-415. |
| [34] | Huang R H, Gu L, Chen J L. Recent progresses in studies of the temporal-spatial variations of the East Asian monsoon system and their impacts on climate anomalies in China. Chinese Journal of Atmospheric Sciences, 2008, 32(4): 691-719. |
| [1] | 于东平, 张鑫, 何毅. 青海省东部高原农业区参考作物蒸散量的时空变化. 农业工程学报, 2012, 28(2): 66-71. |
| [2] | 陈少勇, 张康林, 邢晓宾, 董安祥. 中国西北地区近47a日照时数的气候变化特征. 自然资源学报, 2010, 25(7): 1142-1152. |
| [10] | 刘园, 王颖, 杨晓光. 华北平原参考作物蒸散量变化特征及气候影响因素. 生态学报, 2010, 30(4): 923-932. |
| [12] | 刘晓英, 李玉中, 郝卫平. 华北主要作物需水量近50年变化趋势及原因. 农业工程学报, 2005, 19(10): 155-159. |
| [13] | 王瑶, 赵传燕, 田风霞, 王超. 黑河中游春小麦需水量空间分布. 生态学报, 2011, 31(9): 2374-2382. |
| [14] | 张勃, 张调风. 1961-2010年黄土高原地区参考作物蒸散量对气候变化的响应及未来趋势预估. 生态学杂志, 2013, 32(3): 733-740. |
| [15] | 张建平, 王春乙, 杨晓光, 赵艳霞, 刘志娟, 王靖, 陈艳英. 未来气候变化对中国东北三省玉米需水量的影响预测. 农业工程学报, 2009, 25(7): 50-55. |
| [16] | 马洁华, 刘园, 杨晓光, 王文峰, 薛昌颖, 张晓煜. 全球气候变化背景下华北平原气候资源变化趋势. 生态学报, 2010, 30(14): 3818-3827. |
| [17] | 张方敏, 申双和. 我国参考作物蒸散的空间分布和时间趋势. 南京气象学院学报, 2007, 30(5): 705-709. |
| [18] | 高歌, 陈德亮, 任国玉, 陈峪, 廖要明. 1956-2000年中国潜在蒸散量变化趋势. 地理研究, 2006, 25(3): 378-387. |
| [19] | 普宗朝, 张山清, 李景林, 黄新, 孙月琴, 阿帕尔. 乌鲁木齐河流域参考作物蒸散量时空变化特征. 沙漠与绿洲气象, 2008, 2(1): 41-45. |
| [20] | 倪广恒, 李新红, 丛振涛, 孙福宝,刘钰. 中国参考作物腾发量时空变化特性分析. 农业工程学报, 2006, 22(5): 1-4. |
| [21] | 王幼奇, 樊军, 邵明安, 白一茹. 黄土高原地区近50年参考作物蒸散量变化特征. 农业工程学报, 2008, 24(9): 6-10. |
| [22] | 孙小舟, 封志明, 杨艳昭. 西辽河流域1952年-2007年参考作物蒸散量的变化趋势. 资源科学, 2009, 31(3): 479-484. |
| [23] | 李志. 黄土高原1961-2009年参考作物蒸散量的时空变异. 生态学报, 2012, 32(13): 4139-4145. |
| [25] | 李志, 赵西宁. 1961-2009年黄土高原气象要素的时空变化分析. 自然资源学报, 2013, 28(2): 287-299. |
| [26] | 曹雯, 申双和, 段春锋. 中国西北潜在蒸散时空演变特征及其定量化成因. 生态学报, 2012, 32(11): 3394-3403. |
| [27] | 段春锋, 缪启龙, 曹雯. 西北地区参考作物蒸散变化特征及其主要影响因素. 农业工程学报, 2011, 27(8): 77-83. |
| [28] | 尹云鹤, 吴绍洪, 戴尔阜. 1971-2008年我国潜在蒸散时空演变的归因. 科学通报, 2010, 55(22): 2226-2234. |
| [29] | 杜加强, 舒俭民, 刘成程, 王丽霞, 郭扬, 张林波. 黄河上游参考作物蒸散量变化特征及其对气候变化的响应. 农业工程学报, 2012, 28(12): 92-100. |
| [30] | 刘昌明, 张丹. 中国地表潜在蒸散发敏感性的时空变化特征分析. 地理学报, 2011, 66(5): 579-588. |
| [31] | 佟玲, 康绍忠, 粟晓玲. 石羊河流域气候变化对参考作物蒸发蒸腾量的影响. 农业工程学报, 2004, 20(2): 15-18. |
| [32] | 刘勤, 严昌荣, 梅旭荣, 张燕卿, 杨建莹, 梁瑜珊. 西北旱区参考作物蒸散量空间格局演变特征分析. 中国农业气象, 2012, 33(1): 48-53. |
| [33] | 曹雯, 申双和, 段春锋. 西北地区生长季参考作物蒸散变化成因的定量分析. 地理学报, 2011, 66(3): 407-415. |
| [34] | 黄荣辉, 顾雷, 陈际龙. 东亚季风系统的时空变化及其对我国气候异常影响的最近研究进展. 大气科学, 2008, 32(4): 691-719. |