 2014, Vol. 34
文章信息
- 王小静, 李志, 赵姹, 张志强
- WANG Xiaojing, LI Zhi, ZHAO Cha, ZHANG Zhiqiang
- 西北旱区1961-2011年参考作物蒸散量的时空分异
- Spatiotemporal variations of the reference crop evapotranspiration in the arid region of northwest China during 1961-2011
- 生态学报, 2014, 34(19): 5609-5616
- Acta Ecologica Sinica, 2014, 34(19): 5609-5616
- http://dx.doi.org/10.5846/stxb201306101619
-
文章历史
- 收稿日期:2013-6-10
- 修订日期:2014-7-13


参考作物蒸散量(ET0)是非常重要的农业气象变量,是制定作物灌溉制度、统筹农业需水量的主要参考[1]。ET0是各气象因子综合作用的结果,而全球气候变化背景下温度、湿度、日照时数等气象变量发生了显著的变化[2, 3, 4, 5, 6],因此,ET0可能受到的影响及发生的变化需进行评估,从而为农业生产提供参考。
我国西北旱区包括陕西、宁夏、甘肃、青海、新疆及内蒙古等地区,土地面积约占全国总面积的42%,但由于水资源数量有限,加之干旱蒸发强烈,导致水土资源不平衡,特别是水资源过度开发产生了严重的生态环境问题,并影响农业生产[7, 8, 9, 10]。为此,探讨合理的水土资源配置模式非常重要。ET0作为水资源管理和农业生产中的重要变量,是统筹农业用水、规划灌溉用水、提高用水效率的重要依据[11, 12, 13, 14, 15]。结合温度、风速、日照时数等气象资料分析ET0的变化,可为该区的水土资源优化配置提供重要的基础信息。
不少研究对我国及西北地区的ET0变化进行了分析。多数研究结果表明我国年平均ET0整体呈下降趋势,但存在区域差异[10, 16, 17, 18]。对西北地区ET0而言,目前的研究结果存在一定差异。如普宗朝等发现乌鲁木齐河流域1978—2002年ET0下降趋势明显[19],这与王幼奇等对黄土高原1954—2000年及倪广恒等对1976—2000年干旱半干旱地区的分析结果一致[20, 21];而孙小舟发现西辽河流域1952—2007年ET0呈上升趋势[22],这与李志对黄土高原地区1961—2009年ET0变化趋势的研究结论相似[23]。可见,这些研究结果的差异可能主要是由于研究时段和区域差异造成的。同时,近年来全球气候变化更加显著[24],黄土高原出现了由暖干向暖湿变化的新趋势[25],1993年以后旱区ET0可能由之前的下降趋势转变为上升趋势[26, 27]。因此,针对整个西北旱区、基于长序列的最新气象资料来探究旱区ET0可能发生的新趋势,显得尤为重要。
为了明确西北旱区ET0在全球气候变暖背景下的趋势变化,本研究基于广泛分布在西北旱区的152个气象站点数据分析了旱区1961—2011年ET0的空间分布和时间变化特征,并定性和定量探讨了引起ET0变化的原因,以期为旱区农业生产和水分利用提供参考依据。
1 数据与方法 1.1 数据来源与处理基于广泛分布在西北旱区的152个气象站点1961—2011年日气象资料计算ET0。152个站点分布在新疆、青海、内蒙、陕西、甘肃等省份(图 1)。气象变量包括最高温度(℃)、最低温度(℃)、日照时数(h)、相对湿度(%)、风速(m/s)等。少数缺失数据使用相邻站点的数据插补。

|
| 图 1 西北旱区气象站点分布 Fig. 1 Location of the meteorological stations in the arid region of northwest China |
采用联合国粮农组织(FAO)推荐的Penman-Monteith计算ET0:

净辐射Rn的精确性取决于经验系数,而经验系数有地区局限性,针对特定地区其值不同,本文采用尹云鹤在对我国1971—2008年潜在蒸散时空分布研究中采用的方法[28],其经过校正的辐射值Rn:

数据处理严格按照FAO的规程进行操作,ET0的月值和年值由逐日ET0值加和获得。
1.3 ET0的时空分布对ET0进行了空间分布、单调变化趋势和突变年份等方面的分析。其中,空间分析使用反距离权重法对气象因素进行空间插值,该方法假设样点间存在局部影响且随距离越远其影响越小,站点间气候因子间的影响符合此规律;单调变化趋势使用Mann-Kendall检验,显著性水平为95%;突变年份使用Pettitt分析。
1.4 ET0时空变异原因分析从定性和定量两种方法分别探讨ET0时空变异与气象因子(温度、湿度、风速和日照时数)的关系。定性方法主要分析4种气象因子的空间分布特征和时间变化趋势,进而探讨其与ET0时空变异的关系。
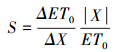
定量方法通过敏感分析进行,用以确定对ET0影响最大的因子和对ET0变化贡献率最高的因子。首先需要计算相对敏感系数,主要根据Taylor 级数展开的有限差分近似求解:
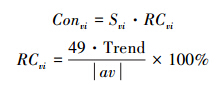
相对敏感系数代表气象因子变化导致的ET0变化幅度,但相对敏感系数大的气象因子是否对ET0变化的贡献大,需要引入气象因子的多年相对变化量:
1961—2011年,西北旱区ET0的年均值为1100.4mm/a,介于720.6 mm/a(新疆七角井)—1930.6 mm/a(新疆巴音布鲁克)。ET0存在一定的空间差异,变异系数为0.18,属中等变异。但整体而言大部分地区的ET0介于950—1200mm/a;黄土高原南部靠近秦岭的区域是ET0的低值中心,年均ET0低于900mm/a;ET0较高的区域出现在西北部沿东南-西北方向的条带上,包括新疆东南部、甘肃西北部和内蒙中部,年均值大于1350mm/a。

|
| 图 2 1961—2011年西北旱区ET0空间分布 Fig. 2 The spatial distribution of annual average ET0in the northwest arid region during 1961—2011 |
1961—2011年西北旱区ET0整体呈不显著的上升趋势(图 3)。但其单调变化趋势呈混合模式,96和56个站点分别呈上升和下降趋势,通过95%显著性检验的站点分别为64和36个。单调变化趋势存在一定的空间差异(图 3),可以看出,黄土高原以西地区ET0基本呈下降趋势;黄土高原及其以东地区主要呈上升趋势。

|
| 图 3 1961—2011西北旱区ET0时间变化趋势 Fig. 3 The temporal trend of ET0 in the northwest arid region during 1961—2011 |
为进一步分析ET0的时间变化趋势,进行了突变年份检验。可以看出,ET0突变年份主要发生在20世纪70、80、90年代,而60年代和21世纪很少(图 4)。同时,ET0的突变年份存在空间差异。黄土高原以西的区域,ET0突变主要发生在70和80年代;而黄土高原及其以东地区,突变年份主要在80和90年代,甚至进入21世纪也有发生突变的站点。可见,西北旱区东部ET0突变发生的年份较黄土高原以西的区域晚。

|
| 图 4 1961—2011年西北旱区ET0的突变年份 Fig. 4 The distribution of abrupt year of ET0 during 1961—2011 |
ET0的空间变异是温度(最低与最高温度空间分布图一致故略)、相对湿度、日照时数及风速等气象因子空间分布综合作用的结果(图 5)。一般来说,高温、长日照、低湿度会导致高蒸散[20]。可以看出,长日照时数、低相对湿度和高风速导致西北部沿东南-西北方向条带上ET0值较高,而低温高湿则是黄土高原南部靠近秦岭地区ET0最低的原因。ET0与相对湿度和风速基本具有相似的空间分布模式。为进一步量化ET0与气象因子的相关性,求取了ET0与各因子的相关系数,发现ET0与相对湿度的相关性最高(0.37),其次为风速(0.36)、最高温度(0.30)、日照时数(0.21)和最低温度(0.19)。可见,西北旱区ET0对相对湿度最敏感,这与相关研究在石羊河流域、黄土高原、黄河流域和全国的结论一致[23, 28, 29, 30, 31]。

|
| 图 5 1961—2011年西北旱区影响ET0相关气象要素的空间分布 Fig. 5 The spatial distribution of meteorological factors affecting ET0on the northwest arid region during 1961—2011 |
为分析各种气象因子变化对ET0的影响,表 1给出了其单调变化趋势(表 1)。西北旱区存在温度上升,而相对湿度、日照日数和风速降低的变化趋势。一般而言,温度变化对ET0具有支配性地位,但尽管最高与最低温度都呈上升趋势,特别是在基本所有站点的最低温度都通过了95%置信区间检验呈显著上升趋势的增温背景下,仍有1/3的站点ET0呈下降趋势,表明西北旱区ET0变化受气象因子的综合作用。
| 气象要素 Meteorological factors | 上升趋势Upward | 下降趋势Downward | 增幅β /10a-1 | 无趋势 No trend | ||
| 站点数 n | 显著站数 n-sig | 站点数 n | 显著站数 n-sig | |||
| n:站点数Number of stations;n-sig:各趋势的显著站数Number of stations with significant trend;β:气象变量变幅Mean change magnitude of meteorological factors | ||||||
| 参考作物蒸散量 Reference crop evapotranspiration | 96 | 64 | 56 | 36 | 4.46 | 0 |
| 最高温度Maximum temperature | 146 | 140 | 3 | 0 | 0.27 | 3 |
| 最低温度Minimum temperature | 147 | 144 | 2 | 2 | 0.46 | 3 |
| 相对湿度Relative humidity | 52 | 20 | 96 | 50 | -0.25 | 4 |
| 日照时数Sunhrs | 41 | 19 | 107 | 67 | -0.05 | 4 |
| 平均风速Wind speed | 19 | 9 | 130 | 105 | -0.15 | 3 |
对气象因子进行突变分析发现(图 6),与ET0相似,气象因子的突变也都发生在70—90年代,而60年代和2000—2010年各因子发生突变的站点都较少。70—90年代ET0的突变站点数相似,但气象因子的突变站点数差异较大,70年代相对湿度和日照时数发生突变较多,80年代各因子都有较多站点发生突变,90年代各气象因子的突变站点数很相似。这说明ET0的突变是受各因子的突变影响,但可能在不同年代主要的影响因子不同。

|
| 图 6 1961—2011年西北旱区气象变量突变年份 Fig. 6 The abrupt year of meteorological factors in the northwest arid region during1961—2011 |
西北旱区ET0对相对湿度的敏感性为负值,表明如果其他气候因子不变,相对湿度增加则导致ET0减少;ET0对最高与最低温度、日照时数和风速的敏感性为正值。ET0对相对湿度(-0.45)和最高温度(0.45)敏感性最高,即若其它气候因子不变,相对湿度增加10%会导致ET0减少4.5%,而最高温度升高10%则导致ET0增加4.5%;ET0对其他因子的敏感性依次为风速(0.31)、日照时数(0.23)和最低温度(0.01)。这很好地解释了ET0与相对湿度的相关性,与曹雯对西北旱区ET0的研究结论一致[26, 32]。
基于ET0对气象因子的敏感性系数进而计算其贡献率,发现风速对ET0的贡献率最大(-9.50%),其次为最高温度(4.88%)、相对湿度(1.01%)、日照时数(-0.76%)和最低温度(0.17%)。可见,风速和最高温度是1961—2011年西北旱区ET0变化的主要因子;ET0对相对湿度的敏感性高,但由于其相对变化小导致其贡献率不大,这与曹雯和尹云鹤等等的结论一致[28, 33]。同时,需要注意的是,导致变化的主导因子存在区域差异,风速作为最主要的主导因子,其分布遍布整个区域;但温度作为主导因子的站点主要在西北旱区东部(图 7)。

|
| 图 7 1961—2011年ET0变化的主导因子 Fig. 7 The dominant meteorological factors of ET0 in the northwest arid region during 1961—2011 |
虽然风速、日照时数等下降会引起ET0的下降趋势,但本文的研究表明ET0呈不显著上升,这说明对ET0敏感性较高的相对湿度及温度引起的ET0上升略高于由风速等因子引起的ET0下降,1961—2011年ET0不显著上升趋势很有可能是温度及相对湿度等上升导致,因此,ET0整体呈现不显著上升趋势。
4 结论基于我国西北旱区152个气象站1961—2011年温度、相对湿度、日照时数、风速等气象因子计算ET0并分析其时空分异规律。1961—2011年西北旱区ET0年均值为1100.4 mm,黄土高原南部靠近秦岭的区域是低值中心,西北部沿东南-西北方向的条带为高值中心。 ET0整体呈不显著上升趋势,但64和36个站点分别呈显著的上升和下降趋势;西北旱区ET0发生突变的年份东部较西部晚。ET0的时空变异是气象因子时空变化的组合效应,ET0对相对湿度和最高温度的变化最敏感,但过去50年ET0变化风速的贡献率最大。
| [1] | Gao G, Chen D L, Ren G Y, Chen Y, Liao Y M. Trend of potential evapotranspiration over China during 1956 to 2000. Geographical Research, 2006, 25(3): 378-387. |
| [2] | Peterson T C, Golubev V S, Groisman P Y. Evaporation losing its strength. Nature, 1995, 377(6551): 687-688. |
| [3] | Brutsaert W, Parlange M B. Hydrologic cycle explains the evaporation paradox. Nature, 1998, 396(6706): 30-30. |
| [4] | Yao Y B, Wang Y R, Li Y H, Zhang X Y. Climate warming and drying and its environmental effects in The Loess Plateau. Resources Science, 2005, 27(5): 146-152. |
| [5] | Chen C C, Xie G D, Zhen L. Characters of precipitation variation in Jinghe Watershed. Resource Scicence, 2007, 29(2): 172-177. |
| [6] | Li Z, Liu W Z, Zheng F L. Trends of extreme temperature events in Jinghe Watershed during 1965—2005. Scientia Geographica Sinica, 2010, 30(3): 469-474. |
| [7] | Li Z, Liu W Z, Zheng F L. Analyzing variation trends in extreme precipitation events in the Jing River watershed during 1965—2005. Resources Science, 2010, 32(8): 1527-1532. |
| [8] | Chen C, Luo J G, Xie J C, Xiao J. Trend and characters of annual runoff in Jinghe River for last 80 years. Yellow River, 2013, 35(1): 26-28, 38-38. |
| [9] | Cheng G D, Wang G X. Changing trend of drought and drought disaster in northwest China and countermeasures. Earth Science Frontiers, 2006, 13(1): 3-14. |
| [10] | Yang X L, Wang L N. Variation characteristics of reference crop evapotranspiration of typical stations in upper basin of the Jinghe River in recent 45 years. Agricultural Research in the Arid Areas, 2012, 30(6): 238-242. |
| [11] | Wang P, Qiu G Y, Yin J, Xiong Y J, Xie F. Spatial Distribution and temporal trend of temperature and pan evaporation in Jinghe River Basin. Arid Meteorology, 2008, 26(1): 17-22. |
| [12] | Zhang S L, Yu P T, Wang Y H, Zhang H J, Valentina K, Huang S C, Xiong W, Xu L H. Estimation of actual evapotranspiration and its component in the upstream of Jinghe Basin. Acta Geographica Sinica, 2011, 66(3): 385-395. |
| [13] | Zhang S L, Yu P T, Zhang H J, Gao W, Wang Y H. Impact of climate change on the hydrological process in medium scale basin of arid areas. Journal of Arid Land Resources and Environment, 2013, 27(10): 70-74. |
| [14] | Li Z, Zhao X N. Spatiotemporal analysis of meteorological elements on the Loess Plateau during 1961—2009. Journal of Natural Resources, 2013, 28(2): 287-299. |
| [15] | IPCC. Special Report on Emissions Scenarios. Cambridge: Cambridge University Press, 2000. |
| [16] | Willby R L, Wigley T M L. Downscaling general circulation model output: A review of methods and limitations. Progress in Physical Geography, 1997, 21(4): 530-548. |
| [17] | Fan L J, Fu C B, Chen D L. Review on creating future climate change scenarios by statistical downscaling techniques. Advance in Earth Science, 2005, 20(3): 320-329. |
| [18] | IPCC. Emissions scenarios, special report of the intergovernmental panel on climate change. Cambridge: Cambridge University Press, 2000. |
| [19] | Shi X Y, Xu X D, Xu Y. Comparison of temperature between six hundreds stations in China and output of IPCC models. Meteorological Monthly, 2005, 31(7): 49-53. |
| [20] | Allen R G, Pereira L S, Raes D, Smith M. Crop evapotranspiration: guidelines for computing crop water requirements. FAO Irrigation and Drainage Paper No 56, Rome, 1998. |
| [21] | Ding Y H, Ren G Y, Shi G Y, Gong P, Zheng X H, Zhai P M, Zhang D E, Zhao Z C, Wang S W, Wang H J, Luo Y, Chen D L, Gao X J, Dai X S. National assessment report on climate change (I): Climate change in China and the future trend. Advances in Climate Change Research, 2006, 2(1): 3-8. |
| [22] | Xie X Q, Wang L. Changes of potential evaporation in Northern China over the past 50 years. Journal of Natural Resources, 2007, 22(5): 683-691. |
| [23] | Xu C Y, Gong L B, Jiang T, Chen D L, Singh V P. Analysis of spatial distribution and temporal trend of reference evapotranspiration and pan evaporation in Changjiang (Yangtze River) catchment. Journal of Hydrology, 2006, 327(1/2): 81-93. |
| [24] | Wang P X, Yang J H, Zhang Q, He J H, Wang D M, Lu D R. Climate change characteristic of northwest China in recent half century. Advances in Earth Science, 2007, 22(6): 649-656. |
| [25] | Liu Q, Yang Z F, Cui B S, Tao S. The temporal trends of reference evapotranspiration and its sensitivity to key meteorological variables in the Yellow River Basin, China. Hydrological Processes, 2010, 24(15): 2171-2181. |
| [26] | Li Z. Spatiotemporal variations in the reference crop evapotranspiration on the Loess Plteau during 1961—2009. Acta Ecologica Sinica, 2012, 32(13): 4139-4145. |
| [27] | Li Z, Zheng F L, Liu W Z. Spatiotemporal characteristics of reference evapotranspiration during 1961—2009 and its projected changes during 2011-2099 on the Loess Plateau of China. Agricultural and Forest Meteorology, 2012, 154-155: 147-155. |
| [28] | Zuo D P, Xu Z X, Liu Z F. Comparison of temperature-based methods for estimating potential evapotranspiration in the arid region of Northwest China. Journal of Arid Land Resources and Environment, 2009, 23(10): 123-131. |
| [29] | Arora V K, Tsang C F. The use of aridity index to assess climate change effect on annual runoff. Journal of Hydrology, 2002, 265(1/4): 164-177. |
| [30] | Liu L L, Liu Z F, Xu Z X. Trends of climate change for the upper-middle reaches of the Yellow River in the 21st century. Advances in Climate Change Research, 2008, 4(3): 167-172. |
| [31] | Huang J X, Xu Z X, Liu Z F, Zhao F F. Analysis of future climate change in the Taihu Basin using statistical downscaling. Resources Sciences, 2008, 30(12): 1811-1817. |
| [32] | Chu J T, Xia J, Xu C Y. Suitability analysis of SDSM model in th Haihe River Basin. Resources Sciences, 2008, 30(12): 1825-1832. |
| [1] | 高歌, 陈德亮, 任国玉, 陈峪, 廖要明. 1956-2000年中国潜在蒸散量变化趋势. 地理研究, 2006, 25(3): 378-387. |
| [4] | 姚玉璧, 王毅荣, 李耀辉, 张秀云. 中国黄土高原气候暖干化及其对生态环境的影响. 资源科学, 2005, 27(5): 146-152. |
| [5] | 陈操操, 谢高地, 甄霖. 泾河流域降雨量变化特征分析. 资源科学, 2007, 29(2): 172-177. |
| [6] | 李志, 刘文兆, 郑粉莉. 1965-2005年泾河流域极端温度事件变化特征. 地理科学, 2010, 30(3): 469-474. |
| [7] | 李志, 刘文兆, 郑粉莉. 1965年至2005年泾河流域极端降水事件的变化趋势分析. 资源科学, 2010, 32(8): 1527-1532. |
| [8] | 陈晨, 罗军刚, 解建仓, 肖洁. 泾河流域近80 a径流变化趋势及特征分析. 人民黄河, 2013, 35(1): 26-28, 38-38. |
| [9] | 程国栋, 王根绪. 中国西北地区的干旱与旱灾--变化趋势与对策. 地学前缘, 2006, 13(1): 3-14. |
| [10] | 杨小利, 王丽娜. 泾河上游典型站近45年参考作物蒸散量变化特征. 干旱地区农业研究, 2012, 30(6): 238-242. |
| [11] | 王佩, 邱国玉, 尹婧, 熊育久, 谢芳. 泾河流域温度与器皿蒸发量时空特征及变化趋势. 干旱气象, 2008, 26(1): 17-22. |
| [12] | 张淑兰, 于澎涛, 王彦辉, 张海军, Valentina K, Huang S C, 熊伟, 徐丽宏. 泾河上游流域实际蒸散量及其各组分的估算. 地理学报, 2011, 66(3): 385-395. |
| [13] | 张淑兰, 于澎涛, 张海军, 高娃, 王彦辉. 气候变化对干旱缺水区中尺度流域水文过程的影响. 干旱区资源与环境, 2013, 27(10): 70-74. |
| [14] | 李志, 赵西宁. 1961-2009年黄土高原气象要素的时空变化分析. 自然资源学报, 2013, 28(2): 287-299. |
| [17] | 范丽军, 符淙斌, 陈德亮. 统计降尺度法对未来区域气候变化情景预估的研究进展. 地球科学进展, 2005, 20(3): 320-329. |
| [19] | 施小英, 徐祥德, 徐影. 中国600个站气温和IPCC模式产品气温的比较. 气象, 2005, 31(7): 49-53. |
| [21] | 丁一汇, 任国玉, 石广玉, 宫鹏, 郑循华, 翟盘茂, 张德二, 赵宗慈, 王绍武, 王会军, 罗勇, 陈德亮, 高学杰, 戴晓苏. 气候变化国家评估报告(Ⅰ): 中国气候变化的历史和未来趋势. 气候变化研究进展, 2006, 2(1): 3-8. |
| [22] | 谢贤群, 王菱. 中国北方近50年潜在蒸发的变化. 自然资源学报, 2007, 22(5): 683-691. |
| [24] | 王鹏祥, 杨金虎, 张强, 何金海, 王德民, 陆登荣. 近半个世纪来中国西北地面气候变化基本特征. 地球科学进展, 2007, 22(6): 649-656. |
| [26] | 李志. 黄土高原1961-2009年参考作物蒸散量的时空变异. 生态学报, 2012, 32(13): 4139-4145. |
| [28] | 左德鹏, 徐宗学, 刘兆飞. 基于气温的潜在蒸散发量估算方法在我国西北干旱地区的应用比较. 干旱区资源与环境, 2009, 23(10): 123-131. |
| [30] | 刘绿柳, 刘兆飞, 徐宗学. 21世纪黄河流域上中游地区气候变化趋势分析. 气候变化研究进展, 2008, 4(3): 167-172. |
| [31] | 黄俊雄, 徐宗学, 刘兆飞, 赵芳芳. 统计降尺度法分析太湖流域未来气候变化情景. 资源科学, 2008, 30(12): 1811-1817. |
| [32] | 褚健婷, 夏军, 许崇育. SDSM模型在海河流域统计降尺度研究中的适用性分析. 资源科学, 2008, 30(12): 1825-1832. |