 2014, Vol. 34
文章信息
- 赵学春, 来利明, 朱林海, 王健健, 王永吉, 周继华, 姜联合, 马远见, 赵春强, 郑元润
- ZHAO Xuechun, LAI Liming, ZHU Linhai, WANG Jianjian, WANG Yongji, ZHOU Jihua, JIANG Lianhe, MA Yuanjian, ZHAO Chunqiang, ZHENG Yuanrun
- 三工河流域两种琵琶柴群落细根生物量、分解与周转
- Fine root biomass, decomposition and turnover of Reaumuria soongorica communities in the Sangong River basin
- 生态学报, 2014, 34(15): 4295-4303
- Acta Ecologica Sinica, 2014, 34(15): 4295-4303
- http://dx.doi.org/10.5846/stxb201212071765
-
文章历史
- 收稿日期:2012-12-7


2. 中国科学院大学, 北京 100049;
3. 青城山-都江堰旅游景区管理局, 成都 611843
2. University of Chinese Academy of Sciences, Beijing 100049, China;
3. Qingcheng Mountain-Dujiangyan Scenic Spots Authority, Chengdu 611843, China
细根(直径<2 mm)是植物根系的重要组成部分,也是植物根系最活跃的部分[1],决定着植物的生长和发育,其生产力、动态和周转在陆地生态系统的碳循环和养分循环中起着重要作用[2, 3]。研究报道通过细根周转进入土壤中的碳量约占整个生态系统的30%—50%[4, 5],同时植物根系每年消耗约30%的全球净初级生产力[6]。因此精确估测根系生物量及其周转对土壤碳库及全球碳循环的作用具有重要意义[7]。
细根对环境条件的反应最为敏感[8],其垂直生长和水平生长范围除与自身的遗传因素有关外,环境因素尤其是土壤因素起着重要作用[3, 4]。气候、土壤及微环境条件的变化可在不同尺度上显著影响植物群落的细根动态。即使在同一植被带内,由于小环境的变化,也可能造成细根动态的显著变化。关于不同植被类型细根动态的研究已有许多报道[5, 7, 8],但在气候相同、土壤条件类似的区域内,微环境条件变化对类似植物群落细根动态影响的研究较少。
中国西北地区位于亚欧大陆内部,植被类型以荒漠为主,地带性植被主要以琵琶柴( Reaumuria soongorica)、梭梭(Haloxylon ammodendron)、白刺(Nitraria sibirica)、猪毛菜(Salsola collina )为主,其中琵琶柴是新疆荒漠地区分布最广的地带性植被类型之一。琵琶柴亦是新疆阜康三工河流域的典型建群种和优势种,具有极强的抗干旱、耐盐碱特性,对土壤盐碱化改良、植被恢复以及维持荒漠生态系统的稳定性具有重要意义。
干旱区极端的条件决定了荒漠植物细根动态的特殊性。发达的根系、较大的根冠比是荒漠植物利用水分、适应干旱环境的重要方式。其次,细根通过周转可以迅速补充土壤中的有机质和矿质营养[9],通过这种方式进入土壤的有机质是地上凋落物的数倍[10, 11]。由于荒漠植物根系分布较深,荒漠植物细根生产力及周转的研究与森林和草原相比较少[2, 5, 7, 11]。
野外调查中发现,在三工河流域琵琶柴群落典型分布区内,两个相距较近、地形、地貌类似的琵琶柴群落在盖度、高度、生物量等方面存在着很大变化(图 1),琵琶柴群落地上部分的变化是否预示着地下根系,尤其是细根生物量、生产力及周转率是否也会发生相应变化?引起这种变化的原因是什么?这为研究植物根系动态对土壤及其它小环境因素变化的反应提供了很好的研究对象。本文旨在通过野外调查,比较分析两个琵琶柴群落的细根生物量、生产力和周转率及其相应的环境因子,探讨细根动态可能变化的机理,对于阐明细根在荒漠地下碳储量中的作用具有重要意义。
1 材料与方法 1.1 研究区概况研究地点位于新疆昌吉州阜康市境内的三工河流域,天山博格达峰北麓,准葛尔盆地南缘。地理坐标为87°43′—88°44′E,43°45′—45°29′N,总流域面积1670 km2。研究区域内的气候特点是夏季炎热,冬季寒冷,干旱少雨,蒸发剧烈,光照充足,属典型的温带大陆性气候。年平均气温6.6 ℃,最高气温42.6 ℃,最低气温-41.6 ℃;年均降水量164 mm,年均蒸发量1780—2453 mm,年平均日照总数2933 h,冬季平均积雪厚度29 cm,无霜期174 d。
研究区域土壤成土母质以冲积物为主,土壤类型为典型荒漠盐碱土,pH值均大于8.5,土壤生物过程较弱,有机碳含量较低 (<4.0 g/kg)。地带性植被为荒漠植被,其中以柽柳科(Tamaricaceae) 琵琶柴属(Reaumuria)、柽柳属(Tamarix),藜科(Chenopodiaceae) 梭梭属(Haloxylon)、猪毛菜属(Salsola)、碱蓬属 (Suaeda),蒺藜科(Zygophyllaceae)白刺属(Nitraria)、 霸王属(Sarcozygium)为重要建群种。其中,琵琶柴荒漠植被是北疆最典型的植被类型之一。
1.2 样地设置与野外观测在研究区选取两个分布距离较近,但外貌结构具有显著差别的琵琶柴群落,基本情况见表 1和图 1。

|
| 图 1 两个琵琶柴群落的植冠面积、盖度、多度、高度 (平均值±标准误差) Fig. 1 Crown area,coverage,abundance and height of Reaumuria soongorica communities (mean±SE) 不同字母表示在相同时间下群落指标存在显著差异 |
| 群落 Communities | 海拔 Altitude/m | 经纬度 Longitude & latitude | 伴生种 Accompanying species | pH | 土壤类型 Soil types |
| 1 | 485 | N44°20.147′, E88°07.807′ | 角果藜Ceratocarpus arenarius 猪毛菜Salsola collina、 梭梭Haloxylon ammodendron | 8.73 | 荒漠盐碱土 Desert saline soil |
| 2 | 462 | N44°19.090′, E87°50.337′ | 猪毛菜Salsola collina、小果白刺Nitraria sibirica | 9.32 | 荒漠盐碱土 Desert saline soil |
于2010年主要生长季(5—10月)每月月初,在两个琵琶柴群落内分别设置3个25 m×25 m 的样方。采用土柱法测定细根生物量,在每个25 m×25 m的样方内设置3个50 cm×50 cm的采样点,采样点的设置以样方内其中1株琵琶柴为参照,第1个采样点设在在靠近琵琶柴处,第2、第3采样点分别居于此株琵琶柴与相距最近的琵琶柴三分之一和四分之一距离位置。每10 cm垂直挖取土样,直到鲜有根系为止。带回实验室,将土样置于细筛之上用水冲洗,去除其它杂质,仅留直径小于2mm(误差≤0.1 mm)的细根,分别拣出活细根和死细根,烘干后称重。在每个25 m×25 m的样方内,随机选取3个样点进行土壤样品采集,采样时去掉地表凋落物,用土钻依次钻取0—5 cm、5—10 cm、10—20 cm、20—30 cm、30—40 cm、40—50 cm、50—100 cm处的土层各约300 g,用于分析土壤含水量、pH值、电导率、土壤有机碳含量等指标。并在每个样方内挖掘土壤剖面,用土壤环刀(内径50.46 mm,高50.02 mm)每隔10 cm分层垂直采集用于测定土壤容重的样品。
细根分解均采用尼龙网袋法[12]进行,为保证细根与土壤的充分接触,防止细根外漏,选取长宽为10cm×15 cm,网孔大小为0.12 mm的尼龙袋。于2010年5月,在两个样地附近收集琵琶柴细根样品,将处理好的细根准确称取5 g分别装入上述尼龙袋中,每个样地放置25个分解袋。取15—20 cm深的土壤磨碎置入分解袋中并于细根混合均匀,细根样品随机埋入样地内15—20 cm深的土壤中,每月固定从各点中收集5个分解样品,用于细根分解分析。
1.3 室内分析用于测定土壤容重的样品在105℃烘干至恒重,同时测定土壤含水量。用于测定其它指标的土壤样品,置于干燥阴凉处风干,挑去其中石块、根系、未分解的有机质,过100目土壤筛。采用pH计和DDSJ-308型电导仪测定土壤( 水土为5 :1的混合液)pH值和电导率。将琵琶柴细根生物量于65℃条件下烘干至恒重,测定干重。用K2Cr2O7外加热法[13]测定根系有机碳含量。
1.4 数据处理与统计分析数据分析均在SPSS16.0中完成。采用方差分析,比较群落1和群落2的土壤含水量、pH、容重、电导率等土壤因子的差异。应用Olsen指数衰减模型[13]对细根分解速率进行拟合。
1.4.1 细根周转率[1, 14]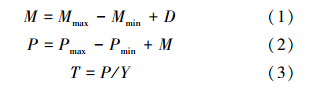
式中, M 、 P 、 D 、 T 分别为细根年死亡量、年生产量、年分解量(g · m-2 · a-1)和周转速率(次/a), Mmax 、 Mmin 为死根现存量的最大值和最小值, Pmax 、 Pmin 和 Y 分别为活细根现存量的最大值、最小值和平均值。
1.4.2 细根分解[15]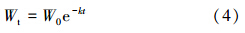
式中,t是分解时间, W0 为起始时细根重量, Wt 为时间t时细根残留重量,k是细根分解速率系数。
2 结果 2.1 细根生物量及动态由表 2可见,琵琶柴群落1和群落2各土层的细根生物量差异显著,随着土层深度增加,细根生物量(活细根生物量和死细根生物量)均表现出先增加后逐渐减少的趋势,不同的是群落2的琵琶柴细根垂直分布较群落1深。85.99%的活细根生物量和85.03%的死细根生物量分布在群落1的0—30 cm土层中,62.25%的活细根和71.03%的死细根分布在群落2的0—30 cm土层中。群落1和2表层和深层细根生物量均较少,10—20 cm的土层细根生物量占总细根生物量比例最大,分别为46.48% 、29.15%。
| 群落 Communities | 土层/cm Soil layers | 活细根 Living fine root | 死细根 Dead fine root | 总细根 Total fine root | ||||
| ρ/(g/m2) | p/% | ρ/(g/m2) | p/% | ρ/(g/m2) | p/% | |||
| 1 | 0—10 | 6.65±0.79 | 17.73 | 2.60±0.15 | 18.53 | 9.25±1.61 | 17.95 | |
| 2 | 10—20 | 17.64±0.34 | 47.06 | 6.32±0.29 | 44.92 | 23.96±0.01 | 46.48 | |
| 20—30 | 7.94±0.21 | 21.19 | 3.03±0.06 | 21.58 | 10.98±0.48 | 21.30 | ||
| 30—40 | 3.26±0.10 | 8.71 | 1.33±0.01 | 9.50 | 4.60±0.14 | 8.92 | ||
| 40—50 | 1.24±0.10 | 3.31 | 0.46±0.01 | 3.33 | 1.71±0.19 | 3.31 | ||
| 50—60 | 0.75±0.11 | 1.99 | 0.31±0.02 | 2.14 | 1.05±0.21 | 2.03 | ||
| 2 | 0—10 | 9.35±0.31 | 8.89 | 6.04±0.11 | 20.96 | 15.38±0.74 | 11.49 | |
| 10—20 | 30.37±2.42 | 28.89 | 8.66±0.67 | 30.09 | 39.04±4.90 | 29.15 | ||
| 20—30 | 25.73±2.47 | 24.47 | 5.75±0.32 | 19.98 | 31.48±2.26 | 23.51 | ||
| 30—40 | 15.60±1.15 | 14.84 | 2.96±0.05 | 10.28 | 18.56±0.97 | 13.86 | ||
| 40—50 | 12.07±0.64 | 11.48 | 2.90±0.04 | 10.09 | 14.98±1.02 | 11.18 | ||
| 50—60 | 7.67±1.17 | 7.29 | 1.42±0.08 | 4.94 | 9.09±1.07 | 6.79 | ||
| 60—70 | 3.38±0.63 | 3.21 | 0.83±0.04 | 2.88 | 4.21±0.37 | 3.14 | ||
| 70—80 | 0.95±0.03 | 0.91 | 0.21±0.02 | 0.73 | 1.16±0.11 | 0.87 | ||
群落1和2细根生物量月平均值为51.55 g/m2和133.93 g/m2。其中,群落1活细根与死细根生物量分别为35.92 g/m2和15.63 g/m2,群落2活细根与死细根的生物量分别为105.13 g/m2和28.80 g/m2(图 1),群落1和2的死细根生物量分别占总细根生物量的30.32%、27.39%。在5—10月主要生长季节内,群落1和2活细根生物量、死细根生物量均呈现出显著的季节变化,5月—8月逐渐增加,群落2和1分别在8月和9月达到最大值,随后开始下降。
2.2 细根分解由图 2可见,细根分解速率开始时较大,30 d后明显减缓,群落1和2的细根分解速率分别在90和60天时下降至最小值,随后缓慢上升。除60 d时群落1细根分解速率较大外,群落2细根分解速率在150 d的分解期内均较群落1细根分解速率大。

|
| 图 2 活细根生物量、死细根生物量的季节变化 (平均值±标准误差) Fig. 2 Seasonal variations of live fine root biomass and dead fine root biomass (mean±SE) |
由表 3可见,两个群落琵琶柴细根残留量表现出一定差异,群落1细根残留量均较群落2细根残留量大。
| 群落Communities | 30 d | 60 d | 90 d | 120 d | 150 d |
| 不同字母表示在相同时间下两个群落细根残留量存在显著差异P<0.05 | |||||
| 1 | 91.33±1.01a | 86.4±2.68a | 84.07±8.37a | 81.47±3.57a | 77.40±3.64a |
| 2 | 86.93±1.77b | 83.43±1.20a | 78.97±1.86a | 74.17±1.74b | 69.07±2.17b |
由表 4可见,群落1和2琵琶柴细根的年分解 率分别为34.8%、42.9%,当分解量达到50%和95%时,群落1需要630d和2933d,群落2需要467d和2238d。
| 群落类型 Communities | 回归方程 Regression equations | R2 | 50%分解时间/d 50% decomposition time | 95%分解时间/d 95% decomposition time | 年分解率/% Annual decomposition rate |
| 1 | Wt=4.6934e-0.0010t | 0.966 | 630 | 2933 | 34.8 |
| 2 | Wt=4.5877e-0.0013t | 0.906 | 467 | 2238 | 42.9 |

|
| 图 3 细根分解速率随分解时间的变化 (平均值±标准误差) Fig. 3 Temporal variations of decomposition rate of the fine root (mean±SE) |
由表 5可见,就细根年分解量、年死亡量、净生产力及年周转率而言,群落2均较群落1高。群落1和群落2通过细根死亡进入土壤中的有机碳分别为11.2 g/m2和31.9 g/m2,细根生产有机碳分别为22.5 g · m-2 · a-1和83.1 g · m-2 · a-1。
| 群落类型 Communities | 分解/(g · m-2 · a-1) Decomposition | 死亡量/(g · m-2 · a-1) Mortality | 净生产力/(g · m-2 · a-1) Net productivity | 周转率/(次· a-1) Turnover rate |
| 不同字母表示两个群落的指标存在显著差异(P<0.05) | ||||
| 1 | 16.08a | 25.13a | 50.67a | 1.41a |
| 2 | 41.47b | 71.82b | 178.15b | 1.69b |
群落1的电导率、pH值、含水量都明显低于群落2,土壤容重表现出相反的变化趋势。
活细根生物量、死细根生物量、总细根生物量、细根分解量、细根分解速率与土壤温度、土壤含水量、土壤容重、pH值、土壤电导率等土壤因子的逐步回归分析表明(表 6),影响上述变量的土壤因子并不相同,总体而言,土壤pH值、电导率和土壤水分是影响各变量的主要因子。
| 群落 Communities | 逐步回归方程 Stepwise regression equations | n | R2 | P |
| D: 细根分解量 Fine root decomposition (g · m-2 · month-1); V: 分解速率 Decomposition rate (%); Fd: 死细根生物量 Dead fine root biomass (g/m2); Fl: 活细根生物量 Living fine root biomass (g/m2); Ft: 总细根生物量 Total fine root biomass (g/m2); T: 土壤温度 Soil temperature (℃); R: 土壤容重 Soil bulk density (g/cm3); W: 土壤含水量 Soil water content (%); 土壤pH值 Soil pH; E: 土壤电导率 Soil electrical conductivity (mS/cm) | ||||
| 1 | D= -13.889+0.22T+0.616W+5.623R | 18 | 0.902 | <0.01 |
| 2 | V=47.876-3.991E-23.429R | 18 | 0.595 | <0.01 |
| Fd= -116.726+33.352R+93931pH | 18 | 0.797 | <0.01 | |
| Fl= -851.205+102.802pH+24.784E | 18 | 0.746 | <0.01 | |
| Ft= 2.539-2.687W+1.125T+12.727E | 18 | 0.756 | <0.01 | |
| D= -6.902+0.403T+1.025W | 18 | 0.901 | <0.01 | |
| V= 10.844+3.050W-26.043R | 18 | 0.906 | <0.01 | |
| Fd= -231.678+31.887pH-3.841W | 18 | 0.817 | <0.01 | |
| Fl= -759.034+83.339pH+26.559E-2.468W | 18 | 0.669 | <0.01 | |
| Ft= -728.840+62.227pH+2.336T+58.332E | 18 | 0.896 | <0.01 | |
目前对于细根生产量和周转的观察方法主要有土芯法、内生长法、微根管法、同位素示踪法等,上述方法均有一定缺陷。土芯法是最早用来测定细根生产和死亡率的一种方法,相对于其它方法而言,由于其简便、易行,也是目前研究细根生物量、生产和周转最常用的方法[16],土芯法在处理和清洗根的过程中,有些小根易于折断从而导致细根的少量损失,本文在细根清洗过程中非常仔细,由此导致的损失可以忽略不计[17]。对全球不同陆地生态系统100多个细根生物量研究资料的分析结果表明:细根生物量大小在46—2805 g/m2之间(样本数n=169),大部分(n=125)在100—1000 g/m2之间[18]。本项研究表明群落1和群落2在生长季节细根生物量平均值为51.55 g/m2和133.93 g/m2,对应的细根生物量碳库分别为0.23 t/hm2和0.59 t/hm2。与其他生态系统相比,细根生物量和细根碳库均较小[1, 9, 11, 19]。这主要是由研究区域的气候条件决定的。一般而言,荒漠生态系统由于受极端环境的影响,物种多样性低、植被分布稀疏、盖度小、地上地下生物量较小。琵琶柴为耐盐碱植物,具有极强的抗盐、抗干旱能力[19],一定浓度的土壤盐碱可以促进耐盐碱植物细根的生长和生物量的增加[20],群落2具有较高的盐分含量和pH,可能由于促进作用较大,群落2细根生物量较大。
细根生物量的季节动态直接反映了植物的生长状况、土壤理化条件和营养物质变化及细根的周转快慢等特征。研究认为细根生物量在一年中常出现1到2个峰值[1, 21, 22];峰值出现的时间在春季展叶期前后、晚夏或秋季等,但受植物自身特性及外界环境条件(如降水量、土温、养分有效性等)的共同影响[3],细根生物量在生长季节和年际之间会有一定程度的波动。本项研究结果表明群落1和2的活细根现存量均以8月较高,以5、10月最低,峰值出现在晚夏;死细根生物量以8、9月份最高,5月份最低,较活细根生物量峰值有一定程度的后移。细根生物量峰值出现在晚夏,与荒漠生态系统生物量的研究结论相一致[23]。主要是由于此阶段土壤养分有效性较高、温湿条件较好[21, 22]有关。生长季节末期有较高的死细根生物量与细根较低的分解率有关[24]。
细根生物量在土壤剖面上的垂直分布特征与植物种类、植物生长年限、养分有效性、土壤温湿条件、土壤物理性质(容重、机械组成)等有关[25, 26]。本研究中细根生物量随土壤深度增加而明显下降的结论与大多数研究结果一致[9, 24],其中85.73%的群落1琵琶柴细根分布于0—30 cm土层,94.65%的群落1细根分布在0—40cm土层。64.15%的群落2细根分布于0—30cm土层,78.2%的群落2细根分布在0—40cm土层,两者垂直分布差异明显。在环境条件中,除土壤理化性质差异明显外,其他条件大致相同,因此土壤条件的不同是造成细根分布不同的主要原因。由于群落1具有较大的土壤容重和较低的土壤含水量,降低了土壤孔隙度和氧气含量,好氧土壤微生物含量减少,降低了水分和养分的利用效率,限制了植物根系的向下生长和水平伸展,故群落1细根主要分布于0—30 cm表层土壤中。相对而言,群落2具有较低的土壤容重和较高的土壤含水量,土壤孔隙度大,氧气充足,水分和营养物质利用较高,细根更易于向下生长和水平伸展,细根垂直分布更为分散。
3.2 细根分解细根分解速率主要受土壤的理化性质、环境条件和细根本身的化学特性影响[27]。温度和水分是影响细根分解的主要原因,温度直接影响微生物的活动,间接改变土壤水分和养分,两者通过互作效应进对细根分解产生影响[11, 28],年平均温度与分解速率呈正相关[29],在干旱季节添加水分可以显著提高分解速率[29]。在第1阶段(前30d)细根分解相对较快,这主要是由于分解初期细根器官中碳水化合物的含量相对较高,对于起分解作用的细菌和微生物而言较为适宜,细根中无机成分以及可溶性组分被微生物利用或是被淋洗掉;在第2阶段(30—90 d),难以分解的物质如木质素、纤维素等比例增加,难以被微生物分解利用,细根分解缓慢;在第3阶段(90d以后),木质素、纤维素分解微生物数量增加,分解速率不断加快[28]。由于土壤微环境(湿度、容重等)的差异,群落2细根分解速率较群落1快。
分解系数k可以用来表示分解速率的大小,k值越大说明细根干物质损失越快[14]。Peterson根据k值的大小将分解速率划分为快组(k>0.01) 、中等组(0.005< k<0.01)和慢组( k<0.005)[30]。本项研究表明群落1和2细根分解系数k值分别为0.001、0.0013,均小于0.005,根系分解速率极为缓慢。这主要是由于该区域居于亚欧大陆内部,气候干旱,土壤高度盐碱化,导致微生物活动降低[19, 23],分解活动较弱。
3.3 细根周转细根周转的主要原因是土壤因子和土壤营养条件处于不断变化之中,植物只有在新的部位长出新的细根以代替旧的细根才能不断吸收水分和营养物质,以保持植物生长和生命活动的继续[31]。Jackson和Gill分析表明,细根周转速率范围在0.019—2.644次/a之间,平均周转速率为0.56次/a[6, 7]。本项研究中群落1和2细根周转率分别为1.41、1.69次/a,小于裴志琴等2.08次/a的结果[23],处于Jackson和Gill所报道的周转速率范围内。这种相对较高的细根周转率说明植物生命活动旺盛,可以不断产生新的细根以替代旧的细根来吸收水分和营养物质,增加根系对水分和营养物质的利用效率[31]。同时,植物维持高的细根生物量需要消耗大量的营养物质和能量,保持较高的细根周转率可以以较低现存细根生物量满足植物旺盛的生命活动对水分和营养物质的需求,是植物降低能耗的一种适应方式[14]。细根周转可以将大量营养物质和养分带进土壤,促进微生物活动,改善土壤的理化条件[26],以补偿干旱区恶劣环境条件对植物生长造成的危害[23]。因此,本研究中相对较高的细根周转速率是环境胁迫作用的结果。
| [1] | Dietrich H, Christoph L. A comparison of four different fine root production estimates with ecosystem carbon balance data in a Fagus-Quercus mixed forest. Plant and Soil, 2002, 239: 237-251. |
| [2] | Kirsi M, Helj-Sisko H. Assessing fine-root biomass and production in a Scots pine stand-comparison of soil core and root ingrowth core methods. Plant and Soil, 1999, 210: 43-50. |
| [3] | Helj S H, John D, Pekka N, Mikko K. Fine root biomass in relation to site and stand characteristics in Norway spruce and Scots pine stands. Tree Physiology, 2007, 27, 1493-1504. |
| [4] | Grier C C, Vogt K A, Keyes M R, Edmonds R L. Biomass distribution and above and below-ground production in young and mature Abies amabilis zone ecosystems of the Washington Cascades. Canadian Journal of Forest Research, 1981, 11, 155-167. |
| [5] | Vogt K A, Vogt D J, Palmiotto P A, Boon P, O′Hara J, Asbjornsen H. Review of root dynamics in forest ecosystems grouped by climate, climatic forest type and species. Plant and Soil, 1996, 187, 159-219. |
| [6] | Jackson R B, Mooney H A, Schulze E D.A global budget for fine root biomass, surface area, and nutrient contents. Proceedings of the National Academy of Sciences of the United States of America, 1997, 94, 7362-7366. |
| [7] | Gill R A,Jackson R B. Global patterns of root turnover for terrestrial ecosystems. New Phytologist, 2000, 147, 13-31. |
| [8] | Bloomfield J, Vogt K, Wargo P M. Tree root turnover and senescence. In: Waisel Y, Eshel A, Kafkafi U. Plant Roots: The Hidden Half. Decker, New York, USA: Marcel Dekker, 1996, 363-381. |
| [9] | Babu J, Harendra N, Pandey, Radhey S, Tripathi. Vertical distribution and seasonal changes of fine and coarse root mass in Pinus kesiya Royle Ex.Gordon forest of three different ages. Acta Oecologica, 2001, 22, 293-300. |
| [10] | Muoz F, Beer J. Fine root dynamics of shaded cacao plantations in Costa Rica. Agroforestry Systems, 2001, 51(2): 19-130. |
| [11] | Lin C F, Guo J F, Chen G S, Yang Y S. Research progress in fine root decomposition in forest ecosystem. Chinese Journal of Ecology, 2008, 27(6): 1029-1036. |
| [12] | Fahey T J, Hughes J W, Pu M, Arthur M A. Root decomposition and nutrient flux following whole tree harvest of northern hardwood forest. Forest Science, 1988, 34, 744-768. |
| [13] | Bao S D. Soil and agricultural chemistry analysis. 3rd ed. Beijing: China Agriculture Press, 2000: 30-34. |
| [14] | Marianne K, Burke, Dudley J R. Fine root growth phenology, production and turnover in a northern hardwood forest ecosystem. Plant and Soil, 1994, 162: 135-146. |
| [15] | Olson J S. Energy storage and the balance of producers and decomposition in ecological systems. Ecology, 1963, 44: 332-341. |
| [16] | Samson B K, Sinclair T R. Soil core and minirhizotron comparison for the determination of root length density. Plant and soil, 1994, 161(2): 225-232. |
| [17] | Santantonio D, Grace J C. 1987.Estimating fine-root production and turnover from biomass and decomposition data: a compartmental model. Canadian Journal of Forest Research, 1987 (17): 900-908. |
| [18] | Zhang X Q, Wu K H. Fine-root production and turnover for forest ecosystems. Scientia Silvae Sinicae, 2001, 37(3):126-137. |
| [19] | Ma M H, Kong L S. The bio-ecological characteristics of on the border of oasis at Hutubi,Xinjiang. Chinese Journal of Plant Ecology, 1998, 22(3): 237-244. |
| [20] | Bajji M, Kinet J M, Lutts S. Salt stress effects on roots and leaves of Atripleshalimus L.and their corresponding callus cultures. Plant Science, 1998, 137: 137-142. |
| [21] | Lopez B, Sabate S, Gracia C A. Annual and seasonal changes in fine root biomass of Quercus ilex L. forest. Plant and Soil, 2001, 230: 125-134. |
| [22] | Mallonen K, Helmisaari H S. Seasonal and yearly variations of fine-root biomass and necromass in a Scots pine(Pinus sylvestris L.) stand. Forest Ecology and Management, 1998, 102: 283-290. |
| [23] | Pei Z Q, Zhou Y, Zheng Y R, Xiao C W. Contribution of fine root turnover to the soil organic carbon cycling in a Reaumuria soongorica community in an arid ecosystem of Xinjiang Uygur Autonomous Region, China. Chinese Journal of Plant Ecology, 2011, 35(11): 1182-1191. |
| [24] | Yang Y S, Chen G S, Lin P, Huang R Z, Chen Y X, He Z M. Fine root distribution, seasonal pattern and production in a native forest and monoculture plantations in subtropical China. Scientia Silvae Sinicae, 2003, 29(9): 1719-1730. |
| [25] | Li L H, Lin P, Xing X R. Fine root biomass and production of Castanopsis eyrei forests in Wuyi Mountains. Chinese Journal of Applied Ecology, 1998, 9 (4): 337-340. |
| [26] | Rong L, Li S J, Li X W, Zhang J, Wang P. Carbon dynamics of fine root (grass root) decomposition and active soil organic carbon in various models of land use conversion from agricultural lands into forest lands. Acta Ecologica Sinica, 2011, 31(1): 0137-0144. |
| [27] | Silver W L, Miya R K. Global patterns in root decomposition: Comparisons of climate and litter quality effects. Oecologia, 2001, 129: 407-419. |
| [28] | Berg B. Plant litter: decomposition, human formation, carbon sequestration. Berlin: springer.2003. |
| [29] | Wieder R K, Wright S J Tropical forest litter dynamics and season irrigation on Barro Colorado Island, Panama. Ecology, 1995, 76: 1971-1979. |
| [30] | Peterson R C, Cummins K W. Leaf processing in a woodland stream. Fresh water Biology, 1974, 4: 343-368 |
| [31] | Bartsch N. Responses of root systems of young Pinus sylvestris and Picea abies plants to water deficits and soil acidity. Canada Journal Forest Research, 1987, 17(8): 805-812. |
| [11] | 林成芳,郭剑芬,陈光水,杨玉盛.森林细根分解研究进展.生态学杂志, 2008, 27(6):1029- 1036. |
| [13] | 鲍士旦. 土壤农化分析. 北京:中国农业出版社, 2000:30- 34. |
| [18] | 张小泉,吴可红. 森林细根生产和周转研究.林业科学, 2001, 37(3):126- 137. |
| [19] | 马茂华,孔令韶.新疆呼图壁绿洲边缘的琵琶柴生物生态学特性研究.植物生态学报, 1998, 22(3):237- 244. |
| [23] | 裴智琴,周勇,郑元润,肖春旺.干旱区琵琶柴群落细根周转对土壤有机碳循环的贡献.植物生态学报, 2011, 35(11):1182- 1191. |
| [24] | 杨玉盛,陈光水,林鹏,黄荣珍,陈银秀,何宗明.格氏栲天然林与人工林细根生物量、季节动态及净生产力.生态学报, 2003, 29(9):1719- 1730. |
| [25] | 李凌浩,林鹏,邢雪荣.武夷山甜槠林细根生物量和生长量研究.应用生态学报,1998, 9 (4): 337- 340. |
| [26] | 荣丽,李守剑,李贤伟,张健,王鹏.不同退耕模式细根(草根)分解过程中C动态及土壤活性有机碳的变化. 生态学报, 2011,31(1):0137- 0144. |