 2014, Vol. 34
文章信息
- 李刚, 孙骞, 于善祥, 安东升, 董永义, 邹聪聪, 杜文丛, 张宁一, 罗卫红
- LI Gang, SUN Qian, YU Shanxiang, AN Dongsheng, DONG Yongyi, ZOU Congcong, DU Wencong, ZHANG Ningyi, LUO Weihong
- 氮素对长江中下游温室切花百合外观品质影响的模拟研究
- Quantifying the effects of nitrogen on external quality of cut lily in greenhouse in the Yangtze River Delta
- 生态学报, 2014, 34(14): 4057-4070
- Acta Ecologica Sinica, 2014, 34(14): 4057-4070
- http://dx.doi.org/10.5846/stxb201211291703
-
文章历史
- 收稿日期:2012-11-29
- 修订日期:2014-2-27


百合(Lilium spp.)是目前世界上最受欢迎的切花之一。近年来我国切花百合产业发展迅速,但由于缺乏标准化栽培管理技术,温室切花百合产品质量普遍不高,严重影响生产企业的经济效益[1]。温室作物与大田作物相比,茬数多,种植时间长,过量施用氮肥现象在温室栽培生产中十分严重[2, 3]。温室内土壤生态系统的特殊环境及失衡的氮肥管理,极易造成土壤盐分积累和盐害发生,严重地制约设施农业的发展[4]。在温室切花生产过程中,过量施用氮肥还会严重降低切花品质,缩短瓶插寿命[5, 6]。因此,合理施用氮肥,提高氮素利用率,对提高温室切花外观品质和保护环境具有重要意义。
定量研究氮素对花卉外观品质的影响是花卉生产中进行氮素优化管理的重要前提。国内外已有的花卉外观品质模拟模型主要是基于光温的预测模型,如基于不同生长温度的长寿花外观品质预测模型[7],基于辐热积的日光温室独本菊、一品红、郁金香、百合、多头切花菊、蝴蝶兰、大花蕙兰外观品质模拟模型[8, 9, 10, 11, 12, 13, 14],基于相对热效应的春石斛兰外观品质模拟模型[15]。这些模型为花卉外观品质的光温优化调控提供了有效的模型工具。关于营养元素对花卉外观品质影响的报道则较少。丁琪峰等[16]建立了氮素对日光温室独本菊品种‘神马’外观品质影响的模拟模型。康红梅等[17]利用二次函数建立了氮素与切花月季外观品质的关系,用于预测切花月季外观品质。百合为球根花卉,养分吸收规律不同于宿根类或木本花卉[18]。对于宿根花卉来说,定植后不断从土壤中吸收养分,维持其生长发育,直至成熟[19, 20]。而球根花卉在定植时鳞茎已储存了大量营养物质,可作为初期生长主要的养分来源;中后期主要依靠茎生根吸收养分供地上部分生长和花器官发育,此时氮素对植株地上部分的生长作用最敏感,土壤中氮素不足或过量会降低切花外观品质,甚至出现盲花[21, 22]。目前,有关氮素对球根花卉外观品质影响的模拟研究鲜有报道。
本研究针对球根花卉中后期才依靠茎生根吸收养分供植株生长的特点,以切花百合‘索邦’和‘西伯利亚’为试验材料,通过温室内不同定植期、生长中后期不同速效氮素水平的栽培试验,定量分析氮素对切花百合外观品质指标的动态影响,建立氮素对切花百合外观品质影响的模拟模型,以期为长江中下游地区温室切花百合生产中的氮素优化和标准化管理提供理论依据和决策支持。
1 材料与方法 1.1 试验设计试验于2008年8月至2011年5月在连云港岗埠农场日光温室和南京市农业科学研究所连栋温室内进行。共6个试验,其中试验1和试验2为无氮素处理试验,试验3、4、5和试验6为氮素处理试验。各试验定植时土壤或基质的营养状况见表 1。
试验1于2008年8月28日在连云港岗埠农场日光温室内进行。温室东西走向,长70 m,跨度10.5 m,脊高3 m,后墙高2.8 m。前屋面为竹架结构,覆盖无滴聚氯乙烯薄膜,夏季外覆遮阳网降温,冬季每天16:00至次日8:00采用长10 m、宽1.2 m、厚0.05 m的草帘保温。供试品种为‘索邦’(Lilium spp. ‘Sorbonne’)和‘西伯利亚’(Lilium spp. ‘Siberia’),系从荷兰进口经过5 °C春化处理种球,周径为0.14—0.16 m。采用土栽方式种植,密度为36株/m2。小区面积8 m2,3个重复。采收期:索邦为2008年12月8日,西伯利亚为2008年12月30日。
试验2于2009年3月26日在南京市农业科学研究所连栋温室内进行。温室东西走向,长28 m,沿南北方向分为2跨,每跨跨度8 m,檐高3 m,拱高5 m。栽植床长25 m,宽1.7 m,高1 m。冬季温室内加一层塑料薄膜保温,并通过鼓风机加温;夏季外覆遮阳网,湿帘、风机降温。供试品种为‘索邦’(Lilium spp. ‘Sorbonne’)。采用基质盆栽,每盆种植1个种球,摆放密度为36株/m2。小区面积为0.8 m2,3个重复。基质体积配比为园土 ∶ 草炭 ∶ 河沙 = 1 ∶ 1 ∶ 2。花盆盆口直径0.18 m,盆底直径0.12 m,盆高0.14 m。采收期为2009年6月25日。
氮素处理试验(试验3、4、5和试验6)在连栋温室内进行。供试品种为‘索邦’(Lilium spp. ‘Sorbonne’),采用基质盆栽,基质体积配比为园土:草炭:河沙 = 1 ∶ 1 ∶ 3。设4个氮素水平,即通过施入尿素,使基质中速效氮含量分别为25、45、65、85 mg (N)/kg (土壤)。每处理3个重复,共12个小区,小区面积为0.8 m2,随机区组设计。氮肥分3次施入,施肥量分别为总量的40%、30%和30%。
试验3于2009年9月27日定植,2010年1月22日采收。施肥日期分别为:2009年10月18日、2009年11月5日、2009年12月20日。
试验4于2009年11月29日定植,2010年4月25日采收。施肥日期分别为2010年1月12日、2010年2月5日、2010年3月17日。
试验5于2010年9月9日定植,2011年1月2日采收。施肥日期分别为2010年10月21日、2010年11月16日、2010年12月14日。
试验6于2010年12月5日定植,2011年5月2日采收。施肥日期分别为2011年2月9日、2011年3月4日、2011年4月1日。
试验3的数据用于建立模型,试验1、2、4、5和试验6的数据用于检验模型。
|
试验
Exp No. | 全氮
Total N /% | 有机质
Organic C /% | 速效氮
Available N /(mg/kg) | 速效磷
Available P /(mg/kg) | 速效钾
Available K /(mg/kg) | 容重
Bulk density /(mg/m3) | 土壤盐分
EC /(mS/m) | pH |
| 试验1 | 0.05 | 2.98 | 100.43 | 21.94 | 69.54 | 1.06×10⁶ | 134 | 7.21 |
| 试验2 | 0.04 | 2.32 | 80.21 | 17.63 | 43.42 | 1.06×10⁶ | 25 | 7.08 |
| 试验3,4 | 0.03 | 2.08 | 10.10 | 15.75 | 36.97 | 1.08×10⁶ | 18 | 6.22 |
| 试验5,6 | 0.02 | 2.24 | 9.67 | 11.42 | 40.38 | 1.12×10⁶ | 20 | 6.01 |
试验期间每天观测切花百合生长发育动态,并记录到达各生育期的起始日期。从展叶开时,每处理各重复分别选取3株长势一致的植株(各处理9株)挂牌进行定株观测,每隔4 d测量1次。项目包括株高、叶片长度、出叶数。现蕾后测定第1花蕾长度和第1花蕾直径(花蕾中部最大直径)。
1.2.2 化学分析及当季供氮量的计算土壤与植株的取样及化学分析和当季土壤供氮量(速效氮)的计算参见文献[23]。本研究以当季土壤供氮量(kg/hm2)作为供氮水平指标来探讨氮素对切花百合外观品质指标的影响。
1.2.3 温室环境数据的采集温室环境数据由数据采集器(CR1000,Campbell Scientific Inc.,USA)自动采集。采集项目包括温室内切花百合冠层上方距离地面1.5 m高处的光合有效辐射(PAR)、空气温度及土壤温度。采集频率为每60秒一次,存储30 min的平均值。
试验期间温室内空气温度、光照及土壤温度如图 1所示(以试验2、3和试验4为例)。从图 1可以看出,定植后,切花百合所遇到的温室内光温条件及土壤温度不同试验期间存在差异。

|
| 图 1 定植后温室内日最高温度、日最低温度和、总光合有效辐射和日平均土壤温度 Fig.1 Daily maximum temperature,minimum temperature,daily total photosynthetically active radiation and daily average soil temperature since planting date |
根据百合叶片叶面积与叶长的关系计算各氮素处理的单株叶面积,进一步计算叶面积指数。具体计算公式如下:

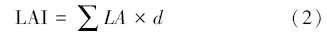
式中,LL (leaf length)为叶片长度(m),k为经验系数,其值为0.189[24],LA (leaf area)为单叶叶面积(m2),d为定植密度(株/m2),LAI(leaf area index)为叶面积指数(m2/m2)。
1.2.5 出花率的统计出花率是指采收时切花百合外观品质达到某等级标准的植株数占总植株数的比例。具体做法是:采收时(第1花蕾开始露色但还未展开),参照百合质量分级标准(GB/T18247.1—2000)[25]和《百合商品切花生产技术规程》[26],明确了切花百合的分级标准(表 2),统计各处理中达到各等级切花标准的植株数,从而计算出各级切花的出花率,以此研究氮素水平对温室切花百合外观品质的影响。
|
分级
Rank | 切花枝长/m
Stem height | 第1花蕾长度/mm
Length of first flower bud | 第1花蕾直径/mm
Diameter of first flower bud | 花朵数
Flower number | 叶片
Leaves |
| 一级Rank one | ≥ 0.8 | ≥ 95 | ≥ 30.2 | ≥ 4 | 允许2片叶有轻微不足 |
| 二级Rank two | ≥ 0.7 | ≥ 85 | ≥ 28.6 | ≥ 3 | 允许2片叶有明显缺陷 |
| 三级Rank three | ≥ 0.6 | ≥ 75 | ≥ 25.4 | ≥ 2 | 允许4片有明显缺陷 |
| 四级Rank four | < 0.6 | < 75 | ≥ 22.2 | ≥ 1 | 超过4片以上有明显缺陷 |
根据试验3的数据,采用冠层累积吸收辐热积(PTI)[27]作为预测指标,各氮素处理叶面积指数、出叶数、株高、第1花蕾长度和第1花蕾直径(图 2)随生育期的变化分别用公式(3)—(7)描述。

|
| 图 2 不同氮素水平下切花百合叶面积指数 (LAI) 、出叶数 (n) 、株高 (H) 、第1花蕾长度 (LF) 和第1花蕾直径 (DF) 与展叶后冠层累积吸收辐热积的关系 Fig.2 Relationship between leaf area index (LAI) ,leaf number (n) ,plant height (H) ,length of first flower bud (LF) and diameter of first flower bud (DF) of cut lily and the accumulated photo-thermal index since leaf unfolding (PTIsum) under different nitrogen supply conditions |
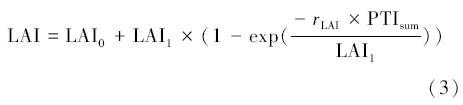
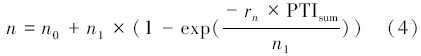
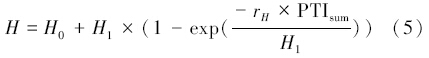


式中,LAI、n 、H、LF和DF分别为叶面积指数(m2/m2)、出叶数、株高(m)、第1花蕾长度(mm)和第1花蕾直径(mm)。LAI0、n0、H0、LF0和DF0分别为展叶后开始定株测定时的叶面积指数、出叶数、株高、第1花蕾长度和第1花蕾直径(由试验3的数据分别定为0.1 m2/m2、10、0.15 m、10 mm和8 mm),LAI1、n1和H1为展叶后叶面积指数、出叶数和株高的增长量。rLAI、rn、rH、rLF和rDF分别为叶面积指数增加速率((m2/m2) (MJ/m2))、出叶数增加速率、株高增加速率(m MJ-1 m-2)、第1花蕾长度增加速率(mm MJ-1 m-2)和第1花蕾直径增加速率(mm MJ-1 m-2)。PTIsum和PTIb分别为展叶后冠层累积吸收辐热积(MJ/m2)和从展叶到现蕾冠层累积吸收辐热积(MJ/m2)。3、4、5朵花的外观品质指标均采用上面的公式进行量化。
2.2 氮素对外观品质指标参数的模拟各氮素处理在展叶期、现蕾期、采收期的叶片累积氮含量与土壤供氮量(速效氮)的关系如图 3所示。叶片累积氮含量随生育期的进行先增大后减小,最大值出现在现蕾期。因此,本研究采用切花百合现蕾期的叶片累积氮含量作为营养指标来量化氮素对切花百合外观品质的影响。现蕾期叶片累积氮含量与当季土壤供氮量及当季土壤平均温度有关(图 3),可用公式(8)—(9)表示。

|
| 图 3 试验3不同生长阶段的叶片累积氮含量与当季土壤供氮量及现蕾期叶片累积氮含量 (NL) 与当季土壤供氮量 (Ns) 及土壤平均温度 (Ts) 的关系 Fig.3 Relationship between accumulated leaf nitrogen content of different development stages and nitrogen available in the soil of Exp eriment 3 and between the accumulated leaf nitrogen content at flower bud showing stage and the nitrogen available in the soil and the average soil temperature during the experimental season |

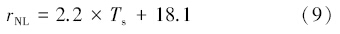
式中,NL为现蕾期叶片累积氮含量(mg/m2),NLC为现蕾期叶片累积氮含量临界值(mg/m2),根据试验3的观测数据定为1.87×103 mg/m2,NS为当季土壤供氮量(kg/hm2),rNL为现蕾期叶片累积氮含量增加速率((mg/m2)/(kg/hm2)),Ts 为当季土壤平均温度(℃)
根据试验3的数据,公式(3)—(7)中参数n1(图 4)、rn受现蕾期叶片累积氮含量影响较小,而参数LAI1、rLAI、H1、rH、rLF、rDF和PTIb与现蕾期叶片累积氮含量有关,分别用公式(10)—(16)对相关数据进行曲线拟合建立各参数与现蕾期叶片累积氮含量的关系。

|
| 图 4 切花百合叶面积指数增长量 (LAI1) 、叶面积指数增加速率 (rLAI) 、出叶数增长量 (n1) 、出叶速率 (rn) 、株高增长量 (H1) 、株高增加速率 (rH) 、第1花蕾长度增加速率 (rLF) 、第1花蕾直径增加速率 (rDF )和从展叶到现蕾冠层累积吸收辐热积 (PTIb) 与现蕾期叶片累积氮含量 (NL) 的关系 Fig.4 Relationship between increasing value of leaf area index LAI1,increasing rate of leaf area index (rLAI) ,increasing value of leaf number (n1) ,increasing rate of leaf number (rn) ,increasing value of plant height (H1) ,increasing rate of plant height (rH) ,increasing rate of first flower bud length (rLF) ,increasing rate of first flower bud diameter (rDF) ,accumulated PTI from leaf unfolding to flower bud showing stage (PTIb) and the accumulated leaf nitrogen content at flower bud showing stage |
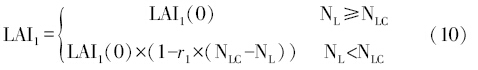
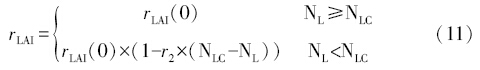
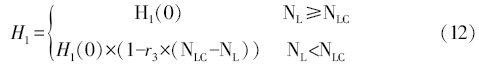
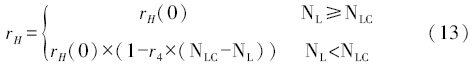
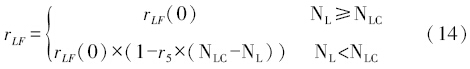
式中,参数LAI1(0)、rLAI(0)、H1(0)、rH(0)、rLF(0)、rDF(0)和PTIb(0) (the value of LAI1,rLAI,H1,rH,rLF,rDF,PTIb under ample nitrogen supply condition)分别为无氮胁迫条件下展叶后叶面积指数增长量(m2/m2)、叶面积指数增加速率((m2/m2) MJ-1 m-2)、株高增长量(m)、株高增加速率(m MJ-1 m-2)、第1花蕾长度增加速率(mm MJ-1 m-2)、第1花蕾直径增加速率(mm MJ-1 m-2)和从展叶到现蕾的冠层累积吸收辐热积(MJ/m2)。r1-r7分别为LAI1、rLAI、H1、rH、rLF、rDF和PTIb随叶片累积氮含量的增加速率。具体值见表 3。其中第1花蕾长度相关参数(rLF(0)、r5)和第1花蕾直径相关参数(rDF(0)、r6)随花朵数的改变而改变(图 5),其拟合公式(17)—(20)如下:


式中,Fn为花朵数。
|
花朵数Fn
Flower number | LAI1(0)
Value of LAI1 under ample nitrogen supply condition /(m2/m2) | rLAI(0)
Value of rLAI under ample nitrogen supply condition /((m2/m2)/(MJ/m2)) | n1
Increasing value of leaf number | rn
Increasing rate of leaf number | H1(0)
Value of H1 under ample nitrogen supply condition /m | |
| LAI1(0)、rLAI(0)、H1(0)、rH(0)、rLF(0)和rDF(0):无氮胁迫条件下展叶后叶面积指数增长量(m2/m2)、叶面积指数增加速率((m2/m2)/(MJ m-2))、株高增长量(m)、株高增加速率(m MJ-1 m-2)、第1花蕾长度增加速率(mm MJ-1 m-2)、第1花蕾直径增加速率(mm MJ-1 m-2)和从展叶到现蕾的冠层累积吸收辐热积(MJ/m2); n1、rn:出叶数增长量和出叶数增加速率;。r1—r7:LAI1、rLAI、H1、rH、rLF、rDF和PTIb随叶片累积氮含量的增加速率; r1—r7:LAI1、rLAI、H1、rH、rLF、rDF和PTIb随叶片累积氮含量的增加速率 | ||||||
| 3 | 2.84 (0.05) | 0.418 (0.005) | 28 (0.8) | 7.89 (0.32) | 0.83 (0.02) | |
| 4 | 2.87 (0.04) | 0.417 (0.005) | 27 (1.2) | 7.93 (0.34) | 0.82 (0.02) | |
| 5 | 2.88 (0.05) | 0.418 (0.005) | 27 (0.5) | 7.90 (0.32) | 0.82 (0.02) | |
|
花朵数Fn
Flower number | rH(0)
Value of rH under ample nitrogen supply condition /(m MJ-1 m-2) | rLF(0)
Value of rLF under ample nitrogen supply condition /(mm MJ-1 m-2) | rDF(0)
Value of rDF under ample nitrogen supply condition /(mm MJ-1 m-2) | PTIb(0)
Value of PTIb under ample nitrogen supply condition /(MJ/m2) | r1
Increasing rate of rLAI /((m2/m2)/ (mg/m2)) | |
| 3 | 0.0774 (0.002) | 0.0692 (0.0002) | 0.045 (0.0005) | 11.6 (0.15) | 5.06×10⁻³ | |
| 4 | 0.0776 (0.002) | 0.0683 (0.0002) | 0.043 (0.0004) | 11.6 (0.15) | 5.06×10⁻³ | |
| 5 | 0.0773 (0.003) | 0.0678 (0.0002) | 0.042 (0.0004) | 11.7 (0.15) | 5.06×10⁻³ | |
|
花朵数Fn
Flower number | r2
Increasing rate of rLAI /(((m2/m2) /(MJ/m2)) /(mg/m2)) | r3
Increasing rate of H1 /(m mg-1 m-2)) | r4
Increasing rate of rH /((m MJ-1 m-2) /(mg/m2)) | r5
Increasing rate of rLF /((mm MJ-1 m-2) /(mg/m2)) | r6
Increasing rate of rDF /((mm MJ-1 m-2) /(mg/m2)) | r7
Increasing rate of PTIb /(MJ/m2) /(mg/m2) |
| 3 | 1.98×10⁻³ | 0.58×10⁻³ | 0.35×10⁻³ | 0.138×10⁻³ | 0.40×10⁻³ | 0.45×10⁻³ |
| 4 | 1.98×10⁻³ | 0.58×10⁻³ | 0.35×10⁻³ | 0.134×10⁻³ | 0.38×10⁻³ | 0.45×10⁻³ |
| 5 | 1.98×10⁻³ | 0.58×10⁻³ | 0.35×10⁻³ | 0.129×10⁻³ | 0.37×10⁻³ | 0.45×10⁻³ |

|
| 图 5 无氮素胁迫时第1花蕾长度增加速率(rLF(0))、rLF增加速率(r5)、第1花蕾直径增加速率(rDF(0))和rDF增加速率(r6)与花朵数(Fn)的关系 Fig.5 Relationship between the value of rLF under ample nitrogen supply condition,increasing rate of rLF,the value of rDF under ample nitrogen supply condition,increasing rate of rDF and flower number |
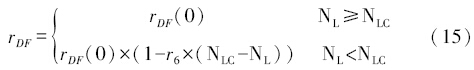
不同氮素处理切花百合采收时统计的各级出花率(一级、二级、三级和四级)与现蕾后冠层累积吸收辐热积的关系如图 6,分别利用公式(21)—(25)拟合各出花率与氮素之间的关系。


|
| 图 6 切花百合采收时出花率和现蕾后冠层累积吸收辐热积的关系及现蕾后冠层累积吸收辐热积(PTIa)和叶片累积氮含量(NL)的关系 Fig.6 Effects of different nitrogen supply on relative yield of different rank and accumulated PTI since visible bud |
式中,R1、R2、R3和R4 分别为一级、二级、三级和四级切花百合的出花率(%),R1(0)、R2(0)、R3(0)和R4(0) 分别为无氮素胁迫时切花百合一级、二级、三级和四级的出花率,由试验3的数据确定为53%、26%、12%和9%,r8、r9和r10分别为一级、二级和三级切花的出花率随现蕾后冠层累积吸收辐热积的增加速率,由试验3的数据确定为0.44、0.31和1.16,PTIa为无氮素胁迫时现蕾后冠层累积吸收辐热积(MJ/m2),PTIa为不同氮素处理现蕾后冠层累积吸收辐热积(MJ/m2)。r11为现蕾后冠层累积吸收辐热积随叶片累积氮含量的增加速率,由试验3的数据确定为0.166×10-3 (MJ/m2)/(mg/m2)。
2.4 模型检验方法采用预测值与观测值之间的决定系数(r2)和相对回归估计标准误(rRMSE)对模型进行检验。其中,r2用于分析符合度,rRMSE用于评价精确度。其计算公式(26)—(27)如下:
式中,x为实测值,y为预测值, 为实测平均值, 为预测平均值,a为样本容量。
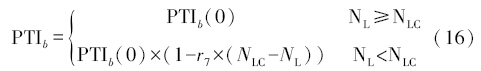
3 结果与分析采用与建模数据相独立的试验数据(试验1、2、4、5和试验6)按照公式(1)—(20)计算出各氮素水平处理的叶面积指数、株高、出叶数、第1花蕾长度和第1花蕾直径的预测值(图 7)。预测值与实测值之间基于1 ∶ 1线的决定系数(r2)分别为0.92、0.85、0.86、0.91和0.88,相对回归估计标准误(rRMSE)分别为0.09、0.10、0.14、0.13和0.12。模型对一级、二级、三级和四级切花的预测值与实测值之间的r2分别为0.88、0.88、0.91和0.91,rRMSE分别为0.18、0.15、0.18和0.21。本研究建立的模型对温室切花百合外观品质指标的预测较为准确。

|
| 图 7 不同氮素水平下切花百合叶面积指数 (LAI )、出叶数 (n) 、株高 (H) 、第1花蕾长度 (LF) 、第1花蕾直径 (DF) 和出花率的预测值与实测值的比较 Fig.7 Comparison between predicted and measured leaf area index,leaf number,plant height,length of first flower bud,diameter of first flower bud and relative yield of different rank of cut lily under different nitrogen supply conditions |
从图 2、图 4和图 6可以看出,随着现蕾期叶片累积氮含量的增加,叶面积指数增加速率、株高增加速率、第1花蕾长度增加速率、第1花蕾直径增加速率均增大。当现蕾期叶片累积氮含量超过1.87×10³ mg/m2(即叶片氮浓度占叶干重的百分比为5.4%时),株高增加速率、第1花蕾长度增加速率和第1花蕾直径增加速率趋于稳定。因此,1.87×103 mg/m2 可以作为长江中下游地区温室切花百合生产中的氮素管理指标。在现蕾期,当叶片累积氮含量达到1.87×10³ mg/m2时,秋季定植(试验1、3和5,9月份定植)的土壤当季供氮量约为140.4 kg/hm2 (土壤氮浓度为65 mg/kg),冬季定植(试验4和6,12月定植)的当季土壤供氮量约为146.6 kg/hm2 (土壤氮浓度为67.9 mg/kg),春季定植(试验2,3月份定植)的土壤当季供氮量要低于140.4 kg/hm2 (图 3B)。这可能是由于不同定植期的光温条件不同(图 1),造成土壤温度不同(图 1),土壤温度通过影响氮素的吸收和利用,进而影响叶片的累积氮含量。
4 讨论在本试验研究的土壤氮浓度范围内,各氮素处理间叶片数差异不显著,这主要是因为叶片数的多少由种球的鳞片数(种球大小)决定,经过5 °C低温春化处理的百合种球花芽发育后,在植株长至10—15 cm时叶片数已趋于稳定,但初期大量叶片未展开[28]。因此叶片出叶速率主要受鳞茎内贮存营养的影响而受现蕾期叶片累积氮含量的影响极小。许多研究发现无论是单子叶植物如高粱[29]、黑麦草[30]、韭葱[31]、玉米[32]还是双子叶植物如马铃薯[33]、向日葵[34],其叶片累积氮含量对出叶速率的影响都很小,但也有少数研究发现叶片累积氮含量对玉米出叶速率有影响[35]。不同土壤氮浓度处理通过影响叶片的叶面积而影响外观品质[36]。随着土壤供氮量的增加,株高、第1花蕾长度,第1花蕾直径增大。这进一步证明切花百合中后期随着茎生根的不断生长,仍然需要从土壤中吸取足够的氮素以满足生长发育的需要[21]。与菊花现蕾期叶片累积氮含量临界值(1.62×10³ mg/m2)相比[16],百合叶片累积氮含量临界值(1.87×103 mg/m2)稍高。这可能与切花百合的花朵数多,且开花后地上部茎、叶中的营养需要回流到地下部,供给新鳞茎的生长有关。
本研究建立的模型采用综合的光温指标(冠层累积吸收辐热积)而不是定植后天数来量化外观品质随生育时期的动态变化,模拟效果较好,进一步验证了冠层累积吸收辐热积这一指标的可靠性。土壤供氮量是通过影响作物,特别是叶片累积氮含量而间接作用于作物光合作用、干物质生产与分配以及产量与品质形成[16]。本研究基于外观品质与现蕾期叶片累积氮含量的定量关系,确定了切花百合现蕾期叶片累积氮含量的适宜值,并根据现蕾期叶片累积氮含量与土壤当季供氮量(速效氮)和土壤温度的关系,进一步确定了保证现蕾期叶片累积氮含量适宜值的土壤供氮量,从而克服了以土壤氮含量作为预测指标只能应用于同一土壤或基质类型的局限。根系对不同类型土壤中氮素的吸收以及叶片中氮素的代谢和运转不同[37],进一步建立不同类型土壤切花百合现蕾期叶片累积氮含量与土壤当季供氮量的定量关系,则模型可以应用于不同土壤类型的切花百合的氮素优化管理。
本研究采用的产品外观品质指标是直接影响产品价格和生产经济效益的切花百合商品分级指标。要进一步提高模型的机理性,还需要定量研究反映氮代谢可能影响的花卉品质特征(如花枝硬度和韧度、色泽等指标及采后瓶插寿命)对氮素的响应。
此外,花卉外观品质对氮素的响应因土壤中营养元素的配比不同会有很大差异。要优化花卉作物的养分管理,还需要进一步研究多营养元素及其互作对花卉外观品质的定量影响。
5 结论本研究通过不同定植期、生长中后期不同速效氮素水平处理的试验,以冠层累积吸收辐热积为发育尺度,以现蕾期叶片累积氮含量为氮素指标,量化了不同光温条件下氮素施用水平对温室切花百合外观品质指标的动态影响,建立了氮素对切花百合外观品质影响的模拟模型。根据定植日期、土壤中速效氮含量和生长季的施氮量,温室内每小时的光合有效辐射和空气温度信息,以及土壤温度状况,模型可以动态预测温室切花百合叶面积指数、株高、第1花蕾长度、第1花蕾直径等外观品质指标和出花率,可为长江中下游地区温室切花百合氮素优化和标准化管理提供决策支持。本研究建立的模型参数通过露地栽培试验订正后,模型也可应用于指导露地栽培切花百合生产的氮素管理。要优化花卉作物的养分管理,还需进一步研究多营养元素及其互作对花卉外观品质的定量影响。
| [1] | Zhang F F, Sun J, Xie Z K. The influence of fertilization on photosynthesis and yield of oriental lily ‘Sorbonne’ under the alkaline soil in northwest China. Acta Prataculturae Sinica, 2012, 21(4): 79-87. |
| [2] | Wang Y Q, Peng Z P, Xue S C, Yang Y M, Zhou Y P, Zhao L B. Effect of excessive fertilization on soil ecological environment in the facility farmland. Journal of Agro-Environment Science, 2005, 24(S1): 81-84. |
| [3] | Tagliavini M, Scudellazi D, Marangoni B, Toselli M. Nitrogen fertilization management in orchards to reconcile productivity and environmental aspects. Fertilizer Research, 1996, 43(1/3): 93-102. |
| [4] | Sanchez C A, Doerge T A. Using nutrient uptake patterns to develop efficient nitrogen management strategies for vegetables. HortTechnology, 1999, 9(4): 601-606. |
| [5] | Khalaj M A, Edrisi B. Effect of plant spacing and nitrogen levels on quantity and quality characteristics of tuberose (polianthes tuberosa L.) under field experiment. International Journal of AgriScience, 2012, 2(3): 244-255. |
| [6] | Ménard C, Dansereau B, Garello G, Le Page-Degivry M T. Influence of nitrogen supply on ABA levels and flower senescence in Rosa hybrida cv Royalty. Acta Horticulturae, 1996, 424: 151-155. |
| [7] | Eveleens-Clark B, Carvalho S M P, Heuvelink E. A conceptual dynamic model for external quality in Kalanchoe. Acta Horticulturae, 2004, 654: 263-270. |
| [8] | Yang Z Q, Luo W H, Chen F D, Gu J J, Li X M, Ding Q F, Zhao C B, Lu Y F. Quality prediction model of greenhouse standard cut chrysanthemum based on light-temperature effect. Chinese Journal of Applied Ecology, 2007, 18(4): 877-882. |
| [9] | Zhang H J, Dai J F, Luo W H, Zhuang K M, Wei Y G, Zhang O. Model for simulating development and growth of pot planted poinsettia (Euphorbia pulcherrima) grown in greenhouse. Transactions of the Chinese Society of Agricultural Engineering, 2009, 25(11): 241-247. |
| [10] | Li G, Chen Y R, Dai J F, Luo W H, Zhao T L, Zhu P B. A model for predicting flowering date and external quality of cut tulip in solar greenhouse. Acta Ecologica Sinica, 2011, 31(14): 4062-4071. |
| [11] | Zou C C. A Model for Predicting the Flowering Date and External Quality of Lily Grown in Traditional Chinese Solar Greenhouse[D]. Nanjing: Nanjing Agricultural University, 2011. |
| [12] | Li Y F, Fang W M, Chen F D, Shi C L. A quality prediction model for spray cut chrysanthemums in a solar greenhouse. Journal of Zhejiang Forestry College, 2010, 27(3): 404-409. |
| [13] | Zhang X Y, Liu F, Wang F Y, Liu S Y, Feng W J, Shang M H, Zhu J H. Simulation of dry matter partitioning and marketing date of greenhouse Phalaenopsis aphrodita Rchb. F. flower. Chinese Journal of Eco-Agriculture, 2008, 16(6): 1453-1457. |
| [14] | Tan M. Simulation of Cymbidium hybridum Growth and Development Based on Production of Thermal Effectiveness and Photosynthetically Active Radiation [D]. Beijing: Beijing Forestry University, 2011. |
| [15] | Chen L L, Zhong S L, Dai J F, Li G, Luo W H, Shao H P, Zhang N N. A temperature management model for controlling flowering date and external quality of Dendrobium in greenhouse. Science China: Information Sciences, 2010, 40(S1): 232-243. |
| [16] | Ding Q F, Dai J F, Luo W H, Mi X J, Chen Y S, Zhao C J, Qiao X J, Liu K X. Simulating the effects of nitrogen on external quality indices of standard cutting chrysanthemum‘Shenma’in solar greenhouse. Scientia Agricultura Sinica, 2009, 42(1): 363-369. |
| [17] | Kang H M, Zhang Q X, Pan H T. Effects of nitrogen nutrient on the cut rose flower quality. Journal of Henan Agricultural University, 2012, 46(3): 284-286, 297-297. |
| [18] | Guo Y H, Ma W Q. Nutrient uptake and distribution in oriental hybrids of lily. Chinese Journal of Soil Science, 2004, 35(6):753-757. |
| [19] | Qasim M, Ahmad I, Nadeem A. Influence of various nitrogen levels on growth and biomass of Jasminum sambac. Pakistan Journal of Agricultural Sciences, 2003, 40(3/4): 144-150. |
| [20] | Acharya M M, Dashora L K. Response of graded levels of nitrogen and phosphorus on vegetative growth and flowering in African marigold (Tagetes erecta Linn.). Journal of Ornamental Horticulture, 2004, 7(2): 179-183. |
| [21] | Sajid G M, Kaukab M, Ahmad Z. Foliar application of plant growth regulators (PGRs) and nutrients for improvement of lily flowers. Pakistan Journal of Botany, 2009, 41(1): 233-237. |
| [22] | Holcomb E J, Gamez S, Beattie D, Elliott G C. Efficiency of fertigation programs for baltic ivy and asiatic lily. HortTechnology, 1992, 2(1): 43-46. |
| [23] | Mi X J, Dai J F, Luo W H, Ding Q F, Chen Y S, Zhao C J, Qiao X J, Liu K X. Quantifying the effects of nitrogen on dry matter partitioning of standard cut chrysanthemum ‘Shenma’ in solar greenhouse. Chinese Journal of Plant Ecology, 2009, 33(1): 108-117. |
| [24] | Dong Y Y, Li G, An D S, Luo W H. Simulation model for predicting effects of substrate water potential on leaf area of cut lily. Transactions of the Chinese Society of Agricultural Engineering, 2012, 28(3): 191-197. |
| [25] | Afforestation Secretary of the State Forestry Administration. GB/T 18247.1-2000 product grade for major ornamental plants-part 1: cut flowers. Beijing: Standards Press of China, 2001. |
| [26] | Dong W, Yin X D, Li J L, Pei Z B, Wu J X, Yang X Q, Zhang C L, Yu C X. Technical rules for the production of lily cut flowers. Journal of Central South Forestry University, 2003, 23(5): 107-111. |
| [27] | Xu R, Dai J, Luo W, Yin X, Li Y, Tai X, Han L, Chen Y, Lin L, Li G, Zou C, Du W, Diao M. A photothermal model of leaf area index for greenhouse crops. Agricultural and Forest Meteorology, 2010, 150(4): 541-552. |
| [28] | Cai X M, Fang S Z, Zheng D J, Lin Z, Lin J. Development process and physiological changes of Lilium oriental "Sorbonne". Acta Agriculturae Boreali-Occidentalis Sinica, 2006, 15(1): 176-179. |
| [29] | Muchow R C. Effect of nitrogen supply on the comparative productivity of maize and sorghum in a semi-arid tropical environment. I. Leaf growth and leaf nitrogen. Field Crops Research, 1988, 18(1): 1-16. |
| [30] | Van Loo E N. On the Relation between Tillering, Leaf Area Dynamics and Growth of Perennial Ryegrass (Lolium perenne L.) [D]. The Netherlands: Wageningen Agricultural University, 1993. |
| [31] | Biemond H. Effects of nitrogen on development and growth of the leaves of vegetables. 2. Appearance, expansion growth and life span of leaves of leek plants. NJAS-Wageningen Journal of Life Sciences, 1995, 43(2): 233-246. |
| [32] | Vos J, van der Putten P E L, Birch C J. Effect of nitrogen supply on leaf appearance, leaf growth, leaf nitrogen economy and photosynthetic capacity in maize (Zea mays L.). Field Crops Research, 2005, 93(1): 64-73. |
| [33] | Vos J, Biemond H. Effects of nitrogen on the development and growth of the potato plant. I. Leaf appearance, expansion growth, life spans of leaves and stem branching. Annals of Botany, 1992, 70(1): 27-35. |
| [34] | Trápani N, Hall A J. Effects of leaf position and nitrogen supply on the expansion of leaves of field grown sunflower (Helianthus annuus L.). Plant and Soil, 1996, 184(2): 331-340. |
| [35] | McCullough D E, Girardin P, Mihajlovic M, Aguilera A, Tollenaar M. Influence of N supply on development and dry matter accumulation of an old and a new maize hybrid. Canadian Journal of Plant Science, 1994, 74(3): 471-477. |
| [36] | Roberts A N, Stang J R, Wang Y T, McCorkle W R, Riddle L L, Moeller F W. Easter Lily Growth and Development. Corvallis: Technical Bulletin, 1985: 5-74. |
| [37] | Kim T H, Chun Y T, Kim K Y, Chung S J. Root zone temperature effects on nitrate assimilation and xylem transport in hydroponically grown cucumber plants. Acta Horticulturae, 2002, 588: 59-62. |
| [1] | 张芬芬, 孙娟, 谢忠奎. 西北碱性土壤施肥对东方百合‘索邦’光合及种球产量的影响. 草业学报, 2012, 21(4): 79-87. |
| [2] | 王艳群, 彭正萍, 薛世川, 杨云马, 周亚鹏, 赵立宾. 过量施肥对设施农田土壤生态环境的影响. 农业环境科学学报, 2005, 24(S1): 81-84. |
| [8] | 杨再强, 罗卫红, 陈发棣, 顾俊杰, 李向茂, 丁琪峰, 赵才标, 陆亚凡. 基于光温的温室标准切花菊品质预测模型. 应用生态学报, 2007, 18(4): 877-882. |
| [9] | 张红菊, 戴剑锋, 罗卫红, 庄克明, 魏猷刚, 章鸥. 温室盆栽一品红生长发育模拟模型. 农业工程学报, 2009, 25(11): 241-247. |
| [10] | 李刚, 陈亚茹, 戴剑锋, 罗卫红, 赵统利, 朱朋波. 日光温室切花郁金香花期与外观品质预测模型. 生态学报, 2011, 31(14): 4062-4071. |
| [11] | 邹聪聪. 日光温室切花百合花期和外观品质的预测模型 [D]. 南京: 南京农业大学, 2011. |
| [12] | 李玉发, 房伟民, 陈发棣, 石常磊. 日光温室多头切花菊品质模拟. 浙江林学院学报, 2010, 27(3): 404-409. |
| [13] | 张晓艳, 刘锋, 王风云, 刘淑云, 封文杰, 尚明华, 朱建华. 温室蝴蝶兰干物质分配及产品上市期模拟研究. 中国生态农业学报, 2008, 16(6): 1453-1457. |
| [14] | 谭美. 基于辐热积的大花蕙兰生长发育模拟研究 [D]. 北京: 北京林业大学, 2011. |
| [15] | 陈莉莉, 钟双林, 戴剑锋, 李刚, 罗卫红, 邵和平, 张宁宁. 温室春石斛兰花期与外观品质温度调控模型. 中国科学: 信息科学, 2010, 40(S1): 232-243. |
| [16] | 丁琪峰, 戴剑锋, 罗卫红, 米晓洁, 陈永山, 赵春江, 乔晓军, 刘克信. 氮素对日光温室独本菊‘神马’外观品质影响的模拟. 中国农业科学, 2009, 42(1): 363-369. |
| [17] | 康红梅, 张启翔, 潘会堂. 氮素营养对切花月季品质的影响. 河南农业大学学报, 2012, 46(3): 284-286, 297-297. |
| [18] | 郭友红, 马文奇. 东方百合养分吸收规律和分配特点的研究. 土壤通报, 2004, 35(6): 753-757. |
| [23] | 米晓洁, 戴剑锋, 罗卫红, 丁琪峰, 陈永山, 赵春江, 乔晓军, 刘克信. 氮素对日光温室独本菊品种‘神马’干物质分配影响的模拟. 植物生态学报, 2009, 33(1): 108-117. |
| [24] | 董永义, 李刚, 安东升, 罗卫红. 水分对切花百合叶面积影响的预测模型研究. 农业工程学报, 2012, 28(3): 191-197. |
| [25] | 国家林业局植树造林司. GB/T 18247.1—2000 主要花卉产品等级,第1部分: 鲜切花. 北京: 中国标准出版社, 2001. |
| [26] | 董伟, 殷小冬, 李技林, 裴作斌, 吴建祥, 杨晓琴, 张翠兰, 余朝秀. 百合商品切花生产技术规程. 中南林学院学报, 2003, 23(5): 107-111. |
| [28] | 蔡宣梅, 方少忠, 郑大江, 林真, 林婕. 东方百合‘索蚌Sorbonne’ 生长发育进程及一些生理生化变化. 西北农业学报, 2006, 15(1): 176-179. |