 2014, Vol. 34
文章信息
- 钟莉娜, 赵文武, 吕一河, 刘源鑫
- ZHONG Lina, ZHAO Wenwu, LÜ Yihe, LIU Yuanxin
- 黄土丘陵沟壑区景观格局演变特征——以陕西省延安市为例
- Analysis of landscape pattern evolution characteristic in the hilly and gully area of loess plateau:a case study in Yan’an City, Shaanxi Province
- 生态学报, 2014, 34(12): 3368-3377
- Acta Ecologica Sinica, 2014, 34(12): 3368-3377
- http://dx.doi.org/10.5846/stxb201310202531
-
文章历史
- 收稿日期:2013-10-20
- 修订日期:2014-4-1


2. 中国科学院生态环境研究中心 城市与区域生态国家重点实验室, 北京 100085
2. State Key Laboratory of Urban and Regional Ecology, Research Center for Eco-Environmental Sciences, Chinese Academy of Sciences, Beijing 100085, China
景观生态学中的景观格局一般指空间格局,是指大小和形状不一的景观斑块在空间上的配置[1, 2]。景观格局变化与气候变化、土地利用/土地覆被变化及生物多样性变化密切相关,了解景观格局的演变特征是进行景观格局分析的前提与基础[3, 4, 5, 6]。近年来,景观格局演变及其对生态过程的影响引起了国际学者的广泛关注,成为当前景观生态学研究中的热点问题[7, 8, 9]。学者们对景观格局演变的分析多是利用景观格局指数、景观单元类型转移矩阵等方法,从景观格局的变化特征、驱动机制以及对景观格局的模型预测等不同角度进行探讨[10, 11, 12, 13, 14, 15],但是景观指数反映的是景观格局的几何特征,往往难以揭示景观格局变化的深层规律,而模型方法也存在着很大的不确定性。在景观格局变化的定量评估方面尚需要探索新的适用性方法。
黄土高原是世界上最大的黄土堆积区,人类活动历史悠久,自然环境脆弱。对黄土高原地区景观格局变化的研究一直是国内学者研究的热点问题之一[16, 17, 18]。本文以黄土丘陵沟壑区延安市为例,基于景观生态学理论,借助GIS技术,利用多距离空间聚类分析、主要景观演变类型的地形梯度分析等方法定量研究了1985—2008年延安市景观格局的演变特征和主要演变类型的空间分异规律,以期为研究区土地利用和生态系统管理提供可能参考。
1 研究区概况延安市位于黄河中游,地处北纬35°21′—37°31′,东经107°41′—110°31′之间,属黄土丘陵沟壑区,山川塬交错,沟梁峁纵横,地形复杂、地貌独特。地势西北高东南低,平均海拔约1200 m。延安属高原大陆性季风气候,北部属半干旱地区,南部属半湿润地区。延安市北连榆林市,南接关中咸阳、铜川、渭南3市,东隔黄河与山西省临汾市、吕梁市相望,西依子午岭与甘肃省庆阳市为邻(图 1)[19]。

|
| 图 1 研究区位置示意图 Fig. 1 Location of the study area |
本研究以延安市1985年、2000年和2008年3期1 ∶ 25万景观单元类型图,1 ∶ 5万地形图生成的数字高程模型(DEM)为基本图件,分析延安市景观格局的演变特征。在ArcGIS 9.3平台支持下,基于DEM数据获取研究区高程图、坡度图和坡向图。景观单元类型图来源于中国1 ∶ 25万土地覆盖遥感调查与监测数据库,该数据库是在“国家科学数据共享工程——地球系统科学共享网”的支持下,由中国科学院遥感应用研究所等7个单位,在全国1 ∶ 10万土地利用数据和遥感分类数据的基础上,采用全数字作业方式共同完成,数据精度在80%以上(不同类型有差异)。结合当地土地利用现状和土地资源特点,参考国内外土地利用分类系统,将延安市景观单元划分为七种类型,分别是林地、灌木、草地、农田、聚落、水体和裸地。
2.2 研究方法本研究采用空间统计和数理统计方法对1985年至2008年延安市不同景观单元类型的数量变化进行分析。
(1)景观单元类型变化特征分析
为探讨不同景观组分之间复杂的相互转化过程,基于ArcGIS 9.3操作平台,将3期景观单元类型图进行了空间叠置运算,由此得到景观单元类型转移矩阵,初步分析延安市景观单元类型的动态变化过程。
(2)空间聚类分析
用Ripley K函数对延安市景观格局进行多距离空间聚类分析,Ripley K函数的公式如下:
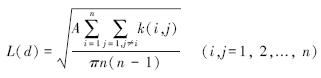
式中,A为研究区面积,n为点的个数,d为期望值(随机空间模式),L(d)为观测值(研究区特定距离的空间模式),k(i,j)为权重。L(d)>d表明与景观类型呈聚集分布;L(d)=d表示景观单元类型呈随机分布,L(d)<d表示该景观单元类型的离散程度较高。Ripley K函数分析会在结果中生成置信区间,如果L(d)大于(小于)置信区间上限值(下限值),则该距离的空间聚集(离散)具有统计学上的显著性。L(d)的第一个峰值所对应的值表示景观单元类型间聚集的特征空间尺度,可用来度量分布强度或拥挤度[20]。
本研究分析了研究区4种主要景观单元类型(林地、灌木、草地、农田)在1985—2008年的空间聚集情况,分析其在二维空间上的演变特征。基于ArcGIS 9.3 软件生成2000个随机点图层,将该图层分别与三期景观单元类型图叠加以确定随机点的景观单元类型,然后利用多距离空间聚类工具对不同时期的不同景观单元类型进行Ripley K函数分析。
(3)景观格局变化的地形分布特征分析
1985年和2008年的景观单元类型图叠加得到1985—2008年景观单元演变类型图。将景观单元演变类型图与基于DEM数据获取的研究区高程数据、坡度数据和坡向数据进行空间叠加分析,并对所获得的数据进行数理统计,以揭示其景观格局变化在三维空间上的演变特征。
由表 1、图 2和图 3可知,研究区草地面积最大,三期景观单元类型图中草地所占的面积比例均在40%以上;农田面积次之,比例在16.18%—31.50%之间,呈下降趋势,是研究期间降幅最大的景观单元类型。与此同时灌木、林地和草地的面积均呈现增加趋势,灌木从1985年的14.89%增加到了2008年的16.18%,林地从1985年的8.45%增加到了2008年的10.10%,草地面积增幅最大,从1985年的44.68%增加到了2008年的56.16%。聚落和水体面积总体上呈现增加趋势,裸地面积先增后减。

|
| 图 2 延安市景观单元类型图 Fig. 2 Landscape type map of Yan′an City |

|
| 图 3 景观单元类型面积比较 Fig. 3 Comparison of landscape type area |
| 景观单元类型 Landscape type | 1985年 | 2000年 | 2008年 | |||
| 面积/km2 Area | 百分比/% Percentage | 面积/km2 Area | 百分比/% Percentage | 面积/km2 Area | 百分比/% Percentage | |
| 林地 Forest | 3121.88 | 8.45 | 3629.30 | 9.82 | 3732.58 | 10.10 |
| 灌木 Bush | 5500.82 | 14.89 | 5608.12 | 15.18 | 5980.00 | 16.18 |
| 草地 Grassland | 16511.56 | 44.68 | 16122.15 | 43.63 | 20752.07 | 56.16 |
| 农地 Farmland | 11640.18 | 31.50 | 11291.87 | 30.56 | 6203.05 | 16.79 |
| 聚落 Settlement | 29.40 | 0.08 | 130.94 | 0.35 | 132.83 | 0.36 |
| 水体 Water body | 145.55 | 0.39 | 148.39 | 0.40 | 148.75 | 0.40 |
| 裸地 Bare land | 2.52 | 0.01 | 21.13 | 0.06 | 2.63 | 0.01 |
林地和草地主要分布在延安市的东南和西南方向,农地主要分布在延安市的北部,聚落、水体、裸地面积较小(图 2)。在1985年和2000年,农田和草地是延安市的优势景观单元类型,由于当地推行退耕还林(还草)政策,至2008年,延安市农地数量急剧减少,林地、灌木和草地的数量增加。总体来看,林地、灌木、草地和农田四者所占的面积比例达到了研究区面积的99%以上。
3.2 景观单元的类型变化特征从1985—2000年景观单元类型的演变情况(表 2)来看,林地主要转变为草地和农田,总变化率约为1.6%,保留了原有林地面积的97.9%;灌木主要转变为林地、草地和农田;草地主要向农田、林地和灌木流转;农田主要转变为草地和林地,其次是灌木和聚落;此外,聚落主要转变为草地,水体主要转变成农田,裸地和农田相互转换。在不同景观单元类型演变过程中,草地演变为农田的面积最大,这反映了在20世纪90年代延安市开荒种田、增加耕地面积的现象较为普遍。作为陕北地区政治、经济和文化中心,1985—2000年延安市社会经济快速发展,是期间影响延安市景观格局演变的重要驱动因子[21, 22]。
| 景观单元类型 Landscape type | 2000年 | |||||||
| 林地 Forest | 灌木 Bush | 草地 Grassland | 农田 Farmland | 聚落 Settlement | 水体 Water body | 裸地 Bare land | ||
| 1985年 | 林地 Forest/km2 | 3057.22 | 13.59 | 23.70 | 25.96 | 1.01 | 0.40 | 0.00 |
| 灌木 Bush/km2 | 63.29 | 5296.31 | 71.89 | 67.23 | 0.57 | 1.52 | 0.00 | |
| 草地 Grassland/km2 | 214.86 | 212.32 | 5654.96 | 405.11 | 14.82 | 8.72 | 0.79 | |
| 农田 Farmland/km2 | 291.88 | 85.43 | 367.71 | 10786.48 | 86.32 | 3.66 | 18.70 | |
| 聚落 Settlement/km2 | 0.15 | 0.13 | 1.68 | 0.34 | 26.98 | 0.12 | 0.00 | |
| 水体 Water body/km2 | 1.83 | 0.34 | 2.07 | 6.10 | 1.24 | 133.98 | 0.00 | |
| 裸地 Bare land/km2 | 0.07 | 0.00 | 0.14 | 0.66 | 0.00 | 0.00 | 1.65 | |
从2000—2008年景观单元类型的变化情况(表 3)来看,林地主要向草地和农田流转,灌木主要转变为草地,草地主要转变为灌木和农田。同时,大面积的农田主要转变为草地、灌木和林地,变化面积可达5112.62 km2,这主要是退耕还林还草政策实施的结果[22]。此外,聚落和水体与其他景观单元类型之间的转变较少,部分裸地转变为农田。
| 景观单元类型 Landscape type | 2000年 | |||||||
| 林地 Forest | 灌木 Bush | 草地 Grassland | 农田 Farmland | 聚落 Settlement | 水体 Water body | 裸地 Bare land | ||
| 2000年 | 林地 Forest/km2 | 3619.02 | 0.00 | 9.62 | 0.51 | 0.16 | 0.00 | 0.00 |
| 灌木 Bush/km2 | 0.00 | 5606.84 | 0.92 | 0.37 | 0.00 | 0.00 | 0.00 | |
| 草地 Grassland/km2 | 0.00 | 6.20 | 20741.41 | 5.59 | 0.57 | 0.48 | 0.00 | |
| 农田 Farmland/km2 | 113.56 | 366.96 | 4632.10 | 6178.09 | 1.16 | 0.00 | 0.00 | |
| 聚落 Settlement/km2 | 0.00 | 0.00 | 0.00 | 0.00 | 130.94 | 0.00 | 0.00 | |
| 水体 Water body/km2 | 0.00 | 0.00 | 0.12 | 0.00 | 0.00 | 148.27 | 0.00 | |
| 裸地 Bare land/km2 | 0.00 | 0.00 | 0.00 | 18.50 | 0.00 | 0.00 | 2.63 | |
1985—2008年间延安市各景观单元类型的演变较为复杂,但景观单元类型的演变主要表现为林地、灌木、草地和农田之间的相互转换以及农田向聚落的流转(表 4)。其中,农田转变为灌木和林地的面积占总变化面积的49.44%。我国政府在1999年推行的“退耕还林(还草)”等水土保持政策是农田演变为林地和灌木的重要驱动因子[22, 23]。
| 景观演变类型 Landscape evolution type | 演变 面积/km2 Evolution area | 占总演变面 积的比例/% The proportion of the total area |
| 林地转为灌木 Forest into bush | 15.51 | 0.90 |
| 林地转为草地 Forest into grassland | 42.88 | 2.49 |
| 林地转为农田 Forest into farmland | 15.11 | 0.88 |
| 灌木转为林地 Bush into forest | 64.28 | 3.74 |
| 灌木转为草地 Bush into grassland | 109.09 | 6.35 |
| 灌木转为农田 Bush into farmland | 31.28 | 1.82 |
| 草地转为灌木 Grassland into bush | 238.41 | 13.87 |
| 草地转为农田 Grassland into farmland | 214.88 | 12.50 |
| 农田转为林地 Farmland into forest | 409.00 | 23.79 |
| 农田转为灌木 Farmland into bush | 441.01 | 25.65 |
| 农田转为聚落 Farmland into settlement | 89.56 | 5.21 |
| 合计 Total | 1671.01 | 97.20 |
景观单元类型的演变是一个动态的过程。景观单元类型的空间聚集特征在一定程度上可以反映人类活动对自然景观演变的影响。研究景观单元类型的空间集聚特征可以为调整人类社会经济活动、优化土地利用格局提供科学依据。
综合分析表 5和图 4,1985年研究区林地聚集的最大尺度为16 km,随着观测距离的增加,林地依然呈聚集分布,未有离散趋势(L(d)>d)。观测值明显高于置信区间的上限值,表明林地在1985年、2000年和2008年的聚集特征具有统计学上的显著性。2000年和2008年林地聚集的最大尺度均为10 km,与1985年相比有所降低,但观测距离内未出现离散格局。
| 林地 Forest | 灌木 Bush | 草地 Grassland | 农田 Farmland | |||||
| 聚集Cluster | 离散Scatter | 聚集Cluster | 离散Scatter | 聚集Cluster | 离散Scatter | 聚集Cluster | 离散Scatter | |
| 1985年 | 16 | 12 | 25 | 55 | 10 | |||
| 2000年 | 10 | 11 | 24 | 55 | 12 | 55 | ||
| 2008年 | 10 | 11 | 18 | 12 | 55 | |||

|
| 图 4 不同时期各景观单元类型多距离空间聚集图 Fig. 4 Multi-distance spatial cluster for different landscape types in 1985,2000 and 2008 |
1985年灌木聚集的最大尺度为12 km。该景观单元类型在观测距离内未出现离散格局,且空间聚集特征具有统计学上的显著性(L(d)>d)。2000年和2008年灌木聚集的最大尺度均为11 km,其他聚集特征与1985年相似。
1985年、2000年和2008年草地聚集的最大尺度分别是25 km、24 km和18 km。总体来看,草地在研究期内呈聚集分布(L(d)>d),但聚集强度较低。特别是2000年时,当观测距离增加到55 km时,出现了离散分布(L(d)<d)。研究结果具有统计学上的显著性。
农田聚集的最大尺度1985年为10 km,2000年和2008年是12 km。研究期内呈聚集分布(L(d)>d),但聚集强度较低,有离散的趋势。2000年和2008年,在观测距离为55 km时出现了离散分布(L(d)<d)。
1985—2008年,林地、灌木和草地聚集的最大尺度减小,农田聚集的最大尺度增大,说明研究期内林地、灌木和草地在二维空间上逐渐聚集,而农田在二维空间上逐渐分散。研究期内林地、灌木和草地面积增加,而农田面积减少的驱动因素——退耕还林(还草)政策,同时也是林地、灌木和草地在二维空间上逐渐聚集,农田趋于分散的驱动因素。
基于1 ∶ 5万数字高程模型(DEM),利用ArcGIS 9.3软件获取高程图、坡度图和坡向图,将高程图、坡度图和坡向图分级,并分别与主要景观单元演变类型数据进行空间叠加分析,经统计得到主要景观单元演变类型在不同高程、坡度、坡向的分布情况(表 6—表 8)。
| 景观单元演变类型 Landscape evolution type | <700 m | 700—900 m | 900—1100 m | 1100—1300 m | 1300—1500 m | >1500 m |
| 林地转为灌木 Forest into bush | 0.00 | 0.00 | 4.71 | 32.02 | 48.00 | 15.27 |
| 林地转为草地 Forest into grassland | 0.00 | 0.76 | 9.60 | 28.15 | 41.32 | 20.17 |
| 林地转为农田 Forest into farmland | 0.26 | 2.46 | 14.67 | 15.93 | 40.24 | 26.44 |
| 灌木转为林地 Bush into forest | 0.08 | 0.50 | 21.22 | 43.23 | 30.22 | 4.75 |
| 灌木转为草地 Bush into grassland | 0.07 | 1.12 | 27.65 | 39.04 | 26.11 | 6.01 |
| 灌木转为农田 Bush into farmland | 0.75 | 2.82 | 25.72 | 34.17 | 29.81 | 6.73 |
| 草地转为灌木 Grassland into bush | 0.05 | 1.83 | 27.15 | 45.45 | 20.78 | 4.74 |
| 草地转为农田 Grassland into farmland | 1.20 | 4.66 | 21.19 | 28.91 | 25.32 | 18.71 |
| 农田转为林地 Farmland into forest | 0.05 | 3.54 | 30.69 | 33.48 | 23.42 | 8.82 |
| 农田转为灌木 Farmland into bush | 0.03 | 1.28 | 20.09 | 41.10 | 32.23 | 5.27 |
| 农田转为聚落 Farmland into settlement | 0.14 | 3.34 | 46.78 | 43.94 | 5.10 | 0.71 |
| 景观单元演变类型 Landscape evolution type | <7° | 7°—14° | 14°—21° | 21°—28° | >28° |
| 林地转为灌木 Forest into bush | 11.61 | 26.72 | 29.67 | 18.65 | 13.36 |
| 林地转为草地 Forest into grassland | 11.73 | 27.36 | 29.34 | 18.00 | 13.57 |
| 林地转为农田 Forest into farmland | 19.61 | 34.53 | 28.95 | 13.30 | 3.61 |
| 灌木转为林地 Bush into forest | 12.48 | 29.84 | 31.47 | 17.85 | 8.36 |
| 灌木转为草地 Bush into grassland | 13.07 | 29.60 | 31.09 | 18.50 | 7.74 |
| 灌木转为农田 Bush into farmland | 18.79 | 34.56 | 27.82 | 14.31 | 4.53 |
| 草地转为灌木 Grassland into bush | 13.73 | 30.63 | 30.90 | 17.36 | 7.37 |
| 草地转为农田 Grassland into farmland | 17.50 | 33.05 | 29.20 | 15.09 | 5.16 |
| 农田转为林地 Farmland into forest | 16.05 | 29.45 | 30.00 | 17.62 | 6.89 |
| 农田转为灌木 Farmland into bush | 12.43 | 30.24 | 31.95 | 18.17 | 7.21 |
| 农田转为聚落 Farmland into settlement | 61.61 | 22.28 | 10.82 | 4.10 | 1.19 |
| 景观单元演变类型 Landscape evolution type | 平地 Flat | 北 North | 西北 Northwest | 西 West | 西南 Southwest | 南 South | 东南 Southeast | 东 East | 东北 Northeast |
| 阴影部分为不同景观单元演变类型所占面积比例较大的坡向 | |||||||||
| 林地转为灌木 Forest into bush | 0.02 | 10.66 | 13.99 | 15.18 | 14.53 | 9.09 | 10.81 | 12.84 | 12.88 |
| 林地转为草地 Forest into grassland | 0.01 | 13.10 | 11.83 | 12.24 | 11.95 | 10.07 | 10.85 | 14.61 | 15.34 |
| 林地转为农田 Forest into farmland | 0.03 | 11.68 | 9.96 | 8.71 | 8.97 | 10.80 | 14.96 | 19.98 | 14.91 |
| 灌木转为林地 Bush into forest | 0.02 | 13.09 | 16.89 | 16.51 | 12.46 | 9.12 | 9.62 | 10.78 | 11.52 |
| 灌木转为草地 Bush into grassland | 0.01 | 11.44 | 11.39 | 10.79 | 10.02 | 11.36 | 14.06 | 16.20 | 14.73 |
| 灌木转为农田 Bush into farmland | 0.03 | 11.94 | 10.20 | 10.27 | 11.30 | 10.65 | 13.64 | 16.24 | 15.72 |
| 草地转为灌木 Grassland into bush | 0.01 | 13.60 | 14.82 | 13.35 | 11.96 | 10.17 | 10.95 | 11.90 | 13.23 |
| 草地转为农田 Grassland into farmland | 0.04 | 9.92 | 10.39 | 10.36 | 10.66 | 11.27 | 16.30 | 17.48 | 13.57 |
| 农田转为林地 Farmland into forest | 0.03 | 12.81 | 14.63 | 12.97 | 10.37 | 9.07 | 12.43 | 14.17 | 13.52 |
| 农田转为灌木 Farmland into bush | 0.01 | 12.69 | 13.36 | 11.61 | 9.18 | 9.22 | 13.43 | 15.87 | 14.62 |
| 农田转为聚落 Farmland into settlement | 0.39 | 8.47 | 9.01 | 10.55 | 13.92 | 16.07 | 17.47 | 13.69 | 10.43 |
景观单元演变类型的主要分布坡向如表 8所示,在西坡和西南坡上林地转变为灌木的面积较大、东坡和东北坡上林地转变为草地的面积较大。表 8中的阴影部分为不同景观单元演变类型所占面积比例较大的坡向。一般情况下,坡向通过影响土壤水分和日照时数对地表景观格局产生影响。不同坡向有各自适宜生长的植被类型。若不加人类活动的干扰,不同坡向上景观单元类型的演变是相当缓慢的。但是,退耕还林以来,延安市实行了一系列土地利用结构调整措施,包括将原有坡耕地退耕,坡耕地改为水平梯田,扩大人工乔灌木面积等。这些措施是延安市景观单元演变坡向分异的主要原因[24]。
分析主要景观单元演变类型在各高程梯度、坡度梯度、坡向梯度分布的数据发现这种景观格局变化具有较为明显的空间分布规律,尤其与高程和坡度因子密切相关。其中,农田向聚落的转变主要发生在海拔介于900—1300 m的区域和坡度小于7°的区域,可见农田向聚落的转变主要发生在海拔偏低、坡度较缓的平川缓丘地带。林地向灌木、草地和农田的转变主要发生在海拔高于1100 m的区域和坡度介于7°—21°之间的区域。灌木和草地向其他主要景观单元类型的转变主要发生在海拔介于1100—1500 m的区域和坡度介于7°—21°之间的区域。
4 结论与讨论林地、灌木、草地和农田构成了延安市的复合景观,其他景观单元类型以斑块或廊道形式镶嵌其中。1985—2008年林地、灌木和草地的面积均有明显增加,农地面积明显减少。通过分析景观转移矩阵发现流失的农田主要转变为林地、灌木、草地和聚落。
本研究从空间聚集特征和地形梯度特征两个方面分析了延安市景观格局在二维空间和三维空间上演变的空间分异规律。研究区林地、灌木和农田聚集的最大尺度差别不大,但草地空间聚集的最大尺度较大,可达到25 km。1985—2008年,林地、灌木和草地聚集的最大尺度减小,而农田聚集的最大尺度增大。林地和灌木呈现显著的聚集格局,农田和草地的空间聚集强度明显小于林地和灌木。2000年,观测距离为55 km处草地和农田出现了离散分布格局,2008年农田在观测距离为55 km处也出现了离散分布格局。延安市主要景观单元类型的演变大都发生在海拔介于1100—1500 m的区域和坡度介于7—21°之间的区域,这个区域也是耕地比较集中的区域。农田向聚落的演变主要发生在海拔较低(900—1300 m)、坡度较缓(<7°)的平川缓丘地带。主要景观单元演变类型在坡向上没有明显的分布规律。
1999年之前延安市经济迅速发展、城镇化速度加快、人口增加,对粮食的需求量增加,导致耕地和聚落面积增加,其他景观单元类型面积减少。1999年之后,我国政府在黄土高原地区推行退耕还林(还草)、将坡耕地改为水平梯田、修建水平梯田等一系列水土流失治理措施,导致了林地、草地、灌木面积的增加和聚集尺度的减小,以及耕地面积的减少和聚集尺度的增大。退耕还林(还草)等一系列水土流失治理措施的推行是1999年之后推动延安市景观格局演变的主要因素。
| [1] | Wu G Y, Li H B. The theoretical development of landscape ecology//Wu J G. Contemporary Ecological Theory. Beijing: China Science and Technology Press, 1992. |
| [2] | Fu B J, Chen L D, Ma K M. Landscape Ecology Principles and Applications. Beijing: Science Press, 2001. |
| [3] | Su S L, Xiao R, Jiang Z L, Zhang Y. Characterizing landscape pattern and ecosystem service value changes for urbanization impacts at an eco-regional scale. Applied Geography, 2012, 34: 295-305. |
| [4] | Zhang C, Lü S H, Feng C Y, Zheng Z R. Ecological safety assessment in Hulunbeier steppe based on the landscape pattern. Advanced Materials Research, 2013, 726-731: 1121-1129. |
| [5] | Hassett E M, Stehman S V, Wickham J D. Estimating landscape pattern metrics from a sample of land cover. Landscape Ecology, 2012, 27(1): 133-149. |
| [6] | Paudel S, Yuan F. Assessing landscape changes and dynamics using patch analysis and GIS modeling. International Journal of Applied Earth Observation and Geoinformation, 2012, 16: 66-76. |
| [7] | Jones K B, Zurlini G, Kienast F, Petrosillo I, Edwards T, Wade T G, Li B, Zaccarelli N. Informing landscape planning and design for sustaining ecosystem services from existing spatial patterns and knowledge. Landscape Ecology, 2013, 28(6): 1-18. |
| [8] | Burel F, Lavigne C, Marshall E J P, Moonen A C, Ouin A, Poggio S L. Landscape ecology and biodiversity in agricultural landscapes Agriculture. Ecosystems & Environment, 2013, 166: 1-2. |
| [9] | Gustafson E J. Using expert knowledge in landscape ecology. Landscape Ecology, 2013, 28(2): 365-366. |
| [10] | Dewan A M, Yamaguchi Y, Rahman M Z. Dynamics of land use/cover changes and the analysis of landscape fragmentation in Dhaka Metropolitan, Bangladesh. GeoJournal, 2012, 77(3): 315-330. |
| [11] | Huang L B, Bai J H, Yan D H, Chen B, Xiao R, Gao H F. Changes of wetland landscape patterns in Dadu River catchment from 1985 to 2000, China. Frontiers of Earth Science, 2012, 6(3): 237-249. |
| [12] | Ramachandra T V, Aithal B H, Sanna D D. Insights to urban dynamics through landscape spatial pattern analysis. International Journal of Applied Earth Observation and Geoinformation, 2012, 18: 329-343. |
| [13] | Brown D G, Verburg P H, Pontius R G Jr, Lange M D. Opportunities to improve impact, integration, and evaluation of land change models. Current Opinion in Environmental Sustainability, 2013, 5(5): 452-457. |
| [14] | Bi X L, Zhou R, Liu L J, Hong J, Wang X Z, Wang H, Suo A N, Ge J P. Gradient variations in landscape pattern along the Jinghe River and their driving forces. Acta Ecologica Sinca, 2005, 25(5): 1041-1047. |
| [15] | Liang Y J, Zhong F L, Xu Z M. Driving forces and changes in landscape pattern of land utilization based on RS and GIS in Zhangye city, Gansu province. Journal of Lanzhou University: Natural Sciences, 2010, 46(5): 24-30. |
| [16] | Liu L, Liu X H. Landscape pattern and ecosystem service function of Loess Plateau during 1990-2000. Journal of Arid Land Resources and Environment, 2011, 25(5): 8-13. |
| [17] | Zhang J X, Zhang B, Yin H X, Wang Y Y, Zhao Y F. Landscape pattern changes of vegetation coverage in Loess Plateau of Northwest China in 2000-2011. Chinese Journal of Ecology, 2013, 32(2): 452-458. |
| [18] | Li B, Zhang J T. Landscape pattern analysis for Loess Plateau. Environmental Science and Technology, 2005, 28(3): 39-40. |
| [19] | Guo T Y, Xu Y, Yang G A. Land use change and man-land relationship evolution in Yan' an region. Research of soil and water conservation, 2004, 11(3): 61-65. |
| [20] | Zhao Y H, Jia X, Liu J C, Liu G. Analysis and forecast of landscape pattern in Xi'an from 2000 to 2011. Acta Ecologica Sinica, 2013, 3(8): 2256-2563. |
| [21] | Wei J J. Land Use Change and Its Driving Forces in Demonstrational Area in Yan'an. Yangling: Northwest A&F University, 2007. |
| [22] | Fang X. Dynamic Changes of Land Use Pattern and Ecological Function Zoning at Town Scale, Loess Plateau-a Case in Hechuan Town, Guyuan City, Ningxia Hui Autonomous Region, China. Beijing: Graduate University of Chinese Academy of Sciences, 2011. |
| [23] | Chen G J. Study on influence degree of converting slope farmland into forestland and grassland on land use change-a case study of Yan'an ecological construction demonstration area. Journal of Natural Resources, 2006, 21(2): 274-279. |
| [24] | Zhuo J, Deng F D, Liu A L, Zhou H, Zhao Q L. Land use and slope gradient differentiation over Yan'an hilly and gully area. Meteorological Science and Technology, 2008, 36(2): 219-222. |
| [1] | 伍业钢, 李哈滨. 景观生态学的理论发展 // 邬建国. 当代生态学博论. 北京: 中国科学技术出版社, 1992. |
| [2] | 傅伯杰, 陈利顶, 马克明. 景观生态学原理及应用. 北京: 科学出版社, 2001. |
| [14] | 毕晓丽, 周睿, 刘丽娟, 洪军, 王兮之, 王辉, 索安宁, 葛剑平. 泾河沿岸景观格局梯度变化及驱动力分析. 生态学报, 2005, 25(5): 1041-1047. |
| [15] | 梁友嘉, 钟方雷, 徐中民. 基于RS和GIS的张掖市土地利用景观格局变化及驱动力. 兰州大学学报: 自然科学版, 2010, 46(5): 24-30. |
| [16] | 刘琳, 刘雪华. 黄土高原1990-2000年间的景观格局演变及生态系统服务功能分析. 干旱区资源与环境, 2011, 25(5): 8-13. |
| [17] | 张建香, 张勃, 尹海霞, 王媛媛, 赵一飞. 2000—2011年黄土高原植被景观格局变化. 生态学杂志, 2013, 32(2): 452-458. |
| [18] | 李斌, 张金屯. 黄土高原土壤景观格局特征分析. 环境科学与技术, 2005, 28(3): 39-40. |
| [19] | 郭腾云, 徐勇, 杨国安. 延安市土地利用变化与人地关系状态演变. 水土保持研究, 2004, 11(3): 61-65. |
| [20] | 赵永华, 贾夏, 刘建朝, 刘耿. 基于多源遥感数据的景观格局及预测研究. 生态学报, 2013, 3(8): 2256-2563. |
| [21] | 卫建军. 延安示范区土地利用变化及驱动力分析 [D]. 杨凌: 西北农林科技大学, 2007. |
| [22] | 方炫. 黄土高原乡级尺度土地利用格局动态变化与生态功能区研究 [D]. 北京: 中国科学院研究生院(教育部水土保持与生态环境研究中心), 2011. |
| [23] | 陈国建. 退耕还林还草对土地利用变化影响程度研究——以延安生态建设示范区为例. 自然资源学报, 2006, 21(2): 274-279. |
| [24] | 卓静, 邓凤东, 刘安麟, 周辉, 赵青兰. 延安丘陵沟壑区土地利用类型坡度分异研究. 气象科技, 2008, 36(2): 219-222. |