 2014, Vol. 34
文章信息
- 赵丹丹, 刘俊国, 赵旭
- ZHAO Dandan, LIU Junguo, ZHAO Xu
- 基于效益分摊的水电水足迹计算方法——以密云水库为例
- A new approach to assess the water footprint of hydropower:a case study of the Miyun reservoir in China
- 生态学报, 2014, 34(10): 2787-2795
- Acta Ecologica Sinica, 2014, 34(10): 2787-2795
- http://dx.doi.org/10.5846/stxb201306091530
-
文章历史
- 收稿日期:2013-6-9
- 网络出版日期:2014-2-20


IPCC关于可再生能源的专题报告[1]标志着可再生能源取代化石能源的行动取得了里程碑式的进展。水力发电是最备受关注的可再生能源,具有低碳、环境友好等诸多优点。但是水力发电过程同时消耗了另一项重要资源,即水资源。水力发电约占全球发电量的21%。水力发电所产生的水资源消耗同样也会加剧水资源短缺问题[2,3,4,5,6]。
水资源已经成为人类可持续发展的重要限制因素。社会和经济的发展,必须考虑水资源的可持续开发利用。水足迹是由荷兰屯特大学Hoekstra教授于2002年提出的一个新概念,指一个国家、一个地区或一个人,在一定时间内消费的所有产品和服务所需要的水资源数量[7]。水足迹通过识别人类生产和消费行为对水资源的消耗和污染,来衡量人类对地区水资源和水环境的影响。水足迹为理解消费者和生产者与淡水系统之间的关系提供了更加合理和广阔的视角[8,9]。
水足迹的概念近年来开始用于衡量能源生产过程中直接和间接消耗的水资源情况[2, 3, 10]。Glecik、Herath、Mekonnen[5, 6, 11]等人采用水电站的蒸发耗水量衡量水力发电所产生的水足迹(以下简称“水电水足迹”)。研究结果表明,不同地区的不同水电站其水电水足迹存在很大的差异,最小的仅有0.01 m3/GJ[11],最大的却达到了846 m3/GJ[6]。但目前水电水足迹的研究仍处于初级阶段[3, 4, 5, 6, 11, 12, 13, 14, 15, 16, 17, 18]。而且以往研究往往将水库的水足迹等同于水电水足迹,忽略了多功能水库的水足迹在不同生态服务功能之间的分摊,因而不可避免的高估了水电水足迹。
中国是水力发电大国。过去的50年,中国的水电发展迅速,装机容量达到145 GW,是世界水电装机容量最多的国家[19]。2008年,国家发展和改革委员会公布的电能发展政策中,特别关注可再生能源的发展,尤其是水电,到2020年,总装机容量力争达到300 GW[20]。2012年底国务院颁布的《中国能源政策白皮书》中要求,到2020年非化石能源占一次能源消费比重将达到15%左右,其中一半以上将来自于水电。可见水电在电力行业的地位日益提升。定量评估水力发电所伴生的环境与水资源问题已经刻不容缓。本文基于已有研究,对水电水足迹[6]计算方法进行了订正,加入水电效益分摊系数这一因子,使得水电水足迹计算更为合理。并选取我国密云水库作为研究案例,对其1998—2004年间的水电水足迹进行了核算。
1 研究方法概述 1.1 通用的水电水足迹计算方法一件产品的水足迹指用于生产该产品的整个生产供应链中的耗水量之和[8,9]。水足迹通常包括三部分:绿水足迹、蓝水足迹和灰水足迹[8,9]。绿水足迹指产品对绿水资源(土壤水)的消耗;蓝水足迹指产品对蓝水(地表水和地下水)资源的消耗;灰水足迹是与污染有关的指标,定义为以自然本底浓度和现有的环境水质标准为基准,将一定的污染物吸收同化所需要的淡水的体积[8]。水库或水电站只消耗地表水(蓝水),不消耗土壤水(绿水);另水库或水电站灰水产生量也相对较少,以往研究往往不考虑其灰水足迹[6]。
目前国际上主要有3种核算水电水足迹的方法:总蒸发耗水法、净蒸发耗水法和水量平衡法,其中总蒸发耗水法的应用最为广泛。总蒸发耗水法指产生单位能量所需要消耗的总的水库蒸发量,等于某一水库的总的年蒸发量除以水库的年发电量。该方法最先由Gleick[11]在计算美国加利福尼亚州水电耗水问题时使用,随后,Torcellini[13]、Pasqualetti[14]、Gerbens-Leens[3]、Mekonmen[6]等人用此种方法计算美国、新西兰甚至全球的水电水足迹。
净蒸发耗水法将水库建造前的地表蒸发量考虑在内,认为计算发电耗水时应该把这部分蒸发量扣除掉。因此净蒸发耗水法实际是指产生单位能量所消耗的水库净蒸发量。该方法由Herath等[5]于2010年计算新西兰水电站耗水量时提出,2012年Yesuf[17]用此方法计算了埃塞尔比亚地区的水电水足迹,2013年Demeke[18]用此种方法计算了澳大利亚、土耳其等国家的水电站耗水量。
水量平衡法则是将水库看作一个闭合流域,将水库水量的输入输出都考虑在内,输入水量通常指水库水面上方的大气降水,输出水量则为水库的水面蒸发。二者的差值代表水库特定时间内的水量变化,再除以相应时间内的发电量就等于单位发电量的消耗水量。此种方法由Herath等[5]于2010年提出,2012年Arnc|y[15]用这种方法计算了挪威地区的水电站耗水量。
水电耗水量的计算目前国内研究较少,且以定性描述为主。孙旭成等[21]针对小型水电站运行调度新技术,对提高单位发电量的耗水率做了初步的研究。张祎等[22]估算了葛洲坝蓄水后的逐年月的蒸发量。但目前尚不存在专门针对水电水足迹的研究。
1.2 基于效益分摊的水电水足迹计算方法目前通用的水足迹计算方法往往将水库水足迹等同于水电水足迹。严格的讲,该种方法只适用于水库只有单一的生态系统服务功能,即水力发电的情况,但不适用于多功能用途的水库。水库往往具有发电、供水、防洪、娱乐、水产品等多种类别的生态系统服务功能[20]。采用传统的计算方法不可避免的会高估水电水足迹。因此,对能够同时产生多种类别的产品以及生态系统服务功能的研究对象,有必要按照不同的类别对其总体水足迹进行分摊。具体公式如下:
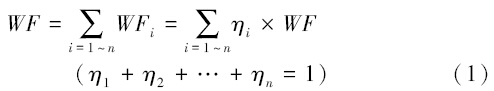
式中,WF为总体水足迹,WFi为第i项生态系统服务功能所需要的水足迹,ηi为分摊系数,即根据统一的核算标准所确定的分摊权重。
以上改进方法的关键是分摊系数的确定。而一种可行的办法是按照各项生态系统服务功能价值比例,即按照各类别所产生的经济效益比例,对总体水足迹进行分摊。即通过各项生态系统服务能够转化成为价值这一统一的标准实现水足迹的分摊。根据这一改进方法计算水电水足迹的具体过程为:首先计算水库提供的各项生态系统服务功能所产生的经济效益;相应得到发电这一服务功能产生的经济效益占水库总体经济效益的比例,该比例定义为水电效益分摊系数;然后将总蒸发耗水与水电效益分摊系数相乘得到水力发电的水足迹,即将水电水足迹从水库水足迹中分离出来。
水库水足迹计算公式为:

式中,WF为水库水足迹(m3/a);E为水面蒸发(mm/a);A为水库水面面积(hm2);10为将mm转化成m3的比例常数。
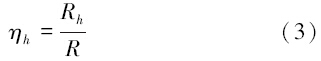
水电效益分摊系数ηh定义为一个水电站年发电效益(Rh)占水库总效益(R)的比例:
水电水足迹WFh可用如下公式计算

单位水电水足迹,即单位发电量消耗的水量,计算方法如下:
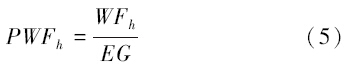
式中,PWFh为单位水电水足迹(m3/GJ);WFh为水电水足迹(m3/a);EG为水库或者水电站年发电量(GJ/a)。
对于水库各项服务功能效益,本文采用能值的方法进行计算[24,25]:首先确定某种服务功能所需要的能量;然后确定相应功能的能值转化率,也就是单位某种能量所含太阳能值之量,从而获得某种服务功能的总太阳能值量;最后用太阳能值总量除以相应的能值货币比(单位货币能购买能值量,数量上等于一个国家的年能值利用总量除以当年的GNP),从而获得某种服务功能的能值货币价值,也就是该种服务功能的经济价值[24,25,26]。
2 应用实例本文以北京市密云水库为例,定量计算1988—2004年密云水库水电水足迹状况。
2.1 研究区概况密云水库位于北京市郊区密云县城北部山区,距首都北京约 100 km,水库大坝位置为东经116°50′ 17″,北纬40°29′13″。水库兴建于1958 年 9 月,1959 年汛期拦洪,1960 年 9 月基本建成,目前仍在正常运行。水库最高蓄水位159.9 m,水库最大蓄水量为 43.75 亿 m3,防洪库容 18.97 亿 m3,兴利库容 20.41 亿 m3,最大水面面积 188 km2,是华北地区第一大水库[27]。主要入库河流为潮河和白河。水库位于温带大陆季风气候,年均气温6—10 ℃,多年平均降水量为500—700 mm,年内分配很不均匀,7、8 月份降水占全年的70%,且多以暴雨形式出现。
密云水库以供水、灌溉为主,兼具发电、渔业和旅游的多功能水库。水力发电是密云水库初期建设的主要目的。密云水库是以水定电,即供水时发电,不供水时停止发电,自建成以来,1960—1997年累积发电27.87亿kWh,为密云县以及周边县市提供电力。自1998年之后,由于发电水头超标、机械设备老化等问题,密云水电厂发电量逐年减少,2006年以后,基本不发电。
2.2 密云水库水电水足迹 2.2.1 效益分摊系数η的确定首先确定密云水库包括供水、防洪、发电、渔业和旅游等5项主要生态系统服务功能[28]。1998年—2004年水电效益分摊系数,根据水力发电量数据,结合能值方法进行核算。其它各项服务功能以及1998年之前的水电效益系数,根据胡艳霞、周连第[28]等按照能值方法计算的生态系统服务价值进行核算。最终计算结果如表 1所示。可以看出,1998年之前,水库供水所产生的生态系统服务功能价值最大,其次是防洪和发电。1998年之后发电价值逐年减少,到2004年仅占总价值的1%。
|
年代 Year | 供水 Water supply | 防洪 Flood control | 发电 Hydroelectricity value | 渔业 Fishery value | 旅游 Travel value |
| 1988 | 0.55 | 0.15 | 0.16 | 0.04 | 0.09 |
| 1990 | 0.55 | 0.15 | 0.16 | 0.05 | 0.09 |
| 1991 | 0.53 | 0.15 | 0.17 | 0.05 | 0.09 |
| 1992 | 0.52 | 0.15 | 0.16 | 0.05 | 0.10 |
| 1994 | 0.52 | 0.15 | 0.16 | 0.05 | 0.10 |
| 1996 | 0.50 | 0.16 | 0.17 | 0.06 | 0.11 |
| 1998 | 0.50 | 0.16 | 0.16 | 0.05 | 0.13 |
| 1999 | 0.51 | 0.16 | 0.14 | 0.05 | 0.13 |
| 2000 | 0.54 | 0.17 | 0.10 | 0.06 | 0.13 |
| 2001 | 0.57 | 0.18 | 0.05 | 0.06 | 0.14 |
| 2002 | 0.58 | 0.18 | 0.03 | 0.06 | 0.15 |
| 2003 | 0.59 | 0.18 | 0.02 | 0.06 | 0.15 |
| 2004 | 0.53 | 0.21 | 0.01 | 0.07 | 0.17 |
选取密云水库白河站点[29]观测数据,统计水库1985—2004年各年平均水面蒸发量,结果如附表 1所示。结合曹荣龙、房孝铎、宫兆宁[30,31,32]等人的研究,确定水库水面面积。水库水足迹结果如表 2所示。由于水库蒸发量和水面面积受当年水文条件影响较大,水库水足迹介于81.5—237.7×10⁶m3。1988—2004年最大水库水足迹相当于最小水足迹的3倍。本研究按照丰、平、枯特征年对水库水足迹进行区分。根据密云水库多年降雨量与径流系数表[33],按照水文情报预测规范(GB/T22482—2008)[34]要求,获得1985—2004年水库各年水库丰枯情况,计算结果见附表 2。结合实际情况,选取11个年份做为水库平、丰、枯3种特征年代表年份,将水库水足迹按照不同特征年进行分类,并取平均值,得到丰、平、枯年份各自平均水足迹(图 1)。从图 1看出,丰水年与枯水年相比,其水库水足迹明显较大,这主要是因为丰水年水面蒸发比枯水年增加约30%以上。由于在研究年中只有1年是平水年,其结果的代表性还有待商榷。
|
年份 Year | 年份特征 Year feature | 蒸发量 Evaporation /(mm/a) | 水面面积 Water surface area/km2 | η | 水库水足迹 Reservoir WF/106m3 | 水电水足迹 Hydropower WF/106m3 | 发电量 Hydroelectric generation/ 108 kWh | 单位水电水足迹 (不考虑η) PWF Product water footprint/ (m3/GJ) | 单位水 电水足迹 (考虑η) PWFh |
| 1988 | 平水年 | 1409.3 | 115.8 | 0.16 | 163.2 | 26.9 | 0.74 | 613.5 | 101.0 |
| 1990 | 丰水年 | 1264.1 | 188.0 | 0.16 | 237.7 | 38.8 | 0.74 | 893.4 | 145.8 |
| 1991 | 丰水年 | 1348.2 | 154.6 | 0.17 | 208.4 | 34.8 | 0.74 | 783.6 | 131.0 |
| 1992 | 枯水年 | 1373.0 | 147.2 | 0.16 | 202.1 | 33.3 | 0.74 | 759.8 | 125.1 |
| 1994 | 丰水年 | 1314.3 | 173.3 | 0.16 | 227.8 | 37.5 | 0.74 | 856.3 | 141.0 |
| 1996 | 丰水年 | 1197.5 | 166.0 | 0.17 | 198.8 | 34.4 | 0.74 | 747.3 | 129.3 |
| 1998 | 丰水年 | 1229.9 | 154.4 | 0.16 | 189.9 | 30.0 | 0.70 | 753.6 | 118.9 |
| 1999 | 枯水年 | 1355.6 | 143.7 | 0.14 | 194.8 | 28.1 | 0.60 | 901.7 | 130.0 |
| 2000 | 枯水年 | 1441.2 | 120.0 | 0.10 | 172.9 | 17.5 | 0.40 | 1201.0 | 121.3 |
| 2002 | 枯水年 | 1421.4 | 107.2 | 0.03 | 152.4 | 4.2 | 0.10 | 4232.6 | 115.6 |
| 2004 | 枯水年 | 1363.4 | 59.8 | 0.01 | 81.5 | 1.2 | 0.05 | 4529.5 | 67.3 |

|
| 图 1 不同特征年份水足迹比较 Fig.1 Comparison between different feature years |
水电水足迹计算结果见表 2。1988—2004年平均水电水足迹为127 m3/GJ。倘若不考虑效益分摊,按照传统的方法,将水库水足迹等同于水电水足迹,则水电水足迹为897.2 m3/GJ,是考虑效益分摊以后的水电水足迹的7倍。不考虑效益分摊明显会导致水电水足迹的高估。不考虑效益分摊的最大水电水足迹(1990年)为237.7×106m3,但考虑效益分摊后水电水足迹仅为38.8×106m3。不考虑效益分摊的最小水电水足迹(2004年)为81.5×106m3,但考虑效益分摊后水电水足迹仅为1.2×106m3,仅为不考虑效益分摊时的1%。
倘若不考虑效益分摊,按照传统方法计算的单位水电水足迹在1998年以前变化不明显,但1998年以后有明显增大。这是因为自1998年以后,密云水库发电量逐步减少,导致单位水库水足迹有明显增大的趋势。1998—2004年最小值为613.5 m3/GJ(1988年),最大值达到4529.5 m3/GJ(2004年),平均水足迹为897 m3/GJ。而按照改进方法计算的单位水电水足迹变化幅度较小,在50—150 m3/GJ之间波动,单位水电水足迹最小为67.3 m3/GJ(2004年),最大为 145.8 m3/GJ (1990年),平均水足迹为127 m3/GJ。2004年发电量发电仅有500万kWh,相应的分摊系数仅有0.05。传统方法下单位水电水足迹最大的年份(2004年),应用改进方法后该年的单位水电水足迹反而成为最小。考虑效益分摊更能够体现水电水足迹的真实情况。
3 讨论与结论本文提出如下问题:水库通过耗水而产生包括水电在内的多种生态系统服务功能的情况下水电水足迹应如何计算?传统水足迹计算方法将水库水面的蒸发消耗量视为水电水足迹[3, 4, 5, 6, 11, 12, 13, 14, 15, 16, 18]。本文通过引入分摊系数这一概念,对多功能水库各项功能类别按照其生态系统服务功能价值比进行分摊,从而得到基于效益分摊系数的水足迹,为水电水足迹核算提供了新的思路。
水力发电所提供的电力服务功能,其直接获益者是水电开发者。通过效益分摊法,发电效益占水库总效益比例越高,产生的水足迹越大。由于水库提供的各项生态服务功能获益方不同,通过效益分摊法有利于明确水资源消耗的责任人,在未来的水库水资源定价与收费管理中具有一定的参考价值。但同时我们也认识到,效益分摊的方法选择和数据获得不可避免的存在主观和不确定因素,从而使得分摊结果不唯一。对此本文的目的只是提供一种可行的方法。而在具体操作中,这一问题可以通过利益方参与、谈判共同确定分摊系数来解决。
此外,有三方面问题还需要继续进行更为深入的研究。(1)本研究仅限于计算水库水面蒸发耗水产生的水足迹,不包括水库发电供应链上的水足迹,例如在水库建造、运营、维护期间时产生的水足迹,未来水库水足迹研究应该将这部分水足迹加入,从而更全面量化水力发电全过程的水足迹。(2)绝大多数水库库容会随时间而不断变化,从而导致水库面积会有年内和年际的变化,而且水电站的发电量也存在年际和年内的波动,因此收集水库库容、面积及发电量数据时要统一时段和年份,以保证计算结果的一致性。计算水电水足迹的年内变化也是很有价值的研究。(3)对于水足迹的时间序列研究,如何考虑累积影响也是一个重要的课题。对于密云水库等一些水库来说,发电是初期水库建设的最主要驱动力,尽管后由于上游来水减少等原因导致发电量减少,但其对生态环境的影响却是巨大而深远的。如何将以上累积影响反映到分摊系数当中,还值得进一步研究。
水力发电一直被认为是一种清洁的可再生能源,许多国家把水力发电作为国家主要电力来源。但是水力发电同样存在着诸如蒸发耗水量大、水库淹没周边陆地导致生物多样性降低、库区移民安置困难等环境和社会问题。因此在未来的水库管理中,不仅要考虑可见的水资源消耗(如水库的入流和出流),同时也要考虑诸如“蒸发耗水”等不可见的水资源的消耗,采取措施降低水库的蒸发损失量,提高水库运行效率。
| 年份Year | 月份Month | 全年 Whole year | |||||||||||
| 1 | 2 | 3 | 4 | 5 | 6 | 7 | 8 | 9 | 10 | 11 | 12 | ||
| 1985 | 69.2 | 60.9 | 111.7 | 188.6 | 178.7 | 232.2 | 172.3 | 222.3 | 117.5 | 111.1 | 68.7 | 56.3 | 1589.5 |
| 1986 | 74.5 | 71.5 | 111.3 | 160.1 | 227.6 | 243.3 | 139.2 | 157.3 | 165.8 | 98.3 | 73 | 46.4 | 1568.3 |
| 1987 | 32.1 | 48.5 | 82.2 | 115.3 | 198 | 108.2 | 159.4 | 129.7 | 138.6 | 118.7 | 45.6 | 33.6 | 1209.9 |
| 1988 | 37.2 | 60.9 | 89 | 221.2 | 230.5 | 197.1 | 110.5 | 119.2 | 114.9 | 93.9 | 90.6 | 44.3 | 1409.3 |
| 1989 | 7.8 | 39.8 | 146 | 226.4 | 233.6 | 209.8 | 155.9 | 158.1 | 111.2 | 108.3 | 64.6 | 34.1 | 1495.6 |
| 1990 | 27.9 | 33.6 | 101 | 165.9 | 202.4 | 202.6 | 117.6 | 101.3 | 103.9 | 98.9 | 62 | 47 | 1264.1 |
| 1991 | 37.2 | 47.6 | 80.2 | 168.6 | 209.9 | 170.8 | 155.1 | 169.7 | 103.9 | 101.7 | 69.7 | 33.8 | 1348.2 |
| 1992 | 38.6 | 67.6 | 103.9 | 199 | 210.6 | 206.1 | 168.6 | 118 | 108.8 | 80.1 | 41.7 | 30 | 1373 |
| 1993 | 28.3 | 57.7 | 114 | 184 | 234 | 229 | 113 | 132 | 136 | 97 | 44.2 | 37.2 | 1406.4 |
| 1994 | 35.5 | 45.3 | 104.2 | 193.9 | 194 | 193.7 | 116 | 107.3 | 130.6 | 100.8 | 58.4 | 34.6 | 1314.3 |
| 1995 | 54.8 | 61.8 | 125.5 | 213 | 200 | 146.9 | 131.3 | 105.5 | 87.9 | 83.7 | 74.9 | 41.3 | 1326.6 |
| 1996 | 42.4 | 65.6 | 104.4 | 165.6 | 205.4 | 174 | 109.5 | 80.1 | 99.2 | 68.3 | 46.6 | 36.4 | 1197.5 |
| 1997 | 31.6 | 50.8 | 106.8 | 176.9 | 190 | 176.5 | 184.3 | 141.5 | 105.2 | 109.8 | 56.2 | 39 | 1368.6 |
| 1998 | 36 | 55.3 | 108.3 | 124.9 | 172.2 | 137.3 | 126.6 | 145.6 | 129.2 | 98.3 | 55.4 | 40.8 | 1229.9 |
| 1999 | 50.6 | 74.9 | 75.5 | 131.3 | 169.3 | 214.8 | 190.1 | 150.8 | 106.1 | 89.7 | 60.3 | 42.2 | 1355.6 |
| 2000 | 33.5 | 55.4 | 122.7 | 158.6 | 194 | 228.8 | 219.2 | 133.7 | 131.3 | 79.1 | 45.3 | 39.6 | 1441.2 |
| 2001 | 27.1 | 41.8 | 119.3 | 161 | 245 | 167 | 159.6 | 142.3 | 121.2 | 67.5 | 56.9 | 40.2 | 1348.9 |
| 2002 | 46.8 | 62.9 | 134.2 | 159.2 | 233.7 | 160.3 | 170.6 | 151.1 | 125.7 | 92.5 | 60.7 | 23.7 | 1421.4 |
| 2003 | 39 | 61 | 75.6 | 147.6 | 164.1 | 175.8 | 136.6 | 179.7 | 86.8 | 80.6 | 49.6 | 46.9 | 1243.3 |
| 2004 | 42.3 | 71 | 110.2 | 185.3 | 197.8 | 215.8 | 150.9 | 132.2 | 111.7 | 71.6 | 46.7 | 27.9 | 1363.4 |
| 平均Average | 39.62 | 56.695 | 106.3 | 172.32 | 204.54 | 189.5 | 149.315 | 138.87 | 116.775 | 92.495 | 58.555 | 38.765 | 1363.75 |
| 年份Year | 降雨量/(mm/a) Precipitation | 径流系数 Runoff coefficient | 径流量/ (mm/a) Runoff | P/% | 特征年份 Feature year | 多年平均径流量/(mm/a) Muti-year average runoff |
| 1985 | 443 | 0.11 | 48.7 | -11.5 | 枯水年 | 42.0 |
| 1986 | 613 | 0.11 | 67.4 | 22.4 | 丰水年 | |
| 1987 | 562 | 0.12 | 67.4 | 22.5 | 丰水年 | |
| 1988 | 446 | 0.12 | 53.5 | -2.8 | 平水年 | |
| 1989 | 471 | 0.08 | 37.7 | -31.6 | 枯水年 | |
| 1990 | 571 | 0.13 | 74.2 | 34.8 | 丰水年 | |
| 1991 | 445 | 0.14 | 62.3 | 13.1 | 丰水年 | |
| 1992 | 431 | 0.1 | 43.1 | -21.7 | 枯水年 | |
| 1993 | 321 | 0.08 | 25.7 | -53.4 | 枯水年 | |
| 1994 | 526 | 0.19 | 99.9 | 81.5 | 丰水年 | |
| 1995 | 417 | 0.08 | 33.4 | -39.4 | 枯水年 | |
| 1996 | 483 | 0.13 | 62.8 | 14.0 | 丰水年 | |
| 1997 | 270 | 0.09 | 24.3 | -55.9 | 枯水年 | |
| 1998 | 452 | 0.14 | 63.3 | 14.9 | 丰水年 | |
| 1999 | 241 | 0.03 | 7.2 | -86.9 | 枯水年 | |
| 2000 | 280 | 0.03 | 8.4 | -84.7 | 枯水年 | |
| 2001 | 377 | 0.07 | 26.4 | -52.1 | 枯水年 | |
| 2002 | 262 | 0.03 | 7.9 | -85.7 | 枯水年 | |
| 2003 | 295 | 0.03 | 8.9 | -83.9 | 枯水年 | |
| 2004 | 436 | 0.04 | 17.4 | -68.3 | 枯水年 |
|
年代 Year | 供水效益 Water supply value | 防洪效益 Flood control value | 发电效益 Hydroelectricity value | 渔业效益 Fishery value | 旅游效益 Travel value | 总计 Total |
| 1985 | 3.8 | 1 | 1.1 | 0.23 | 0.6 | 6.77 |
| 1986 | 3.8 | 1 | 1.1 | 0.23 | 0.6 | 6.77 |
| 1987 | 3.8 | 1 | 1.1 | 0.27 | 0.6 | 6.81 |
| 1988 | 3.7 | 1 | 1.1 | 0.3 | 0.6 | 6.68 |
| 1989 | 3.7 | 1 | 1.1 | 0.33 | 0.6 | 6.71 |
| 1990 | 3.7 | 1 | 1.1 | 0.36 | 0.6 | 6.74 |
| 1991 | 3.5 | 1 | 1.1 | 0.36 | 0.6 | 6.58 |
| 1992 | 3.5 | 1 | 1.1 | 0.36 | 0.7 | 6.68 |
| 1993 | 3.5 | 1 | 1.1 | 0.36 | 0.7 | 6.68 |
| 1994 | 3.5 | 1 | 1.1 | 0.36 | 0.7 | 6.68 |
| 1995 | 3.5 | 1 | 1.1 | 0.36 | 0.7 | 6.68 |
| 1996 | 3.2 | 1 | 1.1 | 0.36 | 0.7 | 6.36 |
| 1997 | 3.2 | 1 | 1.1 | 0.36 | 0.7 | 6.36 |
| 1998 | 3.2 | 1 | 1 | 0.34 | 0.8 | 6.34 |
| 1999 | 3.2 | 1 | 0.9 | 0.34 | 0.8 | 6.24 |
| 2000 | 3.2 | 1 | 0.6 | 0.34 | 0.8 | 5.94 |
| 2001 | 3.2 | 1 | 0.3 | 0.34 | 0.8 | 5.64 |
| 2002 | 3.2 | 1 | 0.15 | 0.34 | 0.8 | 5.49 |
| 2003 | 3.2 | 1 | 0.1 | 0.34 | 0.8 | 5.44 |
| 2004 | 2.5 | 1 | 0.07 | 0.34 | 0.8 | 4.71 |
| [1] | Edenhofer O, Pichs-Madruga R, Sokona Y, Seyboth K, Matschoss P, Kadner S, Zwickel T, Eickemeier P, Hansen G, Schlmer S, Stechow C V. IPCC Special Report on Renewable Energy Sources and Climate Change Mitigation. Cambridge, United Kingdom and New York: Cambridge University Press, 2011. |
| [2] | Fthenakis V, Kim H C. Life-cycle uses of water in US electricity generation. Renewable and Sustainable Energy Reviews, 2010, 14(7): 2039-2048. |
| [3] | Gerbens-Leenes P W, Hoekstra A Y, van der Meer T. The water footprint of energy from biomass: A quantitative assessment and consequences of an increasing share of bio-energy in energy supply. Ecological Economics, 2009, 68(4): 1052-1060. |
| [4] | Gleick P H. Water in Crisis: A Guide to the World′s Fresh Water Resources. Oxford: Oxford University Press, Inc., 1993. |
| [5] | Herath I, Deurer M, Horne D, Singh R, Clothier B. The water footprint of hydroelectricity: a methodological comparison from a case study in New Zealand. Journal of Cleaner Production, 2011, 19(14): 1582-1589. |
| [6] | Mekonnen M M, Hoekstra A Y. The blue water footprint of electricity from hydropower. Hydrology and Earth System Sciences, 2012, 16(1): 179-187. |
| [7] | Hoekstra A Y. Virtual water trade: proceedings of the international expert meeting on virtual water trade // Value of Water Research Report Series No12. vol. 1-100. Netherlands, Delft: UNESCO-IHE Institude for Water Education, 2003. |
| [8] | Liu J G, Zeng Z, Zhao Q B, Ma K, Zang C F. The Water Footprint Assessment Manual: Setting the Global Standard. Beijing: Science Press, 2012: 1-3. |
| [9] | Hoekstra A Y, Chapagain A K, Aldaya M M, Mekonnen M M. The Water Footprint Assessment Manual: Setting the Global Standard. London, UK.: Earthscan, 2011. |
| [10] | Mekonnen M M, Hoekstra A Y. National water footprint accounts: the green, blue and grey water footprint of production and consumption. Value of Water Research Report Series No. 50. In. Delft, The Netherlands: UNESCO-IHE, 2011. |
| [11] | Gleick P H. Environmental consequences of hydroelectric development: the role of facility size and type. Energy, 1992, 17(8): 735-747. |
| [12] | Gleick P H. Water and energy. Annual Review of Energy and the Environment, 1994, 19(1): 267-299. |
| [13] | Torcellini P A, Long N, Judkoff R. Consumptive water use for US power production. Washington, DC: National Renewable Energy Laboratory, 2003. |
| [14] | Pasqualetti M, Kelley S. The water costs of electricity in Arizona. Phoenix, Arizona: Arizona State University School of Geographical Sciences, 2008. |
| [15] | Arny S. Water Footprint Approaches in Life Cycle Assessment: State-of-the-Art and a Case Study of Hydroelectric Generation in the Hyanger Area. Norwegian University of Life Sciences (UMB), 2012. |
| [16] | Tefferi M E A. The effect of Ethiopian hydropower reservoirs on Blue Nile River flow regime. Norwegian University of Science and Technology, 2012. |
| [17] | Yesuf M B. Impacts of Cascade Hydropower Plants on the flow of the River System and Water level in Lake Turkana in Omo-Ghibe Catchment. Trondheim: Norwegian University of Science and Technology, 2012. |
| [18] | Demeke T A, Marence M, Munett A E. Evaporation from reservoirs and the hydropower water footprint. In: 16-18 April; Africa, Addis Ababa, Ethiopia 2013. |
| [19] | Huang H L, Yan Z. Present situation and future prospect of hydropower in China. Renewable & Sustainable Energy Reviews, 2009, 13(6/7): 1652-1656. |
| [20] | The Medium and Long-term Plan of Renewable Energy Source Develpoment. Beijing: The National Develpoment and Reform Committee, 2007. |
| [21] | Sun X C, Sun M R, Zhang X J, Wang J Z, Lu S J. Study on New Technologies of Small Hydropower Operation Scheduling, 2002. |
| [22] | Zhang Y, Niu L H, Fan Y. Calculation and analysis of the amount of water evoporation in Gezhouba reservoir after impoundment. Hydrology, 2000, 20(3): 33-35. |
| [23] | Ministery of water resources. Small hydropower development in China In. Beijing: Ministery of Water Resources, 2012. |
| [24] | Odum H T, Nilsson P. Environmental Accounting: Emergy and Environmental Decision Making. New York: Wiley, 1996. |
| [25] | Odum H T, Wang F C. Energy Analysis of Environmental Value. Florida: University of Florida, 1987. |
| [26] | Ulgiati S, Odum H, Bastianoni S. Emergy use, environmental loading and sustainability an emergy analysis of Italy. Ecological Modelling, 1994, 73(3/4): 215-268. |
| [27] | Wang J. Research on the Mechanism of the Distribution and Transportation and the Bearing Capacity of the Total Phosphorus in Miyun Reservoir [D]. Changchun: Jilin University, 2006. |
| [28] | Hu Y X, Zhou L D, Yan M C, Dong X B, Wu Z Q, Wei C S. The valuation and compensation policies suggestions of main capitals and services of Miyun reservoir. Jounal of Natural Resources, 2007, 22(4): 497-506. |
| [29] | Gao H L. Spatial and temporal variation of water surface evaporation in Miyun Reservoir. Beijing Waterworks, 2010, (5): 28-30. |
| [30] | Cao R L, Li C J, Liu L Y, Wang J H, Yan G J. Extracting Miyun reservor′s water area and monitoring its change based on a revised normalized different water index. Science of Surveying and Mapping, 2008, 33(2): 158-160. |
| [31] | Fang X D, Wang X Y, Lü J. Remote sensing dynamic investigation of land use change in Miyun County. Technology and Methodology, 2007, 24: 84-90. |
| [32] | Gong Z N, Zhang Y R, Gong H L, Zhao W J. Evolution of wetland landscape pattern and its driving factors in Beijing. Jounal of Geography, 2011, 66(1): 77-88. |
| [33] | Wang Z Y. Analysis on storage condition in Miyun reservoir. Beijing Waterworks, 2013, (2): 13-15. |
| [34] | China National Standardization Management Committee. Standard for Hydrological Information and Hydrological Forecasting. Beijing: China National Standardization Management Committee, 2008. |
| [8] | 刘俊国, 曾昭, 赵乾斌, 马坤, 藏传富. 水足迹评价手册. 北京: 科学出版社, 2012: 1-3. |
| [21] | 孙绪成, 孙民荣, 张相菊, 王家忠, 卢世久. 小型水电站运行调度新技术研究. 日照: 莒县青峰岭水库管理处, 2002. |
| [22] | 张祎, 牛兰花, 樊云. 葛洲坝蓄水以后库区蒸发水量的计算与分析. 水文, 2000, 20(3): 33-35. |
| [27] | 王静. 密云水库水体中总磷迁移转化机理及其承载能力研究 [D]. 长春: 吉林大学, 2006. |
| [28] | 胡艳霞, 周连第, 严茂超, 董孝斌, 吴志强, 魏长山. 北京密云水库生态经济系统特征、资产基础及功能效益评估. 自然资源学报, 2007, 22(4): 497-506. |
| [29] | 高海伶. 密云水库库区水面蒸发时空变化规律分析. 北京水务, 2010, (5): 28-30. |
| [30] | 曹荣龙, 李存军, 刘良云, 王纪华, 阎广建. 基于水体指数的密云水库面积提取及变化监测. 测绘科学, 2008, 22(2): 158-160. |
| [31] | 房孝铎, 王晓燕, 吕洁. 密云县土地利用变化遥感动态监测研究. 技术方法研究, 2007, 24: 84-90. |
| [32] | 宫兆宁, 张翼然, 宫辉力, 赵文吉. 北京湿地景观格局演变特征与驱动机制分析. 地理学报, 2011, 66(1): 77-88. |
| [33] | 王泽勇. 密云水库蓄水现状及成因分析. 北京水务, 2013, (2): 13-15. |
| [34] | 中国国家标准化管理委员会. (GB/T 22482—2008) 水文情报预测规范. 北京: 中国国家标准化管理委员会, 2008. |